RESEARCH ARTICLE
Available online at www.sciencedirect.com
ScienceDirect
Effects of plant density on cotton yield components and quality
ZHI Xiao-yu, HAN Ying-chun, LI Ya-bing, WANG Guo-ping, DU Wen-li, LI Xiao-xin, MAO Shu-chun,
FENG Lu
Institute of Cotton Research, Chinese Academy of Agricultural Sciences/State Key Laboratory of Cotton Biology, Anyang 455000, P.R.China
Abstract
Yield and fiber quality of cotton even varies within locules in a boll, but it is not clear how yield components and quality parameters are altered across seed positions of a locule (SPL). A field experiment was arranged in a split plot design with transgenic insect resistant Bt (Bacillus thuringiensis) cotton hybrid cultivar CRI75 and conventional cultivar SCRC28 as the main plots, and three plant densities (15 000, 51 000 and 87 000 plants ha–1) as the subplots in 2012 and 2013 at Anyang, Henan Province, China. Cotton was hand harvested by node and fruiting position, and then seeds of the first fruiting posi-tion bolls from nodes 6–10 were separated by SPL. The effects of plant density on lint yield, fiber quality, especially across SPL were determined. It was showed that plant densities of 51 000 and 87 000 plants ha–1 increased lint yield by 61.3 and 65.3% in 2012 and 17.8 and 15.5% in 2013 relative to low plant density (15 000 plants ha–1), however, no significant differ-ence was observed between 51 000 and 87 000 plants ha–1. The number of bolls (boll density) increased while boll weight decreased as plant density raised, and no significant changes occured in lint percentage in 2013 but increased with plant density in 2012. The number of bolls in upper nodes and distal fruiting positions, the number of seeds per boll, seed area (SA) and seed vigor index increased with decreasing plant density. Seed area was found to be greater from the base to the middle compared to the apex of a locule. Mote frequency (MF) increased as plant density increased, and fiber quality was the best at the middle of the locule regardless of plant density. As the number of fibers per seed area is genetically determined, adjusting plant density to produce more seeds and greater seed area can be a potentially promising alternative to improve lint yield in cotton. These findings might be of great importantance to cotton breeding and filed management. Keywords: cotton, plant density, yield, quality, seed position
1. Introduction
Cotton (Gossypium hirsutum L.) is an important cash crop worldwide, and Chinese cotton currently accounts for approximately 30% of the world’s total production (Dai and Dong 2014). Improvement in cotton yield and quality through optimal management practices is the eternal goal of cotton agronomists.
Cotton yields can be divided into individual yield compo-nents of the number of bolls (boll density), boll weight and Received 24 June, 2015 Accepted 2 September, 2015
ZHI Xiao-yu, E-mail: [email protected]; Correspondence FENG Lu, Tel: +86-372-2562293, Fax: +86-372-2562299, E-mail: [email protected]
© 2016, CAAS. Published by Elsevier Ltd. This is an open access article under the CC BY-NC-ND license (http:// creativecommons.org/licenses/by-nc-nd/4.0/)
lint percentage (McCarty et al. 2008). Worley et al. (1974) indicated that boll density was the largest contributor to lint yield. However, because cotton fiber is an extension of a seed’s epidermal cell, the most basic component of lint yield can be further dissected into smaller units such as seed number per boll (Worley et al. 1974) and number of fibers per seed (Clement et al. 2014). Bednarz et al. (2007) showed that the seed size affected the number of fibers per unit seed surface area and lint mass (Imran et al. 2012). Cotton fiber quality also depends on fiber properties such as average fiber length, fiber uniformity, micronaire value, and fiber strength (Bradow et al. 1997). However, Smith and Coyle (1997) noted that fiber length and strength were negatively correlated with basic with-in-boll yield components.
Cultivar selection (Kabiri et al. 2012; Braunack 2013) and plant density manipulation (Narkhede et al. 1996; De Oliveira et al.1999; Bednarz et al. 2006; Liu et al. 2012) have been widely used as the most effective agronomic practices in many countries. Numerous studies have been conducted on the effects of plant density and cultivar on cotton yield components (Bednarz et al. 2006a, 2007; Feng et al. 2010) and fiber quality parameters (Bednarz et al. 2006b; Feng et al. 2011). Bednarz et al. (2000) have shown that the number of bolls per plant was influenced by plant density. Boll weight and micronaire were gener-ally higher at lower plant density (Jones and Wells 1998). Yang et al. (2014) indicated that a rational plant density provided a better canopy micro-environment to gain higher yield. Moreover, the morpho-yield traits and fiber quality parameters are a function of the cultivar (Khan and Hassan 2011). An appropriate plant density may not only maximize cotton yield and fiber quality for a given cultivar but also reduce inputs by minimizing seed use without sacrificing yield. Boroomandan (2009) suggested that the number of seeds in a pod was quadratically related with plant density in soybean, showing that yield components within-fruit may be altered by plant density. However, few studies have focused on the differences in within-boll yield components under different plant densities, especially the seed and lint yield per seed as well as seed and fiber quality across seed positions in cotton locule. Also, cotton lint yield and fiber quality are integrated through whole-plant and with-in-boll yield components and quality parameters; thus it is necessary to study how the most basic within-boll yield components and fiber quality parameters are influenced by plant density and cultivar. The objective of this investiga-tion was, therefore, to determine how (i) yield components, seed quality and fiber quality parameters across all seed positions were altered with plant density and (ii) these parameters vary across seed positions.
2. Materials and methods
2.1. Experimental site
The field experiment was conducted in 2012 and 2013 at the experimental farm of the Institute of Cotton Research, Chinese Academy of Agricultural Sciences, Anyang, Henan Province, China (36°06´N, 114°21´E). The field has a medi-um loam soil with total N of 0.66 g kg–1, P of 0.01 g kg–1 and K of 0.11 g kg–1. The average temperatures from April to October were 22.3°C in 2012 and 21.6°C in 2013; sunshine duration was 1 092 h in 2012 and 1 157 h in 2013; active accumulated temperatures (≥15°C) were 4 338°C in 2012 and 3 998°C in 2013; and the total rainfall was 408.2 mm in 2012 and 480 mm in 2013.
2.2. Treatments, experimental design and manage-ment
The experiment was arranged into a split plot using a randomized complete block design with three replications. The main plots consisted of two transgenic insect resistant Bt (Bacillus thuringiensis) cotton (Gossypium hirsutum L.) hybrid cultivar CRI75 and conventional cultivar SCRC28 and the subplots consisted of three plant densities (15 000, 51 000 and 87 000 plants ha–1). The sub-plot was 8 m wide and 8 m long, consisting of 10 cotton rows with row spacing of 80 cm. The commercial Bt (Bacillus thuringiensis) cotton cultivar SCRC28 and the hybrid Bt cotton cultivar CRI75 were sown on 19 April, 2012 and 18 April, 2013. Each subplot was thinned to the targeted plant density at the three true leaves stage.
For both years, the land was ploughed and irrigated in early spring before sowing. The field received a basal ap-plication of 225 kg ha–1 N, 150 kg ha–1 P
2O5 and 225 kg ha–1 K2O before sowing. Supplemental irrigation was provided at approximately 45 mm, by flooding the furrows during the flowering stage. Other field managements were conducted according to local agronomic practices.
2.3. Data collection
Seed cotton in each sub-plot was hand harvested three times, before the 20th October for the pre-frost seed cot-ton. Lint yield and lint percentage for each subplot was determined after ginining. At each harvest, 50 open bolls of seed cotton were randomly harvested and weighed after drying, and then the average boll weight and number of bolls per unit ground area were determined based on the three harvests. During harvest, 20 plants from the middle portions of the two central rows in a subplot were manually
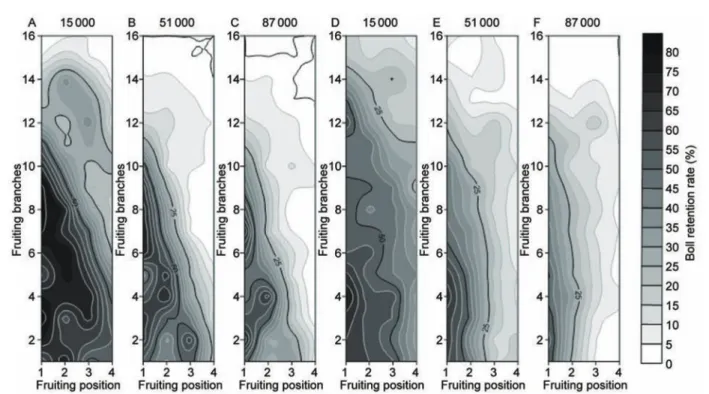
harvested by node and fruiting position on the 15th October 2012 and 10th October 2013. Cotton bolls from the same nodes and fruiting positions were combined as the primary samples, and boll number was recorded to study the spatial yield distribution characteristics within the cotton plants (Bednarz et al. 2000). Boll retention rate at each node (1–16) and fruiting position (1–4) was calculated as the boll number divided by 20 (number of samples from each plot), from which a contour map was made using Surfer12 (Golden Software Inc., USA). The OriginPro 8 and Adobe Illustrator CS5 were used to plot.
To determine locule-based yield components and quality parameters, the first fruiting position bolls of nodes 6–10 were selected for locule mapping (Feng et al. 2010); thus, 90 primary samples (1 fruiting position, 5 nodes, 18 plots) were used for the locule mapping. The locules of each boll were opened manually, and seeds were separated by seed position of a locule (SPL). The base of the locule was designated as SPL 1, and the SPL from the base toward the apex were successively numbered from 1 to 9. The 90 primary samples were split into 810 subsamples by locule mapping (9 SPL, 1 fruiting position, 5 nodes, 18 plots). Seed cotton yields (SY) and mote frequency (MF) at each SPL were recorded, and then the MF at each SPL was calculated. After the locule mapping, each subsample was ginned with a laboratory gin to separate lint from seeds, and the lint per seed (SL) and seed number (SN) were also recorded. The lint from different fruiting branches was combined by SPL for each plot. Combined lint samples were sent to the Testing Center of Cotton Quality, Ministry of Agriculture, Any-ang, Henan, for high volume instrument fiber analysis (HVI). Fiber quality parameters, namely fiber length (FL), fiber uni-formity (FU), micronaire value (FM) and fiber strength (FS), were analyzed. The FL was measured as 2.5% of the span length; FU was determined as the ratio of the mean length to the upper-half mean length expressed as a percentage; FS was determined as the force (cN tex–1) necessary to break the fiber bundle (Papastylianou and Argyrokastritis 2014) and FM was measured as the fineness and maturity of the fiber, expressed in standard micronaire units.
The seed samples were acid delinted, and the projected seed area (SA) from each SPL were determined using a scanner (Phantom 9800X, MiCROTEK, Shanghai, China) and Image-pro Plus 7.0 software (Media Cybernetics, Inc., country). After scanning, the seeds were subjected to a cool-warm vigor index (CWVI) test for the best indication of overall seed quality. The CWVI value is the sum of the germination percentages in the standard warm germination test (4 d) and cool germination test (7 d). Based on the CWVI test results, the seed quality was categorized into the following grades (Becker et al. 1999; Williams et al. 1999): excellent, CWVI of 160 or greater; good, 140–159; fair, 120–139; poor, less
than 120.
2.4. Statistical analysis
We checked our data for model assumptions of normality (normal Q-Q of fixed and random effects) and hypothesis test and no violation was encountered. Precipitation, air temperature and active accumulated temperatures were different in 2012 and 2013 from April through October at Anyang, Henan, China, data of each year was analyzed separately. All models were fit using factorial ANOVA Mixed-effects Model Proc MIXED (SAS, ver. 9.2, 2004). Yield, boll numbers, boll weight, seed cotton and lint yield per seed, seed area, seed vigor index, fiber length, micronaire value, and fiber strength were analyzed separately with linear mixed effect models, and multiple comparisons of means were performed using Tukey’s HSD test as:
2 e X S S m = (1) fe=α(m–1) (2) HSD0.05=q0.05(α,fe)×SX (3) Where, SX is standard error, Se is standard error, m is the number of replication, fe is degrees of freedom, HSD0.05 is Tukey HSD multiple comparison tests at 0.05 level, q0.05 is the q value at 0.05 level, α is the number of factor levels. Arcsine of the percentage or frequency data (pre-frost yield rate, frequency of Mote, fiber uniformity) which were not be-tween 30–70% was transformed to fit a linear mixed model, however, the original data were used for mean comparison. Significant plant density and cultivar interaction suggest-ed that the main effects of plant density and cultivar have to be interpreted with caution. As the effects of the different cultivars were not consistent across plant densities, we split the datasets and performed means multiple comparisons for the fixed effect of plant density and cultivar separately (Table 1). For the lint yield data of 2013, significant plant density and cultivar interaction was encountered. Therefore, we performed means multiple comparisons of SCRC28 and CRI75 (Fig. 1). The same applied to interactions between cultivar and SPL and plant density and SPL. We defined a difference to be significant if P<0.05.
3. Results
3.1. Yield
No significant differences in lint yield between cultivars were observed in 2012 but significant differences were found in 2013, and lint yield of SCRC28 increased by 13.2%. Lint yield increased significantly with increasing plant density and the 51 000 plants ha–1density increased yield by 38.0% (2012) and 15.1% (2013) compared with the 15 000 plants
ha–1. However, there was no significant increase between 51 000 and 87 000 plants ha–1 in both years (Table 1). There was considerable interactive effect of cultivar and plant density on lint yield in 2013 with the lint yield of SCRC28 being significantly higher than that of CRI75 across plant densities, especially at 87 000 plants ha–1. The highest lint yield of CRI75 occured at 51 000 plants ha–1 (Fig. 1).
Pre-frost yield rate was maximized at 51 000 plants ha–1, being 4.2% in 2012 and 3.5% in 2013 higher than at the lowest density (Table 1).
As shown in Table 1, the boll density increased signifi-cantly with plant density; the number under 87 000 plants ha–1 increased 20.2% in 2012 and 23.5% in 2013 compared with that under 51 000 plants ha–1, which in turn increased 26.3% (2012) and 12.1% (2013) compared with that under 15 000 plants ha–1. Conversely, the boll weight decreased 4.9% in 2012 and 4.8% in 2013 as plant density increased from 15 000 to 51 000 plants ha–1. Lint percent remained
stable across plant densities in 2013, but increased 3.1% at 87 000 plants ha–1 compared with that at 15 000 plants ha–1 in 2012 (Table 1).
3.2. Yield components
No significant interactive effect of cultivar and plant density was observed in either year. Boll retention rate varied inversely with plant density at the upper nodes (Fig. 2). In 2012, the rate at the upper nodes (above node 10) at 15 000 plants ha–1 was 5.0–35.0% higher than that at both 51 000 and 87 000 plants ha–1. In 2013, the boll retention rate at the upper nodes at 15 000 plants ha–1 was 10.0–25.0% higher than that at 51 000 plants ha–1; 5.0–15.0% higher at the 51 000 plants ha–1 than that at 87 000 plants ha–1 (Fig. 2). Boll retention rate at distal fruiting positions (beyond the 1st position) decreased with increasing plant density and the rates at 15 000 plants ha–1 was approximately 25.0 and 35.0% higher (P<0.01) than that at 51 000 plants ha–1 in 2012 and 2013. Similarly the rate at 51 000 plants ha–1 was approximately 15.0 and 25.0% higher (P<0.01) than that at 87 000 plants ha–1 in 2012 and 2013.
3.3. Within-boll yield components
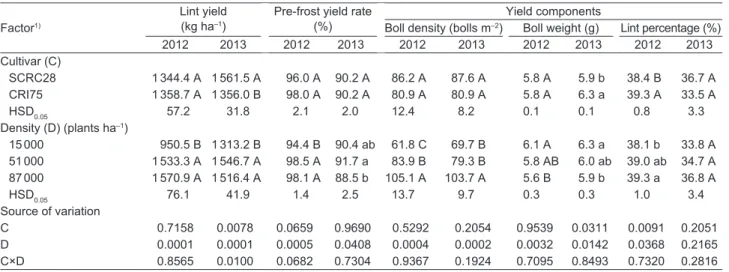
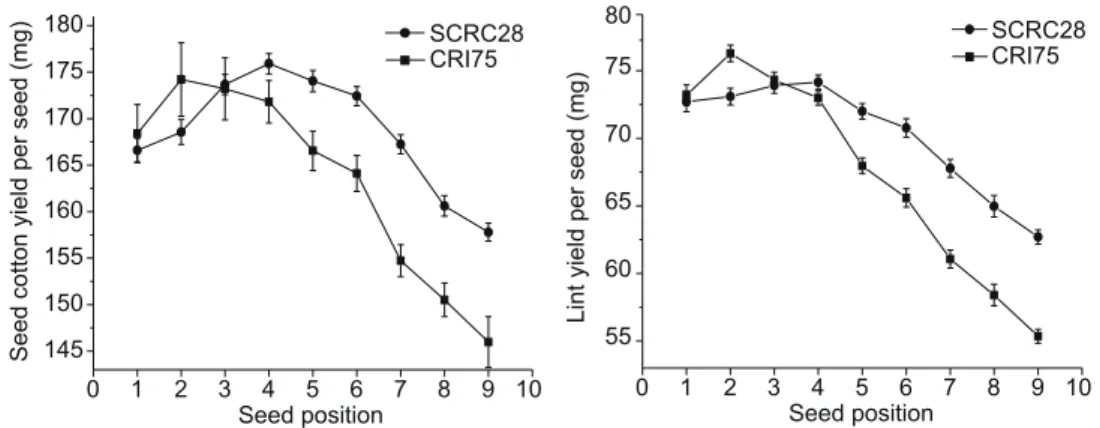
Seed cotton and lint yield per seed The lowest plant den-sity (15 000 plants ha–1) produced the greatest SY and SL, and both parameters at 51 000 and 87 000 plants ha–1 were not significantly different in 2012 (Table 2). The hightest SY and SL in 2013 was at 51 000 plants ha–1, being 11.7 and 13.8% higher than at 87 000 plants ha–1. At the within-boll level, both SY and SL varied with SPL. The highest SY and SL occurred at the middle and declined towards both ends of the boll. The lowest SY and SL occurred at the 9th SPL. Table 1 Effects of cultivar and plant density on lint yield and yield components in 2012 and 2013
Factor1)
Lint yield
(kg ha–1) Pre-frost yield rate (%) Boll density (bolls m–2)Yield componentsBoll weight (g) Lint percentage (%)
2012 2013 2012 2013 2012 2013 2012 2013 2012 2013 Cultivar (C) SCRC28 1344.4 A 1561.5 A 96.0 A 90.2 A 86.2 A 87.6 A 5.8 A 5.9 b 38.4 B 36.7 A CRI75 1358.7 A 1356.0 B 98.0 A 90.2 A 80.9 A 80.9 A 5.8 A 6.3 a 39.3 A 33.5 A HSD0.05 57.2 31.8 2.1 2.0 12.4 8.2 0.1 0.1 0.8 3.3 Density (D) (plants ha–1) 15 000 950.5 B 1313.2 B 94.4 B 90.4 ab 61.8 C 69.7 B 6.1 A 6.3 a 38.1 b 33.8 A 51 000 1533.3 A 1546.7 A 98.5 A 91.7 a 83.9 B 79.3 B 5.8 AB 6.0 ab 39.0 ab 34.7 A 87 000 1570.9 A 1516.4 A 98.1 A 88.5 b 105.1 A 103.7 A 5.6 B 5.9 b 39.3 a 36.8 A HSD0.05 76.1 41.9 1.4 2.5 13.7 9.7 0.3 0.3 1.0 3.4 Source of variation C 0.7158 0.0078 0.0659 0.9690 0.5292 0.2054 0.9539 0.0311 0.0091 0.2051 D 0.0001 0.0001 0.0005 0.0408 0.0004 0.0002 0.0032 0.0142 0.0368 0.2165 C×D 0.8565 0.0100 0.0682 0.7304 0.9367 0.1924 0.7095 0.8493 0.7320 0.2816 1) HSD
0.05, Tukey HSD multiple comparison tests, differences were considered significant at P<0.05.
Capital letters mean the difference at 0.01 level and lowercase represents the difference at 0.05 level.
51 000 87 000 0 700 1 400 Lint yield (kg ha –1)
Plant density (plants ha–1)
SCRC28 CRI75
15 000
Fig. 1 Interaction effect of plant density and cultivar on lint yeild in 2013. Bars are SD. The same as below.
Fig. 2 Boll distribution characteristics in 2012 (A, B, C) and 2013 (D, E, F). Notations 15000, 51000 and 87000 indicate 15000,
51000 and 87000 plants ha–1, respectively.
Table 2 Effects of cultivar and plant density on within-boll yield components across different seed positions in 2012 and 2013
Factor Seed cotton yield per seed (mg)2012 2013 2012Lint yield per seed (mg)2013 Seed area (cm2012 20132)
Cultivar (C) SCRC28 170.8 A 178.3 A 70.9 A 73.5 A 0.38 a 0.36 A CRI75 166.1 A 172.7 A 68.5 A 67.9 A 0.32 b 0.35 A HSD0.05 5.2 11.3 2.4 5.8 0.0207 0.0184 Density (D) (plants ha–1) 15 000 182.6 A 177.1 ab 74.7 A 70.8 ab 0.37 A 0.36 A 51 000 162.9 B 185.6 a 68.7 B 75.9 a 0.37 A 0.35 A 87 000 159.8 B 163.8 b 65.6 B 65.4 b 0.30 B 0.35 A HSD0.05 7.0 15.1 3.1 5.1 0.0281 0.0188 Seed position (SPL) 1 170.1 B 176.6 ab 74.5 A 77.3 AB 0.35 C 0.35 C 2 175.4 AB 200.4 a 76.3 A 85.6 A 0.35 C 0.36 B 3 176.5 A 177.2 ab 75.4 A 74.3 B 0.37 A 0.37 A 4 176.5 A 179.1 ab 75.7 A 73.5 B 0.36 B 0.37 A 5 172.9 AB 174.7 ab 70.8 B 69.3 BC 0.36 B 0.36 B 6 170.6 B 192.1 a 68.9 B 77.1 AB 0.35 C 0.36 B 7 162.3 C 163.6 b 64.8 C 63.2 CD 0.35 C 0.35 C 8 157.2 D 159.1 b 62.1 D 59.9 CD 0.34 D 0.34 D 9 153.7 D 156.6 b 59.5 E 56.3 D 0.33 E 0.33 E HSD0.05 4.9 25.9 2.2 10.2 0.0082 0.0026 Source of variation C 0.3151 0.5264 0.3142 0.2015 0.0279 0.8057 D 0.0003 0.0291 0.0005 0.0438 0.0003 0.1464 SPL <0.0001 0.0263 <0.0001 <0.0001 <0.0001 <0.0001 C×SPL <0.0001 0.1506 <0.0001 0.0852 0.1529 0.3009 C×D 0.3932 0.8001 0.6641 0.9712 0.0985 0.0809 D×SPL 0.0300 0.5663 0.0012 0.6123 0.1693 0.2724 C×D×SPL 0.5167 0.5184 0.7715 0.5310 0.2735 0.6426
In 2012, interactions between plant densities and SPL, and between cultivar and SPL were significant for SY and SL (Table 2). Both SY and SL of CRI75 were higher than those of SCRC28 at the base but lower at the middle and apex of the bolls (Fig. 3). In addition, the differences in SY and SL between CRI75 and SCRC28 were greater at the boll apex than at the base (Fig. 3). The effects of plant density on SY and SL were greater at the base than at the middle and apex of the boll (Fig. 4).
Seed number per boll and mote frequency per seed position The SN was not affected by cultivar but it de-creased significantly with increasing plant density (Fig. 5). At 87 000 plants ha–1, there were approximately 11 seeds (2012) and 3 seeds (2013) fewer than at 15 000 plants ha–1 and 7 seeds (2012) and 2 seeds (2013) fewer than at 51 000 plants ha–1.
The main factor of plant density on MF was significant in the both years (P>F: 0.0005 in 2012; 0.0231 in 2013). The highest plant density, 87 000 plants ha–1, resulted in the highest MF. No difference in MF was found between 15 000 and 51 000 plants ha–1. At the within-boll level, considerable interaction effects between cultivar and SPL on MF were found in the both years (Table 3). The lowest MF was
ob-served at the middle of the boll and increased towards both ends. The base of the bolls had the greatest MF (Fig. 6). In 2012, comparing with the MF of CRI75, the MF of SCRC28 was 3.0–22.0% higher from the base to the middle of the boll but 12.0–27.0% lower at the boll apex (Fig. 6). In 2013, the MF of SCRC28 was 7.0–20.0% higher than that of CRI75 across SPL.
Projected seed area As shown in Table 2, the SA de-creased as plant density inde-creased in 2012. At the within-boll level, the difference in SA was detected at different SPLs in the both years (Table 2). The largest SA (0.37 cm2) was found at the middle of the boll (3rd SPL in 2012; 3rd, 4th SPL in 2013), and the smallest at the boll apex (9th SPL). A gradual reduction in SA was observed from the middle to both ends of the boll. In 2012, the SA of SCRC28 was much greater than that of CRI75, but no difference was found in 2013.
3.4. Seed vigor and fiber quality parameters
CWVI The cool-warm vigor index (CWVI) was used as an indicator of overall seed quality. The seed vigor index was little different between cultivars but varied significantly among
0 1 2 3 4 5 6 7 8 9 10 55 60 65 70 75 80
Lint yield per seed (mg)
Seed position SCRC28 CRI75 0 1 2 3 4 5 6 7 8 9 10 145 150 155 160 165 170 175 180
Seed cotton yield per seed (mg)
Seed position
SCRC28 CRI75
Fig. 3 Interaction effects of cultivar and seed position on seed cotton yield (SY) and the lint per seed (SL) in 2012.
10 0 1 2 3 4 5 6 7 8 9 55 60 65 70 75 80 85
Lint yield per seed (mg)
Seed position 15 000 plants ha–1 51 000 plants ha–1 87 000 plants ha–1 15 000 plants ha–1 51 000 plants ha–1 87 000 plants ha–1 0 1 2 3 4 5 6 7 8 9 10 140 160 180 200
Seed cotton yield per seed (mg)
Seed position Fig. 4 Interaction effects of plant density and seed position on lint yield and seed cotton yield in 2012.
plant densities and SPL; it decreased with increasing planting density and was favorable at the base to middle of the boll. We categorized the seed quality as good overall (among cultivars and plant densities) and excellent at the base of the boll but fair at the boll apex based on the CWVI (Table 3). Fiber length and uniformity The main effect of cultivar on fiber length was significant in 2012 but not in 2013 (Table 4).
In 2012, the FL of SCRC28 was 0.3 mm shorter than that of CRI75; the FL was best at the plant density of 51 000 plants ha–1 and at the 3rd SPL. In 2013, the longest FL occured at 87 000 plants ha–1, but no significant difference was found between 51 000 and 87 000 plants ha–1. At the within-boll level, the FL of CRI75 was 0.5–1.7 mm longer than that of SCRC28, and the longest FLs of CRI75 (29.1 mm) and SCRC28 (28.6 mm) occurred at the 4th and 3rd SPL, respectively (Fig. 7).
In 2012, the FU of SCRC28 was 1.2% greater than that of CRI75 but there was no difference between cultivars in 2013 (Fig. 7). In 2013, the highest FU occurred at 51 000 plants ha–1, followed by 15 000 plants ha–1, and 87 000 plants ha–1 (Table 4). At the within-boll level, the interaction between cultivar and SPL had significant effect on FU in 2012 but not in 2013 (Table 4). The FU of SCRC28 was approximately 0.8–3.2% higher than that of CRI75, and the differences between the cultivars were more pronounced at SPL close to the apex. As observed for mean fiber length (Fig. 7), the 3rd SPL also had the greatest FU (85.0% for CRI75; 85.8% for SCRC28).
Micronaire and strength For both years, CRI75 had lower micronaire values than SCRC28 (Fig. 8), especially at the apex of the boll and values decreased with increasing plant Table 3 Effects of cultivar and plant density on seed quality across different seed positions in 2012 and 2013
Frequency of mote (%) Seed vigor index
2012 2013 2012 2013 Cultivar (C) SCRC28 51.7 A 39.1 A 149.7 A 149.5 A CRI75 45.4 A 26.4 A 156.5 A 155.4 A HSD0.05 6.5 12.9 7.4 7.4 Density (D) (plants ha–1) 15 000 40.1 B 27.7 b 157.9 a 157.9 A 51 000 41.6 B 30.9 b 151.1 b 151.1 B 87 000 64.0 A 39.7 a 150.3 b 150.3 B HSD0.05 6.5 7.9 5.6 5.9 Seed position (SPL) 1 71.9 A 85.7 A 155.5 C 155.5 AB 2 43.4 D 27.5 CDE 160.9 B 156.9 A 3 37.7 E 20.1 DE 168.4 A 158.4 A 4 36.1 E 19.2 E 154.5 CD 154.5 AB 5 37.3 E 19.3 E 157.1 BC 157.1 A 6 40.9 DE 21.7 DE 155.1 C 155.1 AB 7 46.0 CD 29.6 BCD 150.1 D 150.1 BC 8 51.3 BC 32.2 BC 143.2 E 143.2 D 9 55.3 B 39.0 B 139.1 E 147.1 CD HSD0.05 5.5 9.9 4.9 6.1 Source of variation C 0.1947 0.2026 0.1195 0.3241 D 0.0005 0.0231 0.0332 0.0003 SPL <0.0001 <0.0001 <0.0001 0.0011 C×SPL <0.0001 <0.0001 0.1698 0.2722 C×D 0.2103 0.5187 0.3060 0.1263 D×SPL 0.1041 0.0847 0.2204 0.5609 C×D×SPL 0.0851 0.4698 0.4112 0.2191 0 10 20 30 Seed number
Plant density (plants ha–1)
2013 2012
51 000 87 000 15 000
Fig. 5 Variations in seed number per boll at different plant densities in 2012 and 2013.
density. At the within-boll level, the micronaire gradually declined from the base toward the apex of the boll (Table 4). The cultivar effect on FS was significant in 2013 but not in 2012 (Table 4). In 2013, the FS of SCRC28 was 1.8% lower than that of CRI75. At the within-boll level, seed positions close to the boll apex had the lowest FS. In 2012, there were significant differences between CRI75 and SCRC28 in FS across SPL.
4. Discussion
4.1. Yield and yield components
Parabolic correlation was found between crop yields and plant density, if other factors are in an optimal level, thus either too high or too low plant density would sacrifice crop yield (Yang et al. 2014). This study confirmed the common 0 1 2 3 4 5 6 7 8 9 10 30 40 50 60 70 80 Frequency of motes (%) Seed position CRI75 SCRC28 CRI75SCRC28 0 1 2 3 4 5 6 7 8 9 10 20 40 60 80 Frequency of motes (%) Seed position A B
Fig. 6 Variations in the frequencies of motes per boll in 2012 (A) and 2013 (B).
Table 4 Effects of cultivar and plant density on fiber quality across different seed positions in 2012 and 2013
Factor Fiber length (mm)2012 2013 Fiber uniformity (%)2012 2013 2012Micronaire value2013 Fiber strength (cN tex2012 2013–1)
Cultivar (C) SCRC28 28.8 b 28.1 A 84.8 a 84.4 A 5.2 a 5.2 a 27.8 A 27.5 b CRI75 29.1 a 28.8 A 83.8 b 84.3 A 4.7 b 4.8 b 27.9 A 28.0 a HSD0.05 0.2 0.8 0.3 0.4 0.1 0.1 0.3 0.3 Density (D) (plants ha–1) 15 000 28.9 b 28.2 b 84.6 a 84.4 A 5.2 A 5.2 A 28.3 a 27.5 A 51 000 29.2 a 28.5 ab 84.4 ab 84.6 A 4.9 B 5.0 AB 27.6 b 27.8 A 87 000 28.9 b 28.6 a 83.9 b 84.1 A 4.7 B 4.8 B 27.7 b 27.9 A HSD0.05 0.2 0.3 0.5 0.5 0.2 0.2 0.4 0.4 Seed position (SPL) 1 28.9 BC 28.6 A 84.6 AB 84.8 A 5.2 A 5.4 AB 29.0 AB 28.1 AB 2 28.9 BC 28.1 B 84.5 AB 84.8 A 5.2 A 5.5 A 28.7 AB 28.0 ABC 3 29.4 A 28.5 AB 84.9 A 84.4 AB 5.0 AB 5.2 BC 29.1 A 28.1 AB 4 29.2 AB 28.7 A 84.5 AB 84.7 A 5.0 AB 5.1 C 27.9 CD 28.2 AB 5 29.3 A 28.6 A 84.6 AB 84.7 A 5.0 AB 5.0 CD 28.3 BC 28.4 A 6 28.9 BC 28.4 AB 84.1 B 84.4 AB 4.9 BC 4.8 DE 27.6 CDE 27.7 ABC 7 28.9 BC 28.4 AB 83.9 BC 83.9 B 4.8 BCD 4.7 EF 27.3 DE 27.5 BC 8 28.8 CD 28.4 AB 83.9 BC 84.0 B 4.7 CD 4.6 EF 27.1 E 27.3 CD 9 28.5 D 28.1 B 83.4 C 83.7 B 4.6 D 4.5 F 25.7 F 26.6 D HSD0.05 0.3 0.4 0.6 0.7 0.2 0.2 0.7 0.7 Source of variation C 0.0494 0.0801 0.0239 0.9845 0.0289 0.0353 0.7259 0.0272 D 0.0433 0.0475 0.0259 0.2824 0.0036 0.0056 0.0432 0.2229 SPL <0.0001 <0.0001 <0.0001 <0.0001 <0.0001 <0.0001 <0.0001 <0.0001 C×SPL 0.5563 0.0009 0.0058 0.2545 0.0311 <0.0001 0.047 0.6990 C×D 0.0854 0.2779 0.5990 0.9210 0.4985 0.5365 0.1037 0.5850 D×SPL 0.9907 0.5936 0.7629 0.0919 0.2135 0.9576 0.4379 0.8584 C×D×SPL 0.4299 0.4728 0.2355 0.1051 0.1583 0.3953 0.5470 0.2022
perception that cultivar and plant density were the most important management practices for improving lint yield and within-boll yield components. Snowden et al. (2013) showed that boll distribution characteristics were related to cotton maturity, which could determine yield and fiber quality. A previous report showed that the number of bolls per plant was influenced by plant density (Bednarz et al. 2000). In the present study, we found an inverse relationship between plant density and boll number at distal fruiting positions, which might be attributable to intense competition for limited resources as a result of the increased plant densities. The increased plant density resulted in fewer bolls at the upper nodes, which could be explained by the smaller number of main-stem nodes per plant (Jones and Wells 1998; Clawson et al. 2006).
In this study, the most basic within-boll yield components, the SY and SL decreased with increasing plant density. Bednarz et al. (2006a) also observed that individual seed size decreased as plant density increased. We found that the SA decreased with increasing plant density. Moreover, it has been reported that SY and SL were affected by SA (Bednarz et al. 2007; Jones et al. 2014), and Feng et al. (2010) showed that fiber number per unit seed surface area was a hereditary within-boll yield component. Thus, the
decreased SY and SL might be explained by the smaller SA at higher plant densities. Additionally, at the same plant density, the current results showed that the highest SY and SL were from the middle to base of the boll, and the lowest at the boll apex, a trend that was also observed for SA. One possible explanation for this pattern is that more dry matter was available at the base and middle of bolls than at the apexes (Tang and Xiao 2013).
Coyle and Smith (1997) concluded that selecting for the greatest possible number of small seeds per boll could improve lint yield. In addition, a greater number of seeds per boll is desirable because of the greater surface area for lint production within each boll (Bednarz et al. 2007; Jones et al. 2014). In this study, the SN decreased as plant density increased, as reported previously (Bednarz et al. 2006a; Feng et al. 2010). The SA decreased with increasing plant density, but the optimal plant density (51 000 plants ha–1) for maximizing seed numbers may increase the total seed surface area and hence the lint yield.
4.2. Seed and fiber quality
Previous studies on seed-set efficiency at different fruiting 0 1 2 3 4 5 6 7 8 9 10 82 83 84 85 86 87 Fiber uniformity (%) Seed position 0 1 2 3 4 5 6 7 8 9 10 27.5 28.0 28.5 29.0 Fiber length (mm) Seed position CRI75 SCRC28 CRI75SCRC28
Fig. 7 Interaction effects of cultivar and seed position on fiber length (2013) and uniformity (2012).
0 1 2 3 4 5 6 7 8 9 10 3.8 4.0 4.2 4.4 4.6 4.8 5.0 5.2 5.4 5.6 5.8 Micronaire Seed position 0 1 2 3 4 5 6 7 8 9 10 3.6 3.8 4.0 4.2 4.4 4.6 4.8 5.0 5.2 5.4 5.6 5.8 Micronaire Seed position CRI75 SCRC28 CRI75SCRC28 A B
positions recommended further research on seed vigor index (Bolek and Oglakci 2007). In the current study, an excel-lent seed vigor index was found at the base to the middle of the boll, and MF was relatively lower in those positions than at the boll apex. Seed vigor index increased while MF decreased as plant density decreased, suggesting a greater nutrient gain per seed at lower plant densities. The MF increased from the middle of the boll to both ends, although it was lower at the base than at the apex in 2012. The MF of CRI75 was lower than that of SCRC28 at the boll base in 2012, but that of CRI75 was always lower than that of SCRC28 across SPL in 2013, which indicated that MF was affected by environment (Davidonis et al. 2003) and cultivar (Ragsdale and Smith 2007). Interspecific hybrids (ISHs) of cotton have been reported to produce high numbers of motes (Saranga et al. 1998), which is inconsistent with ob-servations in the current study that the hybrid cultivar, CRI75 exhibited lower MF than SCRC28. This might be because the sunshine duration and active accumulated temperature in the study field were more suitable for CRI75. The MF in 2012 was higher than in 2013, possibly due to less sunshine duration at cotton growth period in 2012 than 2013.
Cotton fibers are initiated from single cells on the outer epidermis of seeds at anthesis. Fibers elongated from about 2 d after anthesis and the length was determined during the first 25 d after anthesis. Secondary wall formation occured from 15 to 45 d after anthesis, which determined fiber fine-ness, strength and maturity (Dong et al. 2006). Several factors could influence fiber quality, and Jones and Wells (1998) indicated that lower plant density produced more late-season bolls which exhibited poorer fiber properties due to insufficient heat units in late season. Longer and more uniform fibers are preferable. A previous study found that FL was not affected by plant density at the field level (when plots were machine harvested and seed cotton across fruit-ing positions was ginned together) (Bednarz et al. 2006a), but Bednarz et al. (2006b) showed that lower plant density resulted in longer FL at the canopy level (when plots were hand harvested and seed cotton across fruiting positions was separately ginned). However, the current study showed that FL was longer at higher plant densities while FU was lower and both FL and FU were the best at 51 000 plants ha–1 and from the base to the middle of the boll.
The FM which indicates fiber fineness and maturity decreased as plant density increased. A FM less than 3.5 indicates immature fiber that is prone to breakage, and FM greater than 5.0 is too thick. From our results, the FM at higher plant densities and at the middle and apex of the boll was favorable. However, the FS was not significantly affected by plant density. According to Smith and Coyle (1997), the FS is determined by a small number of major genes rather than by variations in the growth environment. Thus, to maximize fiber quality, cultivar selection is of the
greatest importance, whereas managing plant density to maintain or maximize genetic potential is the secondary (Bednarz et al. 2005; Ragsdale and Smith 2007).
5. Conclusion
Under fertilizer application before sowing condition, boll weight of cotton decreased with increasing plant density, possibly due to reductions in SN, SY and SL. Plant density not only influenced the boll weight at the plant level, espe-cially for bolls at upper nodes and distal fruiting positions, but also affected within-boll SY, SL, SN, SA, MF, seed vigor index, and fiber quality. From our data, the plant density of 51 000 plants ha–1 yielded better than other densities. Thus 51 000 plants ha–1 should be the optimal sowing density in the experimental area. Our data also indicated that SY and SL were greater at the apex than at the base or middle of a boll, while the MF was the lowest at the middle and increased from there to both ends of the boll. Seed vigor was excellent at the base of the boll but fair at the boll apex. The SA, FL and FU were good from the base to the middle of a boll and poor at the apex. Better quality fiber and seed were produced from the base to middle part of a boll at 51 000 plants ha–1.
Acknowledgements
This work was supported by the National Natural Science Foundation of China (31101118). We greatly appreciate the work of the technicians at the experimental station of the Institute of Cotton Research, Chinese Academy of Agricultural Sciences.
References
Becker W D, Hopper N W, McMichael B L, Jividen G M. 1999. Seed applied plant growth regulator effects on cotton
germination, emergence, and growth. In: Proceedings
Beltwide Cotton Conferences. Orlando, Florida, USA. pp. 625–627.
Bednarz C W, Bridges D C, Brown S M. 2000a. Analysis of
cotton yield stability across population densities. Agronomy
Journal, 92, 128–135.
Bednarz C W, Nichols R L, Brown S M. 2006b. Plant density
modifications of cotton within-boll yield components. Crop
Science, 46, 2076–2080.
Bednarz C W, Nichols R L, Brown S M. 2006. Plant density
modifies within-canopy cotton fiber quality. Crop Science,
46, 950–956.
Bednarz C W, Nichols R L, Brown S M. 2007. Within-boll yield
components of high yielding cotton cultivars. Crop Science,
47, 2108–2112.
Bednarz C W, Shurley W D, Anthony W S, Nichols R L. 2005. Yield, quality, and profitability of cotton produced at varying
Bolek Y, Oglakci M. 2007. Genetic variation among cotton (Gossypium hirsutum L.) cultivars for seed-set efficiency. Turkish Journal of Agriculture and Forestry, 31, 229–235. Boroomandan P, Khoramivafa M, Haghi Y, Ebrahimi A. 2009.
The effects of nitrogen starter fertilizer and plant density on yield, yield components and oil and protein content
of soybean (Glycine max L. Merr). Pakistan Journal of
Biologigal Sciences, 12, 378–382.
Bradow J M, Bauer P J, Hinojosa O, Sassenrath-Cole G. 1997. Quantitation of cotton fibre-quality variations arising
from boll and plant growth environments. Europe Journal
Agronomy, 6, 191–204.
Braunack M V. 2013. Cotton farming systems in Australia:
Factors contributing to changed yield and fibre quality. Crop
Pasture Science, 64, 834–844.
Clawson E L, Cothren J T, Blouin D C. 2006. Nitrogen fertilization and yield of cotton in ultra-narrow and conventional row
spacings. Agronomy Journal,98, 72–79.
Clement J D, Constable G A, Liu S M. 2014. Increasing cotton seed fibre density as a breeding strategy to improve fibre
fineness. Field Crops Research, 160, 81–89.
Coyle G G, Smith C W. 1997. Combining ability for within-boll
yield components in cotton, Gossypium hirsutum L. Crop
Science, 37, 1118–1122.
Dai J, Dong H. 2014. Intensive cotton farming technologies in China: achievements, challenges and countermeasures. Field Crops Research, 155, 99–110.
Davidonis G, Landivar J, Fernandez C. 2003. Effects of growth environment on cotton fiber properties and motes, neps,
and white speck frequency. Text Research Journal, 73,
960–964.
Dong H Z, Li W J, Tang W, Li Z H, Zhang D M, Niu, Y H. 2006. Yield, quality and leaf senescence of cotton grown at varying planting dates and plant densities in the Yellow River Valley
of China. Field Crops Research, 98, 106–115.
Feng L, Bufon V B, Mills C I, Hequet E, Bordovsky J P, Keeling W, Boman R, Bednarz C W. 2010. Effects of irrigation and plant density on cotton within-boll yield components. Agronomy Journal, 102, 1032–1036.
Feng L, Bufon V B, Mills C I, Hequet E, Bordovsky J P, Keeling W, Boman R, Bednarz C W. 2011. Effects of irrigation, cultivar, and plant density on cotton within-boll fiber Quality. Agronomy Journal, 103, 297–303.
Imran M, Shakeel A, Azhar F M, Farooq J, Saleem M F, Saeed A, Nazeer W, Riaz M, Naeem M, Javaid A. 2012. Combining ability analysis for within-boll yield components in upland
cotton (Gossypium hirsutum L.). Genetics and Molecular
Research, 11, 2790–2800.
Jones M A, Wells R. 1998. Fiber yield and quality of cotton
grown at two divergent population densities. Crop Science,
38, 1190–1195.
Jones W M, Joy K, Smith C W. 2014. Within-boll yield
components and fiber traits of Upland cotton. Crop Science,
54, 1057–1061.
Kabiri H, Saboori A, Allahyari H. 2012. Impact of different cotton (Gossypium spp.) cultivars, as host plant, on development and fertility life-table parameters of Tetranychus urticae
(acari: Tetranychidae). International Journal of Acarology,
38, 46–50.
Khan N U, Hassan G. 2011. Genetic effects on morphological
and yield traits in cotton (Gossypium hirsutum L.). Spanish
Journal of Agricultural Research, 9, 460–472.
Liu L, Chen H, Dai X, Wang H, Peng D. 2012. Effect of planting density and fertilizer application on fiber yield of ramie (Boehmeria nivea). Journal of Integrative Agriculture, 11, 1199–1206.
McCarty J C, Wu J, Jenkins J N. 2008. Genetic association of cotton yield with its component traits in derived primitive accessions crossed by elite upland cultivars using the
conditional ADAA genetic model. Euphytica, 161, 337–352.
Narkhede W N, Bharad G M, Kohale S K. 1996. Effect of plant density and drip irrigation on pre-monsoon cotton (Gossypium hirsutum). Indian Journal Agronomy, 41, 127–131.
De Oliveira F A, Bezerra J R C, Oliveira B C. 1999. Effect of irrigation management and plant population on herbaceous
cotton yield. Pesquisa Agropecuaria Brasileira, 34,
2185–2191.
Papastylianou P T, Argyrokastritis I G. 2014. Effect of limited drip irrigation regime on yield, yield components, and fiber quality of cotton under Mediterranean conditions. Agricultural Water Management, 142, 127–134.
Ragsdale P I, Smith C W. 2007. Germplasm potential for trait improvement in upland cotton: Diallel analysis of within-boll
seed yield components. Crop Science, 47, 1013–1017.
Saranga Y, Sass N, Tal Y, Yucha R. 1998. Drought conditions
induce mote formation in interspecific cotton hybrids. Field
Crops Research, 55, 225–234.
Smith C W, Coyle G G. 1997. Association of fiber quality parameters and within-boll yield components in upland
cotton. Crop Science, 37, 1775–1779.
Snowden C, Ritchie G, Cave J, Keeling W, Rajan N. 2013. Multiple irrigation Levels affect boll distribution, yield,
and fiber Micronaire in cotton. Agronomy Journal, 105,
1536–1544.
Tang F, Xiao W. 2013. Dry matter accumulation and partitioning
in various fractions of cotton bolls. Experimental Agriculture,
49, 543–555.
Williams K D, Hopper N W, Wedegaertner T. 1999. The germination and emergence responses of polymer-coated
fuzzy cottonseed. In: Proceedings of Beltwide Cotton
Conferences. Orlando, Florida, USA. pp. 623–625. Worley S, Culp T W, Harrell D C. 1974. The relative contributions
of yield components to lint yield of upland cotton, Gossypium
hirsutum L. Euphytica, 23, 399–403.
Yang G Z, Luo X J, Nie Y C, Zhang X L. 2014. Effects of plant density on yield and canopy micro environment in hybrid
cotton. Journal of Integrative Agriculture, 13, 2154–2163.