The Aquila Digital Community
The Aquila Digital Community
Master's Theses
Spring 5-1-2015
The Use of Technology in Secondary Mathematics Classrooms:
The Use of Technology in Secondary Mathematics Classrooms:
The Case of One School District
The Case of One School District
Cononiah Latrece WatsonUniversity of Southern Mississippi
Follow this and additional works at: https://aquila.usm.edu/masters_theses Part of the Science and Mathematics Education Commons
Recommended Citation Recommended Citation
Watson, Cononiah Latrece, "The Use of Technology in Secondary Mathematics Classrooms: The Case of One School District" (2015). Master's Theses. 111.
https://aquila.usm.edu/masters_theses/111
This Masters Thesis is brought to you for free and open access by The Aquila Digital Community. It has been accepted for inclusion in Master's Theses by an authorized administrator of The Aquila Digital Community. For
THE USE OF TECHNOLOGY IN SECONDARY MATHEMATICS CLASSROOMS: THE CASE OF ONE SCHOOL DISTRICT
by
Cononiah Latrece Watson
A Thesis
Submitted to the Graduate School of The University of Southern Mississippi in Partial Fulfillment of the Requirements
for the Degree of Master of Science
Approved: Dr. Rejoice Mudzimiri_________________ Committee Chair Dr. Sungwook Lee____________________ Dr. Jeremy Lyle______________________ Dr. Karen S. Coats____________________ Dean of the Graduate School
ABSTRACT
THE USE OF TECHNOLOGY IN SECONDARY MATHEMATICS CLASSROOMS: THE CASE OF ONE SCHOOL DISTRICT
by Cononiah Latrece Watson May 2015
Integration of technology into secondary education mathematics classes has been shown to increase student motivation and performance. In order for technology to be a component of students’ education, teachers must have training on various technologies available for their subjects of study. This research study surveys thirty-one 6-12th grade teachers in the Lamar County School District in southern Mississippi regarding
availability of technologies, use of technologies, and professional development needs concerning technology use.
DEDICATION
My family has always been the backbone of my motivation to further my education. I would like to dedicate this work to my grandfather, the late Reverend Roy McSwain. The lessons and teachings he instilled in me will never be forgotten.
I would like to especially thank my mother, Celeste M. Watson. Her support and prayers have aided in my success as a student and individual.
Everything I have learned and become is due to my Savior. It is because of God’s continued grace and mercy that this study is completed.
ACKNOWLEDGMENTS
I would like to thank my tireless advisor, Dr. Rejoice Mudzimiri, for her continued help, support and motivation. I would also like to thank Dr. Sungwook Lee and Dr. Jeremy Lyle, for their guidance in this research study.
A special thank you goes to the administration of the Lamar County School District for allowing me to survey their mathematics teachers.
TABLE OF CONTENTS ABSTRACT………ii DEDICATION………iii ACKNOWLEDGMENTS………..iv LIST OF TABLES……….vii LIST OF ILLUSTRATIONS………....viii CHAPTER I. INTRODUCTION………...…………1 Background Problem Statement Purpose of the Study Research Questions and Hypotheses Significance of the Study II. REVIEW OF RELATED LITERATURE……….11
Available Technologies in the Classroom Technology Use and Its Effect on Student Motivation and Achievement in Mathematics Professional Development Concerning Technology Use in the Classroom Conclusion III. METHODOLOGY………17
Sampling Participants The Survey Instrument Data Collection and Analysis Validity and Reliability Summary IV. ANALYSIS OF DATA……….24
Demographics Question 1 Question 2 Question 3
V. SUMMARY………...………50 Summary of Research Questions
Implications of the Study Limitations of the Study
Recommendations for Future Research
APPENDIXES………...56 REFERENCES………..…60
LIST OF TABLES Table
1. LCSD Student Data – Racial Makeup……….4
2. Gender……….…………...25
3. Level of Math Taught………25
4. Available Technologies……….………27
5. Classroom Technology Use………...29
6. Perform Calculations……….34
7. Correlation and Significance Levels of the Middle and High School Teachers’ Use of Technology to Perform Calculations………..35
8. Explore Relationships………36
9. Correlation and Significance Levels of the Middle and High School Teachers’ Use of Technology to Explore Relationships………37
10. Graph Data……….39
11. Correlation and Significance Levels of the Middle and High School Teachers’ Use of Technology to Graph Data……….40
12. Make Math Models………42
13. Correlation and Significance Levels of the Middle and High School Teachers’ Use of Technology to Make Math Models………43
14. Solve Application Problems………..44
15. Correlation and Significance Levels of the Middle and High School Teachers’ Use of Technology to Solve Application Problems………...45
16. Develop Programs………..47
17. Correlation and Significance Levels of the Middle and High School Teachers’ Use of Technology to Develop Programs………..47
LIST OF ILLUSTRATIONS Figure
1. Mississippi Math Achievement from 2000 to 2007………4 2. The Range of Teaching Experience of Participating Teachers………..26 3. The Range of Frequencies of Technology Use for Drill and Practice…………...31 4. The Range of Frequencies of Technology Use for Tutorial………..32 5. The Range of Frequencies of Technology Use for Performing Calculations……33 6. The Range of Frequencies of Technology Use to Explore Relationships……….36 7. The Range of Frequencies of Technology Use to Graph Data……….38 8. The Range of Frequencies of Technology to Make Math Models………41 9. The Range of Frequencies of Technology Use to Solve Application Problems…44 10. The Range of Frequencies of Technology Use to Develop Programs……….…..46
CHAPTER I INTRODUCTION
Technology integration in the classroom has steadily increased as more
technologies have become available. Incorporating technological resources in instruction leads to higher levels of student engagement (MacBride & Luehmann, 2008), student achievement (Engel & Green, 2011), and student performance (Shirley, Irving, Sanalan, Pape, & Owens, 2011).
For technology in the mathematics classroom to be appropriate, these guidelines must be met as stated by Garofalo, Drier, Harper, Timmerman, and Shockey (2000): “introduce technology in context, address worthwhile mathematics with appropriate pedagogy, take advantage of technology, connect mathematics concepts, and incorporate multiple representations” (p. 67). Additionally, higher levels of student learning are apparent when students are the main users of technology in the classroom (Garofalo et al., 2000).
According to the American Report Card, Mississippi has consistently ranked in the bottom six states since 2005, especially in mathematics (American Legislative
Exchange Council, 2011). It may be the case that appropriately integrating technology in mathematics instruction would help improve the teaching and learning of mathematics and ultimately student achievement in Mississippi. In order to offer appropriate support to secondary mathematics teachers, there is the need to assess the mathematics teachers’ use of the available technology and their technology-related professional development needs.
Background
In recent years, many technologies have surfaced. These include laptops, tablets (iPads, Kindles, eReaders, etc.), SMART boards, electronic voting devices, iPods and cellular devices. These technologies can be used in instruction, instructional planning, and assessment.
MacBride and Luehmann (2011) conducted a study involving a teacher integrating a classroom blog. According to Garofalo and colleagues (2000), this is an appropriate use of technology in the classroom because students were connecting various mathematical concepts as well as taking advantage of the available technologies.
Additionally, students were the sole users of this technology resource. As a result, the students attained a deeper understanding of the mathematics topics.
Even though teachers still want more training using educational technology, many teachers have already been given the opportunity to engage in technology related
professional developments (U.S. Department of Education, 2009). This is based on teachers nationwide completing the National Educational Technology Trends Study (NETTS).
This research study aims to assess the secondary mathematics teachers’ use of the available technologies in Lamar County School District (LCSD) and the teachers’
technology-related professional development needs. In the nation's rankings of educational achievements, Mississippi (MS) has consistently ranked in the bottom six states in mathematics. Therefore, the appropriate use of technology in mathematics teaching and learning might help improve student achievement.
Data from the Mississippi Department of Education Yearly Report Card indicates that in 2011, Mississippi did not meet the adequate yearly progress (AYP) requirement of the No Child Left Behind Act (NCLB) of 2001. This AYP is to ensure that students are achieving the goals set in place for each state. Each year, student grades K-8 take the Mississippi Curriculum Test 2 (MCT2) on which students can score Minimum, Basic, Proficient or Advanced. In 2011, 66% of students in 8th grade scored at least Proficient or Advanced in mathematics.
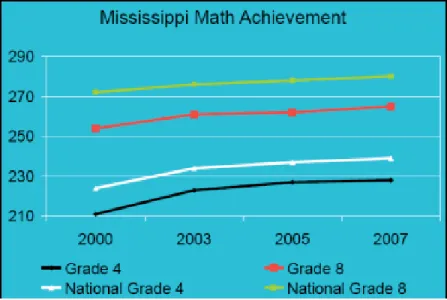
The National Assessment of Educational Progress (NAEP) reported in 2008 that Mississippi has constantly achieved lower in mathematics than the nation on average. The NAEP reports on how states are performing in various subjects. These subjects include the Arts, Civics, Economics, Foreign Language, Geography, Mathematics, Reading, Science, Technology and Engineering Literacy, U.S. History, World History and Writing (U.S. Department of Education, 2008). They mainly focus on 4th grade and 8th grade. Mississippi's math results from the years 2000-2007 are below those of the nation's average (U.S. Department of Education, 2008). On this assessment, only 22% of students in the 8th grade scored proficient or above in mathematics. Mississippi is ranked 49th in the U.S. in mathematics according to the NAEP. Also according to the NAEP Report, Mississippi was the lowest performing state in the U.S. other than California. Approximately 42% scored below basic. Additionally, as the American College Test (ACT) reports, Mississippi’s average mathematics score on the ACT is approximately an 18. This is 3 points lower than the national average of 21 for 2011.
Figure 1. Mississippi Math Achievement from 2000 to 2007. According to the National Assessment of Educational Progress (NAEP), Mississippi ranks below the nation’s average in 4th and 8th grade mathematics. The white line represents the nation’s average in the 4th grade. The black line represents Mississippi’s average of 4th grade students in mathematics. The green line represents the nation’s 8th grade mathematics average, and the orange line represents Mississippi’s average 8th grade mathematics level. Focus on Individual State Results, NAEP, 2013, The Nation’s Report Card. Adapted with permission of author.
The Lamar County School District (LCSD) is located in the southern region of Mississippi. The district has a total of 9,251 students. Of these students, 50% receive free or reduced lunch. The racial makeup of the students is represented in Table 1 (MDE, 2013).
Table 1
LCSD Student Data – Racial Makeup
Race This District Mississippi
Table 1 (continued).
Race This District Mississippi
Black 23.92% 49.84%
Hispanic 2.91% 2.68%
Native American 0.15% 0.25%
White 71.46% 46.26%
LCSD is composed of 16 schools spread across 4 towns. Of these 16 schools, there are 3 high schools (grades 9-12) and 4 middle schools (grades 6-8). LCSD is rated as an “A” school district. All schools within the district are rated as either an “A” or “B” school. These ratings are a result of the 2012-2013 Mississippi Curriculum Test 2 taken by the students (Mississippi Department of Education, 2013). The majority of students scored either proficient or advanced on the mathematics portion of the MCT2 test during the 2011-2012 school year (Mississippi Department of Education, 2012).
Mississippi began implementing Common Core standards during the 2014-2015 school year. According to the Partnership for Assessment of Readiness for College and Careers (PARCC), the Common Core standards offer a more in depth curriculum for students, preparing them for college and future careers (PARCC Online). The MCT2 is not written on the same level of difficulty as the Common Core Tests.
Problem Statement
Mississippi has consistently maintained a low rating in the nation due to poor student achievement on national tests. Therefore, appropriate use of technology in
mathematics teaching and learning may help improve student achievement in Mississippi. In order to help teachers effectively integrate technology in the classroom, there is need for relevant professional development. There is, therefore, the need to assess the teachers’ current use of the available technology and their technology-related professional
development needs.
Purpose of the Study
The purpose of this study was to assess how secondary mathematics teachers within LCSD use their available technologies. The researcher also assessed what type of training teachers needed in using technologies within their classrooms for teaching and learning. This study was completed by distributing an online survey, constructed by previous surveys, to 6th – 12th grade mathematics teachers within LCSD.
Research Questions and Hypotheses
In light of the above, this study sought to answer the following research questions:
Research Question One: What technologies are available for use in mathematics teaching and learning in LCSD?
• Research Hypothesis One: A high frequency of teachers will use a SMART board and laptop for mathematics teaching and learning. Research Question 2: How do secondary mathematics teachers in LCSD use the available technologies for teaching and learning mathematics?
• Research Hypothesis Two: Secondary mathematics teachers use
technology more than middle school mathematics teachers.
Research Question 3: What are the technology-related professional development needs of the secondary mathematics teachers in LCSD?
• Research Hypothesis Three: Secondary mathematics teachers in LCSD will benefit from mathematics focused technology professional development.
Significance of the Study
Many educational mathematics organizations understand the impact of
incorporating technology into mathematics teaching and learning. The National Council of Teachers of Mathematics (NCTM) and the Association of Mathematics Teacher Educators (AMTE) all attest that technology, when used appropriately, can increase student performance in the mathematics classroom (AMTE, 2006; NCTM, 2008). According to the NCTM (NCTM, 2008):
Technology is an essential tool for learning mathematics in the 21st century, and all schools must ensure that all their students have access to technology. Effective teachers maximize the potential of technology to develop students’ understanding, stimulate their interest, and increase their proficiency in mathematics. When technology is used strategically, it can provide access to mathematics for all students. (p. 1)
NCTM understands that technology integration has the ability to increase the performance level of students in the learning of mathematics. Through the uses of technology, mathematics can be learned by every student.
The International Society for Technology in Education (ISTE) constructed technology standards for teachers and students. ISTE (2007) technology standards for students include “creativity and innovation, communication and collaboration, research and information fluency, critical thinking, problem solving, decision making, digital citizenship, and technology operations and concepts” (pp. 1-2). The ISTE (2007)
technology standards for teachers (2007) include “to facilitate and inspire student learning and creativity, design and develop digital age learning experiences and
assessments, model digital age work and learning, promote and model digital citizenship and responsibility, and to engage in professional growth and leadership” (pp. 1-2). ISTE developed these standards in order for students to be able to thrive in a technology-driven society (ISTE, 2015). By implementing these ISTE (2015) standards in their classroom,
teachers are able to teach students how to “analyze, learn and explore” (pp. 1-2). Because these national organizations support the use of technology in the mathematics classroom, it is imperative for teachers to appropriately incorporate technology into their instruction.
The Common Core State Standards Initiative (2015) includes three major shifts: “greater focus on fewer topics, coherence (linking concepts and thinking across grades), and rigor (pursue conceptual understanding, procedural skills and fluency, and
application with equal intensity)” (pp. 1-2). Mississippi is one of 43 states, including the District of Columbia, that has implemented the Common Core State Standards.
Mississippi began full implementation of Common Core during the 2014-2015 school year.
As Common Core is being implemented in classrooms, the Mathematical Practices guide teachers how to teach certain concepts. These practices are for the students as they learn. One of the Mathematical Practices, a component of the Common Core State Standards Initiative (2015) is to “use appropriate tools strategically” (p. 3). The Mathematical Practice 5 in the Common Core State Standards Initiative (Common Core State Standards, 2015, p. 5) states [with emphasis]:
CCSS.MATH.PRACTICE.MP5 Use appropriate tools strategically.
Mathematically proficient students consider the available tools when solving a mathematical problem. These tools might include pencil and paper, concrete models, a ruler, a protractor, a calculator, a spreadsheet, a computer
algebra system, a statistical package, or dynamic geometry software.Proficient
students are sufficiently familiar with tools appropriate for their grade or course to make sound decisions about when each of these tools might be helpful,
recognizing both the insight to be gained and their limitations. For example, mathematically proficient high school students analyze graphs of functions and
solutions generated using a graphing calculator. They detect possible errors by
strategically using estimation and other mathematical knowledge. When making mathematical models, they know that technology can enable them to visualize the results of varying assumptions, explore consequences, and compare predictions with data. Mathematically proficient students at various grade levels are able to identify relevant external mathematical resources, such as digital content located on a website, and use them to pose or solve problems. They are able to use technological tools to explore and deepen their understanding of concepts. (p. 3) From the fifth Mathematical Practice, it can be noted that students should be able to know what tools they can use as they solve various types of problems. Knowledge of available technologies should be made known to students, allowing them to take advantage of the full use of these resources. In order for students to know what technologies they are able to use as they problem solve, the teachers must first have knowledge of the available technologies. This knowledge is widened through technology-related professional developments.
This study will bring to light how LCSD incorporates technology, and if students use technology for higher level tasks, in accordance to the Common Core State
Standards. Additionally, the researcher will be able to identify the type of professional development needs of the secondary mathematics teachers in LCSD.
CHAPTER II
REVIEW OF RELATED LITERATURE
The purpose for this literature review is to provide background knowledge on information regarding technology used in mathematics classes and technology related professional developments. Therefore, for the purposes of this study, this literature review is divided into these sections: Available Technologies in the Classroom,
Technology Use and Its Effect on Student Motivation and Achievement in Mathematics, and Professional Development Concerning Technology Use in the Classroom.
Available Technologies in the Classroom
Throughout the years, technology sources have greatly increased. ELMO Projectors and transparencies have been replaced with Promethean Boards and iPads. New technological resources are constantly being introduced in the classroom. These technologies include, but are not limited to: interactive whiteboards (Promethean, SMART, and Activ Boards), electronic tablets, e-readers, iPods, Geogebra, Maple, Geometer’s Sketch Pad, computer algebra systems, Desmos, electronic voting devices, screencasting tools, pencasts, podcasts, etc. (Ramey, 2012).
Teachers are finding more ways to integrate these technologies into the classroom in order to increase student engagement and achievement (U.S. Department of Education, 2009). According to eLearn Magazine (Burns, 2010), the introduction of technologies in the secondary education classroom has been increasing for the past 25 years.
In addition to having access to various technologies, many school districts employ an instructional specialist (U.S. Department of Education, 2009). This employee is
classroom, helping teachers use these resources in their classrooms and ensuring that the technology works correctly.
Technology Use and Its Effect on Student Motivation and Achievement in Mathematics
We live in a technology-driven society. Technology is everywhere: billboards, grocery stores and in the palms of our hands. Many research studies have shown that when teachers integrate technology appropriately into the learning process, student motivation and student achievement levels are increased (Engel & Green, 2011; MacBride & Luehmann, 2008; Shirley et al., 2011). Technology is used appropriately when it is an active, integral part of the mathematical teaching process.
House and Telese (2011) found that students who consistently use computers for school-related activities reported enjoying the study of mathematics. Students become motivated learners when they are interested in the topic or the introduction of the topic. This is why the use of technology is such a grand tool to increase students’ levels of motivation (House & Telese, 2011).
In classrooms where students can use technology devices to anonymously
answer/ask questions, students gain a deeper understanding of the topic (Engel & Green, 2011). Also, such devices where students attain more information through research than what the teacher gives provides moments for higher order thinking discussions. Because of the effective usage of these devices, students’ levels of performance are increased on given assessments. Engel and Green provide an example of such use of technology, considering Pre-Calculus teachers in West Nyack, New York. These teachers at Clarkstown High School South allowed students to use cell phones in the classroom.
Students answered questions from researched material on their cell phones, looked up background information on current topics of discussion during the class period, and took pictures of their work to be uploaded to an online photo sharing website. The students were excited to use cell phones during class time; they looked forward to finding more information on the topic they were currently learning. Also, when using an online voting system via personal cell phones, the embarrassment from answering a question wrong was alleviated (Engel & Green, 2011). Therefore, students were more apt to check their understanding by answering the questions anonymously. From this, the teachers of Clarkstown were able to effectively gauge student understanding, deepen the level of knowledge their students gained during a single class time, and to see how the students reflected on their own work (Engel & Green, 2011).
A study by MacBride and Luehmann (2011) provides another aspect of
integrating technology in the mathematics classroom. A high school mathematics teacher incorporated an online blog for his Pre-Calculus class. Each day a student was
responsible for uploading a blog post about that day’s class activities. Students were required to respond to each other’s posts. Because the blog was mostly maintained by students, the only posts the teacher wrote were concerning online resources for
remediation and enrichment. For this class, the blog served as a means of reflection – the new age journal (MacBride & Luehmann, 2011). MacBride and Luehmann reported that the students enjoyed seeing how other students responded to their blog posts.
Conversations on posts continued until the students decided to end them. Also, the online blog was made public. The students could see the location of people who were reading their blog. The students began to realize that people from all over could look at their
posts, so they tried to make them as correct and interesting as possible (MacBride & Luehmann, 2011). Because they took the blog’s upkeep to heart, the subject matter became of importance to them. When classroom blogs are put into place, students within the class can inform their peers when they have misunderstood a topic. This peer-to-peer instruction stemming from the online journal allows for students to fully understand the information. Furthermore, when students reflect on what they’ve been taught, they take the time to realize if they have fully understood the information. Therefore, students realized their areas of need before assessment time, allowing for scores to increase (MacBride & Luehmann, 2011).
Shirley and colleagues (2011) conducted a study on the implementation of Connected Classroom Technology (CCT). This technology allows students’ work to be projected on a classroom monitor via their calculators. The researchers followed 7 teachers during the school year. The teachers received the necessary equipment to implement CCT in their classrooms. The researchers conducted interviews with the teachers via telephone periodically throughout the school year. They also scheduled classroom observations. The teachers reported they were able to monitor students’ work, give feedback in a quicker time span, and make sure each student was on task (Shirley et al., 2011). Because of this benefit of the technology, they noticed more student
participation and an increase in student achievement. Teachers could immediately see if a student was misunderstanding a concept because of the use of CCT in the classroom. Remediation and re-teaching happenned immediately to get students back on track in the lesson (Shirley et al., 2011). This allows students to see their mistakes and how to fix
them as soon as they make them. In classrooms where CCT was used, students tended to score higher on given assessments because of its benefits.
According to a report published by the National Council of Teachers of
Mathematics, no negative effects of calculator usage in the mathematics classroom have been found. Calculators offer a deeper understanding of math topics. When students are able to use a calculator, their basic skills in math were increased. Because students are able to use calculators, their views on mathematics were more positive than working without a calculator (National Council of Teachers of Mathematics, 2011).
Geometer’s Sketchpad is online graphing software that allows students to visually see the mathematics being taught. It can be used in geometry, algebra, advanced and lower level math classes. Teachers incorporate this technology to introduce graphing various functions as well as understanding properties of numbers. Teachers are able to understand the level at which their students understand the material by how they are able to explain their work through Geometer’s Sketchpad (NCTM, 2009).
Professional Development Concerning Technology Use in the Classroom
Many teachers in the secondary education classroom understand that effective technology use in the classroom leads to higher levels of student engagement and
achievement. Teachers, however, have to face many obstacles when trying to implement technology into their classroom. These arise from feasibility, cost, usefulness, and technical knowledge. Some teachers have technology that is available in their
classrooms, but have not been trained on how to effectively use this technology. Many teachers have reported that they would use technology more, and on deeper cognitive
levels, if they have this knowledge given to them in some form of professional
development – online tutorials, meetings, or one-on-one assistance (U.S. Department of Education, 2009).
According to the U.S. Department of Education's Evaluation of the Enhancing Education Through Technology Program, 86% of teachers said they took part in some form of a professional development seminar focusing on implementing technology in the classroom. These professional development avenues focused on technologies that aided in grading assessments, helping students in the mathematics learning process, developing curriculum for teachers, and helping to teach various concepts in different ways. Though these professional development opportunities are available to teachers, 52% of teachers said they need more training on integrating technology in their instruction. Teachers are also interested in professional development opportunities to help students learn
mathematics on a higher level.
Conclusion
It has been shown that technology can increase student achievement. Therefore, this study sought to assess the availability and use of technology in mathematics teaching and learning in LCSD. In addition, this study sought to assess the teachers’ professional development needs concerning technology use in the classroom.
CHAPTER III METHODOLOGY
This is a survey research study whose purpose was to assess the use of the available technologies in mathematics teaching and learning and the technology-related professional development needs of mathematics teachers. This study sought to answer the following questions:
1. What technologies are available for use in mathematical teaching and learning in LCSD?
2. How do secondary mathematics teachers in LCSD use the available technologies for teaching and learning mathematics?
3. What are the LCSD secondary mathematics teachers' technology-related professional development needs?
Sampling
The researcher used a convenience sample. Not only is this school district in close proximity to the researcher, but the superintendent was the only one to respond to the researcher’s request to survey their secondary mathematics teachers. Though this sample is not an accurate representation of Mississippi mathematics teachers, this sample was most feasible to recruit by the researcher.
Participants
The participants were grades 6-12 mathematics teachers in the Lamar County School District (LCSD) in Mississippi. There are 62 grades 6-12 teachers in LCSD, with 13 of them teaching 6-8 and 17 of them teaching 9-12. Of the 62 teachers, 8 are male and 54 are female.
The Survey Instrument
The survey had a total of 16 questions (see Appendix C). It was constructed using other surveys. These surveys included the Software and Information Industry
Association (SIIA) K-20 Survey administered by MMA (SIIA, 2014). This survey surveys teachers on how well they are implementing technology in their classrooms. This survey has been conducted for the past 7 years. Another survey used was distributed to teachers in Minnesota (Minnesota State Department of Education, 2011). This survey aimed to assess teachers’ use of technology in the classroom as well as their professional development background concerning using technology in the classroom.
The first three questions of the survey were to obtain demographics of the participants. The researcher wanted to know participants’ genders, years of experience, and mathematics subjects taught. The researcher then asked if the respondents believed technology was a necessary tool in teaching and learning mathematics.
Question 5 asked the participants to list all technologies they had available for use in their classrooms. The surveys administered by the Minnesota State Department of Education and SIIA, compiled a list of technologies and how often they were integrated (Minnesota State Department of Education) and which were restricted (SIIA, 2014). Because new technologies are constantly being introduced, the researcher did not want the participants to be limited in their responses. Therefore, this question was open-ended; teachers could write all technologies they use.
Because the researchers wanted to know how often the teachers use technologies in their classroom, question 6 asked teachers to choose the best response for their
participants could choose “At least once a week”, “At least once a nine weeks”, “At least once a semester”, or “Never”.
Questions 7 through 14 were included to determine how often teachers use technology for various purposes. These purposes included to perform drill and practice, provide tutorial/remediation, perform calculations, explore relationships, graph data, develop math models, solve application problems and develop programs. Teachers could also add any additional ways in which they use technology. These categories were chosen from a constructivist viewpoint in using technology in mathematics education (Slade, 2007). A modified Likert scale of “Never”, “Occasionally”, “Often” and “Always” was used because the researcher wanted to know the range of frequencies of technology used for the specified purposes.
The survey distributed by SIIA asked respondents to respond to the frequency of mobile device use in their classrooms. Respondents could choose a number ranging from 1 to 7, with 1 being never and 7 being very frequently. The researcher modified the question to ask about general technology use and methods in which they used the technologies.
Question 15 asked respondents if they had ever participated in a technology related professional development seminar. In order to assess the needs of professional development concerning technology, there is need to know if they had ever attended such training. Question 16 asked participants to only choose one reason why they would use technology more. These categories were gathered from information presented in a study by the U.S. Department of Education on professional development concerning
Data Collection and Analysis
Surveys are one of the most highly used quantitative research methods of
gathering information (Writing at CSU, 2013). The researcher chose the Lamar County School District to conduct this research study. After sending an interest email to multiple districts, LCSD was the only district to respond with compliance. The superintendent was contacted via email (Appendix D). Upon approval from the district superintendent, the researcher sent the survey to the mathematics curriculum specialist. Because the researcher did not have a list of all secondary mathematics teachers in the district, the mathematics curriculum specialist emailed them. The researcher used an online questionnaire software, Qualtrics.
The participants had approximately four weeks to complete the survey. The survey was emailed to the participants on Monday, December 15, 2014. Winter Break for the school district started the following Monday, December 22. The researcher began to input data into the Statistical Package for the Social Sciences (SPSS) on January 9, 2015. Participants were given 4 weeks because of the extended Winter Break. From this, participants did not have to rush when completing the survey, as opposed to if the
researcher administered the survey personally (Writing at CSU, 2013). Additionally, there was no delay when sending out and receiving surveys. Completing the surveys did not require the wait-time in which a mail survey requires.
Not only are electronic surveys more cost-efficient and timely, but the response rate is increased compared to mail surveys (Writing at CSU, 2013). However, this high response rate is only found to be during the first few days (Zhang, 2000).
Honesty was ensured because of anonymity of the participants. The only
information the researcher knows of the participants is their school district of employment. Once the researcher entered the data into SPSS, analysis of the data began.
Descriptive statistics were calculated, including bar graphs and frequency tables. In order to accept or reject hypothesis 2, Spearman correlation coefficients were found. The researcher calculated a correlation coefficient to see if a relationship existed in how teachers use technology and their level of mathematics taught. The Spearman correlation coefficient was used because it makes no assumptions about a normal distribution for the given data; one variable must be related to another. The alpha level was set to be 0.05. This level was chosen so the confidence interval would be 95%.
Validity and Reliability
A survey is valid if the responses from the survey adequately answer the specified research questions (Kissinger, 2000). An invalid survey is of no use to the researcher; the researcher is unable to complete the task. Face validity, which is not as widely accepted as other forms of validity, is used when a novice in the field determines if the survey is constructed well enough to sufficiently answer the questions at hand (Kissinger, 2000). When the survey is subjected to content validity, experts in the field review the survey. These individuals search for content that should definitely be included while extracting extraneous material (Kissinger, 2000).
The researcher sought middle and high school mathematics teachers to review the constructed survey. From their feedback, the researcher added additional questions as well as removed unnecessary questions. For example, the original survey had the following questions.
1. List the following technologies available for use in your classroom. 2. List the technologies available in your classroom for your use if needed. 3. List the technologies solely for teaching mathematics.
The teachers did not think these questions were necessary. Therefore, they were condensed to the first question alone “List the available technologies for use in your classroom.” Also, the second question was easily misunderstood. Since these individuals gave their input on the survey, they were not participants in the study.
Because there are similar surveys which measure similar research questions, the researcher constructed the survey from previous surveys (SIIA, 2014; Minnesota State Department of Education, 2011), ensuring criterion validity. If the researcher’s survey has concurrent validity, then it produces similar results as a similar test.
Reliability measures if a survey produces the same results when repeated under similar circumstances (Kissinger, 2000). The researcher aims to know if the survey will produce consistent results. Of ways to assess reliability, test-retest reliability is the most common (Kissinger, 2000). In order to assess this, the researcher can gather a select group of participants to complete the survey. Then, the researcher will get the same group of participants to complete the survey again after a short period of time has elapsed. The only problem the researcher foresaw with this practice is that participants will have rehearsed their answers; they will remember how they answered on the
previous survey, so they will mimic their responses. This allows for the survey to have a high level of reliability, but it may not give a true depiction of the survey’s construction.
However, because of time constraints, the researcher did not test reliability by offering a second survey.
Summary
Using a convenience sample, the researcher surveyed 6th – 12th grade mathematics teachers within the Lamar County School District. The online survey, constructed from other surveys, was reviewed by middle and high school teachers before being
administered. The results from this survey were used to answer the following research questions:
1. What technologies are available for use in mathematical teaching and learning in LCSD?
2. How do secondary mathematics teachers in LCSD use the available technologies for teaching and learning mathematics?
3. What are the LCSD secondary mathematics teachers' technology-related professional development needs?
CHAPTER IV ANALYSIS OF DATA
The purpose of this study was to assess what technologies secondary mathematics teachers within LCSD used in their classrooms and the method in which they used them. Additionally, the researcher aimed to discover the technology related professional
development needs of the teachers.
This research study aimed to answer the following questions in accordance with the Lamar County School District (LCSD).
1. What technologies are available for use in mathematics teaching and learning in LCSD?
2. How do secondary mathematics teachers in LCSD use the available technologies for teaching and learning?
3. What are the technology-related professional development needs of the secondary mathematics teachers in LCSD?
Data was collected using an online survey developed through Qualtrics. The survey was 16 questions long, constructed from two established surveys (Appendix C). After obtaining permission from the LCSD superintendent of education, the survey was emailed to the district mathematics curriculum specialist. The survey link was then distributed via email to all 6th-12th grade LCSD mathematics teachers.
Upon receiving the data, the researcher entered all information into the Statistical Package for the Social Sciences (SPSS) software. The following sections present the results from the survey.
Demographics
The LCSD employs sixty-two 6th-12th grade mathematics teachers. A total of 31 of these teachers responded to the survey, representing a response rate of 50%. The 29 female participants accounted for 93.5% of the total participants. Table 2 shows the number of female and male participants. Of the 31 participants, 13 teach high school, 13 teach middle school, and 4 teach both. All four teachers classified as both middle and high school teach 8th grade math and Algebra 1. This information is shown in Table 3. For the purposes of this study, these participants will be listed as high school teachers. Table 2 Gender Teachers Percentage Male 2 6.5 Female 29 93.5 Table 3
Level of Math Taught
Teachers Percentage
Middle School 13 41.9
Of all 62 secondary mathematics teachers in LCSD, there are eight male teachers. Therefore, males constitute approximately 12.9% of the secondary mathematics teachers in LCSD while females represent 87.1% of the population. The gender representation of this study is very similar to the gender percentages of the population from which the sample was chosen.
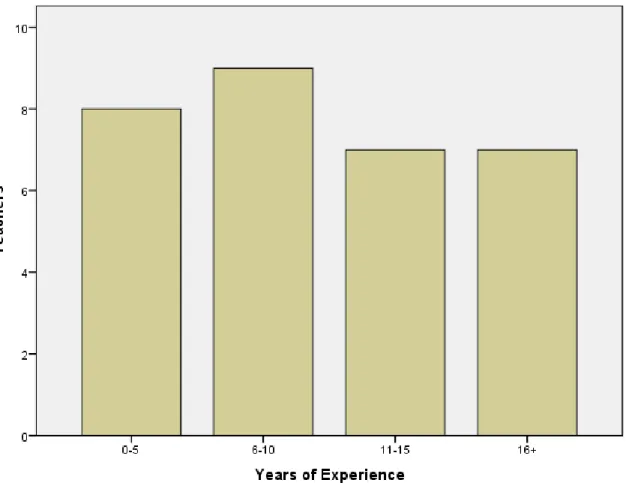
The experience of the participants greatly varied. Figure 2 shows the years of experience of the teachers. The highest frequency of teachers (29%) has 6-10 years of experience.
Question 1
What technologies are available for use in mathematical teaching and learning in LCSD? Teachers were asked to list all technological devices available for use in their classrooms. Twenty five teachers reported as having a smart board and 11 teachers have a laptop, therefore supporting hypothesis 1. Smart boards include Promethean Boards, Activ Boards, and Eno Boards. These boards allow the teacher to provide “academic and digital learning” (Concordia Online Education, 2013, p. 1). Twenty teachers own
calculators. In the LCSD, the only grades that use calculators are 7th – 12th grades. Seventh grade students use a four function calculator, eighth grade students use a scientific calculator, and 9th-12th grade students are able to use a graphing calculator. Table 4 shows the technologies these teachers have available.
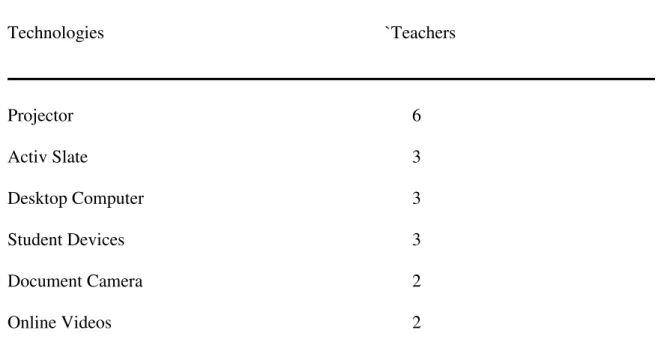
Table 4 Available Technologies Technologies Teachers SMART Board 26 Calculators 20 Laptop 11 Computer 8 Tablet 7
Table 4 (continued). Technologies `Teachers Projector 6 Activ Slate 3 Desktop Computer 3 Student Devices 3 Document Camera 2 Online Videos 2
Because participants were able to freely respond to this question without any constraints, the researcher received a wide variety of technologies available. It is not known whether teachers who reported as having a computer for teaching and learning can be grouped with teachers who have a laptop or desktop computer. Additionally, student devices entail any electronic device the student owns. These include cell phones, laptops, tablets, or iPods. It is also unknown what type of projector the participants house in their classroom. These could include electronic projectors that project a computer screen to a larger screen or overhead projectors which project a paper document to a larger screen.
Question 2
How do secondary mathematics teachers in LCSD use the available technologies for teaching and learning?
Participants were asked how often they use technology in their classrooms for teaching and learning. Of 31 participants, 29 teachers reported using technology at least every other week. One teacher reported as using technology once in nine weeks, and one did not respond. Table 5 shows this information.
Table 5
Classroom Technology Use
Level of Usage Teachers Percentage
At least every other week 29 93.5 At least once a nine weeks 1 3.2 At least once a semester 0 0
Never 0 0
One teacher did not respond to this question. Participants were given the option to respond or not respond to each question. Even though this teacher did not answer this question, consent to participate in this study was given because of the submission of the survey.
The majority of the teachers use some form of technology at least every other week. For different participants, this could be every day or only once during a two week period. It is not known which technologies they use during this time frame. Some teachers could use some technologies more than others. For example, a teacher may use his/her SMART board every day for teaching but only use electronic voting devices
(iClickers/Activ Expressions) once a month. For future research, it is worth assessing which technologies are used at a higher rate.
Twenty-five teachers responded to the question “Is technology necessary in teaching and learning mathematics?” with “yes.” The remaining six teachers said that technology is not necessary in teaching and learning mathematics.
The researchers gave the participants eight categories to describe how they use technology in their classrooms. Teachers described their use of technology in these categories by using a Likert scale. Participants responded to these questions by selecting “Never,” “Occasionally,” “Often,” or “Always.” The researcher did not specifically state the definition of these categories for technology use. This was left to the participants’ discretion as a reflection of their technology use. Also, the researcher did not provide definitions or descriptions of the eight categories to describe how they use technology.
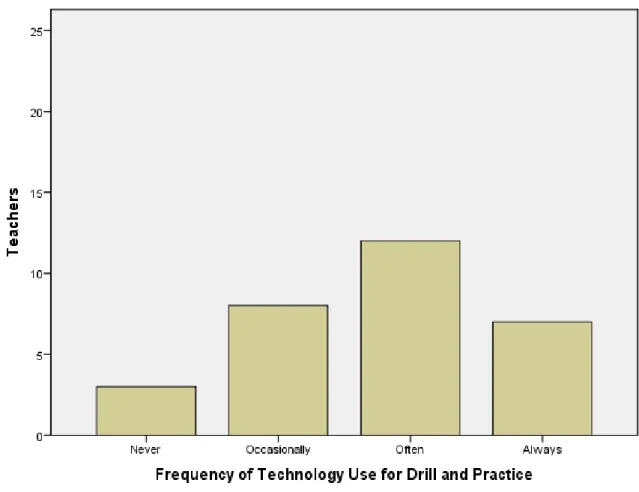
Twelve teachers reported as using technology for drill and practice often. Eight teachers use technology for drill and practice occasionally, while seven use it always.
Figure 3. The Range of Frequencies of Technology Use for Drill and Practice The researcher refers to drill and practice as continuously giving a student mathematical exercises to practice the same concept until he/she is able to perform the exercises with little, to no, mistakes (University of Illinois). Drill and practice allows for the student to understand the basics about a given topic. They are able to quickly go through the steps of a problem. Because teachers want to make sure students fully understand the topic, they may refrain from using technology to aid them in forming an answer.
Eighteen teachers reported to using technology often for tutorial purposes. Only one teacher reported to never using technology for tutorial.
Figure 4. The Range of Frequencies of Technology Use for Tutorial
For the 2014-2015 school year, LCSD was awarded the 21st Century Grant. This grant gives them money to hire certified mathematics and English teachers to tutor students before and after school. Some of these hired teachers are employed by LCSD (Stepney, 2014). It is possible these teachers use technology to tutor these students during and after school. Also, some teachers may offer personal tutorial sessions to their students where technology may be used to help students understand the information. Lamar County Schools also tutors students using MobyMax, a program in which students’ academic levels are measured. This program allows students to practice remedial standards specific to their ability levels.
A total of twenty-five teachers use technology to perform calculations with fourteen using technology often, and eleven use technology always. This constitutes 80.6% of participants, supporting hypothesis 3. Performing calculations refers to the underlying processes of solving any mathematical problem. For example, in order to solve a multistep equation in 8th grade mathematics, a student is able to use a calculator to perform the integer operations necessary to complete the problem. These types of
problems are not meant to assess the basic skills, but whether students understand the major topic being taught.
Table 6
Perform Calculations
Never Occasionally Often Always
6th – 8th Teachers 2 2 4 4 9th – 12th Teachers 0 1 10 6
All of the high school teachers use technology to perform calculations to some degree. Approximately 76.9%, 10 teachers, use technology for this purpose.
Nonetheless, 83.3% of the middle school teachers who responded to the question use technology for this purpose. A Spearman correlation was calculated to determine if there exists a statistical difference in middle and high school teachers’ technology use for performing calculations. The researcher hypothesized that high school teachers would use technology more than middle school teachers, but the correlation coefficient was calculated to be 0.191. This means there is little to no positive correlation between the two sets of data, therefore rejecting hypthoses 2. Additionally, the significance level was p = 0.321. Since this value is higher than the 0.05 alpha level of confidence, the
Table 7
Correlation and Significance Levels of the Middle and High School Teachers’ Use of Technology to Perform Calculations
Level Taught Perform Calc.
Level Taught Spearman Correlation 1 .191
Sig. (2-tailed) .321
N 30 29
Perform Calc. Spearman Correlation .191 1 Sig. (2-tailed) .321
N 29 30
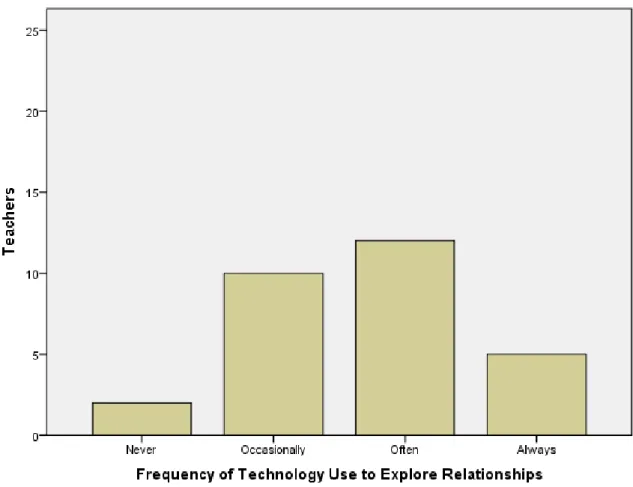
Out of the thirty-one participants, ten teachers often use technology to explore relationships in mathematical data and twelve always use technology in this manner. Teachers are able to use technology to explore relationships in many ways. In a 6th grade math class, students can use virtual manipulatives to discover the rules of performing integer operations. Algebra students may use Desmos, online graphing software, to visualize how the values of a, b, and c determine the shape and position of a quadratic function.
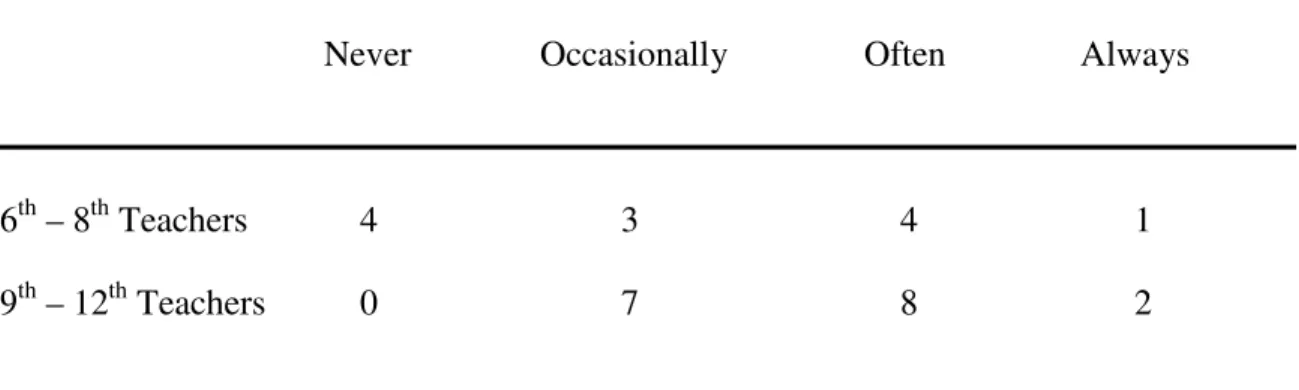
Figure 6. The Range of Frequencies of Technology Use to Explore Relationships The researcher hypothesized high school teachers would use technology to explore relationships more than middle school teachers. Table 8 shows this information. Table 8
Explore Relationships
Never Occasionally Often Always
6th – 8th Teachers 2 4 2 3 9th – 12th Teachers 0 5 10 2
All high school teachers use technology to explore relationships to some degree. Also, however, 83.3% of the middle school teacher respondents also use technology in this manner. A Spearman correlation showed no statistical difference in middle and high school teachers’ technology use for exploring relationships. The correlation coefficient was calculated to be 0.149, proving no real correlation between the data. The
significance level of p = 0.448 rejects hypthoses 2 because there is no real significance in the relationship.
Table 9
Correlation and Significance Levels of the Middle and High School Teachers’ Use of Technology to Explore Relationships
Level Taught Explore Rel.
Level Taught Spearman Correlation 1 .149
Sig. (2-tailed) .448
N 30 28
Explore Rel. Spearman Correlation .149 1 Sig. (2-tailed) .448
N 28 29
Because of the Common Core Standards being implemented in LCSD, teachers are required to teach students on a higher level of instruction. Students are expected to not only know how to work mathematics problems, but also why different methods work.
In order to understand a new topic, a student must understand the previous topic and visualize how the topics are related. For example, Algebra 1 students must have a knowledge of polynomials in order to factor. Once mastery of factoring has taken place, students are able to see how quadratic equations, and their vertexes, are related because of the process of completing the square.
Approximately 84% of the participants use technology to graph mathematical data on some level. Graphing data could include graphing linear equations, inequality
functions, nonlinear functions, data for a scatter plot, or transformations of geometrical shapes.
The reason the researcher hypothesized that high school teachers would use technology more in this area than middle school teachers is because of the content taught in middle school. According to the Common Core State Standards, 6th grade students learn how to solve and graph inequalities on a number line without the use of a
calculator; it is expected that students do this by hand. Thefore, technology it is assumed that technology is not introduced in the classroom at that time. Graphing data is not listed in the 7th grade Common Core State Standards. Eighth grade students, however, are required to graph linear and nonlinear functions, as well as bivariate data. This is done with and without the use of a calucalator, but 8th grade students are not allowed to have a graphing calculator. It is assumed, therefore, that technology will not be
introduced to 8th grade students because the standards require them to be able to graph data by hand without the use of a graphing device. Table 7 shows the distribution of middle and high school teachers and how often they use technology to graph data. Table 10
Graph Data
Never Occasionally Often Always
6th – 8th Teachers 4 3 4 1 9th – 12th Teachers 0 7 8 2
Though this information seemingly supports hypothesis 2, the number of middle school teachers who use technology to graph data is unexpected. Teachers could,
however, allow students to use technology to graph data after mastery has occurred. Then, students can use the technology generated graphs to extract data and analyze information. The Spearman correlation coefficient for this data was 0.280, showing no significant relationship between the frequencies of secondary math teachers of middle and high school who use technology to graph data. Because the significance level was p = 0.141, higher than the alpha confidence level of 0.05, hypothesis 2 is rejected for technology use to graph data.
Table 11
Correlation and Significance Levels of the Middle and High School Teachers’ Use of Technology to Graph Data
Level Taught Graph Data
Level Taught Spearman Correlation 1 .280
Sig. (2-tailed) .141
N 30 29
Graph Data Spearman Correlation .280 1 Sig. (2-tailed) .141
N 29 30
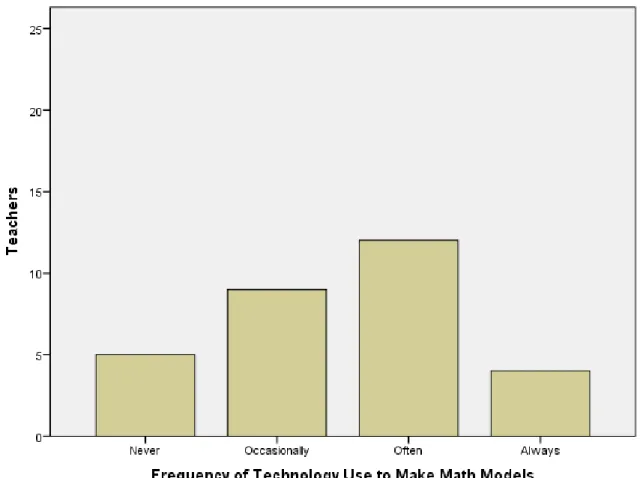
Twenty-five respondents, 80.6% of the sample, use technology to make mathematical models during the teaching and learning of mathematics. In the middle school, math models can be used to help students understand how to complete operations
with fractions, calculate markups and discounts on a virtual shopping adventure, or visualize parallel lines and transversals to understand patterns within such figures. Figure 8 shows how often the participants use technology to make math models. Table 12 gives the breakdown of how often middle and high school teachers use technology to make math models.
Table 12
Make Math Models
Never Occasionally Often Always 6th – 8th Teachers 3 2 4 3 9th – 12th Teachers 2 7 7 1
Even though 69.2% of the surveyed middle school teachers use technology to some degree to make models, the percentage of high school teachers who use technology in this manner is higher by 19%. A possible explanation for this lies in a high school geometry class. Though the respondents did not specify, many geometry teachers use Geometer’s Sketchpad or Geogebra to visualize certain concepts. These tools can also be used to model topics students are learning in class. The calculated Spearman correlation of -0.101 supports no relationship between this set of data. The significance level, p = 0.602, rejects hypothesis 2 stating that high school teachers use technology more than middle school teachers for making math models.
Table 13
Correlation and Significance Levels of the Middle and High School Teachers’ Use of Technology to Make Math Models
Level Taught Math Models
Level Taught Spearman Correlation 1 -.101
Sig. (2-tailed) .602
N 30 29
Math Models Spearman Correlation -.101 1 Sig. (2-tailed) .602
N 29 30
Approximately 93% of respondents use technology to solve application problems with 70.9% often or always using technology for these types of problems.
Figure 9. The Range of Frequencies of Technology Use to Solve Application Problems Table 14
Solve Application Problems
Never Occasionally Often Always
6th – 8th Teachers 0 4 5 3 9th – 12th Teachers 0 3 11 2
mathematical concept. Then, the teacher is focused on the rigor for which the Common Core State Standards call. The calculated Spearman correlation value of 0.025 supports that this set of data has no relationship. Because the significance level of 0.899 is greater than 0.05, hypothesis 2 is rejected which states that high school teachers use technology to solve application problems more than middle school teachers.
Table 15
Correlation and Significance Levels of the Middle and High School Teachers’ Use of Technology to Solve Application Problems
Level Taught Application Problems
Level Taught Spearman Correlation 1 .025
Sig. (2-tailed) .899
N 30 28
App Problems Spearman Correlation .025 1 Sig. (2-tailed) .899
N 28 29
Seventeen teachers reported as never using technology to develop mathematical programs. A total of nine teachers use technology in this manner occasionally (7) or often (2). No teachers responded to always using technology to develop programs.
Figure 10. The Range of Frequencies of Technology Use to Develop Programs
Developing mathematics programs gives students the opportunity to think on a high mathematical level. If students are able to develop a math program, they understand every step in the process, multiple methods of solving the same problem, as well as all categories of that type of problem. Developing math programs are seen in math computing, or even robotics, courses. The teachers who were given the survey teach neither of these classes. The percentage of high school teachers who use technology for developing programs is only 41.2% with no percentage categorized as “always.” Additionally, the Spearman correlation of 0.294 supports that there is no relationship between level of mathematics taught and level of technology use for developing program.
Table 16
Develop Programs
Never Occasionally Often Always
6th – 8th Teachers 8 2 0 0 9th – 12th Teachers 8 5 2 0
Table 17
Correlation and Significance Levels of the Middle and High School Teachers’ Use of Technology to Develop Programs
Level Taught Develop Programs
Level Taught Spearman Correlation 1 .294
Sig. (2-tailed) .153
N 30 29
Develop Programs Spearman Correlation .294 1 Sig. (2-tailed) .153
N 29 30
From these results, the most common ways in which teachers use technology are for drill and practice, tutorial, performing calculations, making math models, and solving
application problems. Mathematics teachers in the LCSD do not use technology to develop math programs via technological resources as often as other methods.
Question 3
What are the technology-related professional development needs of the secondary mathematics teachers in LCSD?
The researcher asked if participants attended a technology-related professional development seminar. Twenty-one of the thirty-one respondents have attended some form of professional development regarding the use of technology in the classroom. Table 18
Professional Development Participation
Teachers Percentage
Yes 21 67.7
No 6 19.4
Because the researcher did not specify the type of professional development, this can include those provided in large groups with the entire school, small group settings within the mathematics department, one-on-one meetings, off-campus sites, or webinars. These could have been beneficial or useless to the participants. For future research, it would be helpful to ask the participants if they received valuable information from these trainings that they were able to implement in their classrooms.
Teachers’ answers varied when asked what would help them to use technology more in their classrooms. The results are shown in Table 18.
Table 19
I Would Use Technology More If…
Frequency Percentage
I had more technology training. 4 12.9
I had time to learn. 11 35.5
Technology was more accessible. 8 25.8
I had a grouping of ideas. 2 3.2
Wi-Fi was more available. 1 3.2
Attending beneficial professional development training could help approximately 54.8% of the respondents to this question. Those who need more training in using technologies in their classroom could benefit the most from attending professional training regarding using technology in mathematics classrooms. Teachers who need more time to learn how to use the technology would find a one-on-one meeting with the district’s instructional technologist most helpful. Lastly, those who need a source that lists technologies available for learning mathematics might benefit from attending some form of an online webinar that explores various online tools.
CHAPTER V SUMMARY
This research study aimed to answer the following questions by surveying the 6th-12th grade mathematics teachers within the Lamar County School District (LCSD).
1. What technologies are available for use in mathematical teaching and learning in LCSD?
2. How do secondary mathematics teachers in LCSD use the available technologies for teaching and learning?
3. What are the technology-related professional development needs of the secondary mathematics teachers in LCSD?
Summary of Research Questions
Question 1: What technologies are available for use in mathematical teaching and learning in LCSD?
The majority of 6th-12th grade mathematics teachers have a SMART board and laptop available for their use. Having additional technologies for teaching and learning is left to the teachers’ discretions. There are many advantages to using a SMART board during the teaching of mathematics. Aside from aiding teachers in their classroom management techniques by allowing them to move around the classroom, it allows teachers to teach lessons they may not have been able to otherwise (Concordia Online Education, 2013). For example, geometry teachers are able to explain real-life fractals and look at them on a deeper level. Also, teachers are able to use many types of electronic manipulatives, especially those offered by Illuminations, an online resource powered by the National Council of Teachers of Mathematics.
Twenty-five participating teachers believe that technology is necessary in learning mathematics while 6 teachers believe that it is not. Of these six teachers, three have more than 16 years of experience. One has 11-15 years of experience, and two have 6-10 years of teaching experience. A Spearman correlation was then calculated to determine if there was a relationship between years of experience and necessity of technology. For this set of data, the correlation coefficient was 0.030 with a significance level of 0.070.
Therefore, for this set of data, there is no real correlation between years of experience and teachers’ belief of necessity of technology in the classroom. According to a study
conducted by the National Center for Education Statistics (2000), teachers who only have a few years of experiences are more likely to use technology in their classrooms. This may be because they are introduced to ways to use technology in their educational programs while yet in school. It cannot be deduced, however, that the teachers who believe technology is not necessary in teaching and learning mathematics are less likely to use technology for this purpose.
Question 2: How do teachers use the available technologies for teaching and learning mathematics?
The Common Core State Standards require a certain level of mathematical rigor. Tutorial settings allow students who are currently behind to learn the basic skills. The use of technology for drill and practice, along with performing calculations, does not require much rigor or higher level thinking skills from students. Making math models and solving
application problems require students to use a deeper depth of knowledge. When students are able to develop mathematical programs, this allows them to think on the highest depth of knowledge level, causing them to create and design tactics to solve mathematical problems.
Teachers within the study use technology for lower and higher levels of mathematical thinking. An appropriate use of technology is to use it to build a deeper understanding of the mathematics topics. This only happens when technology is used in a manner that allows students to practice higher level thinking skills.
According to an article by Dr. Gilbert Valdez of North Central Regional Technology in Education Consortium (Valdez, 2005), the uses of technology in the classroom are greatly dependent upon the teachers’ levels of technology use. The more comfortable they are, the more they use technology to stimulate a deeper level of understanding.
Question 3: What are the teachers' technology-related professional development needs? Even though the majority of teachers have been involved in some type of
technology-related professional development seminar, 35.5% of the participants still need time to learn how to use technology in their classrooms. Initially, this can happen in one-on-one professional development environments with the district’s educational
technologist. Also, teachers may feel they do not have adequate time during, before, or after school to stay abreast of the new technologies and to discover how to effectively use them in their classrooms. From the respondents, 25.8% would use technology more if it were more accessible. Obtaining technology in the classroom is still a struggle for some school districts because of the high cost. Nonetheless, if a teacher allows students to use their own devices, accessibility increases. Students are then able to bring personal cell phones, iPods, and tablets to school for educational purposes. Only 12.9% reported to needing more technology training. Nonetheless, 3.2% need a grouping of ideas in order to use technology more. Both of these groupings could benefit from technology training