i | P a g e
A Machine Learning and Computer Assisted Methodology
for Diagnosing Chronic Lower Back Pain on Lumbar
Spine Magnetic Resonance Images
By
Ala Sami Al-Kafri
A thesis submitted in partial fulfillment of the requirements of Liverpool John Moores University for the degree of Doctor of Philosophy
ii | P a g e
Acknowledgments
First and foremost, all praise is due to our God (s.w.t) for giving me the strength and ability to complete this journey throughout my PhD.
I would like to express my sincere gratitude to my supervisor, Dr.Sud Sudirman for the support and advice he offered to me during my PhD which gave me the ability to successfully face any challenges. Dr.Sud gave me all I needed to achieve work of such a high standard. Special thanks to Prof.Abir Hussain and Prof Dhiya Al Jumeily for their continuous advice and support since day one of my PhD journey. I would like to express my thankfulness to my external supervisor Dr. Mohammed Al Jumeily for his inspired guidance and providing me with all the medical advice required for my research.
I would like to express my appreciations to Dr.Wasfi Al Rashdan and Dr.Mohammed Bashtawi (Irbid Speciality Hospital), Dr.Paul Fergus and everyone who supported me in completing this thesis. Thanks to all the staff members in the Computer Science Department at LJMU for the admin and technical advice and support. Thanks to Tricia Waterson, Elizabeth Hoare, Carol Oliver and from the IT department special thanks to Neil Rowe, Paul Cartwright, Warren Anacoura and Ian Fitzpatrick.
Finally, my heartfelt thanks to my parents, brothers, and sisters for their unlimited support and encouragement. I would love to thank my wife, my daughters (Maya and Yara) and my son (Karim) for their patience, tolerance, and support during this long journey in my PhD.
iii | P a g e
Abstract
Chronic Lower Back Pain (CLBP) is one of the major types of pain that affects many people around the world. It is estimated that 28.1% of US adults suffer from this illness and 2.5 million of the UK population experience this type of pain every day. Most CLBP cases do not happen overnight and it is usually developed from a less serious but acute variant of lower back pain. An acute type of lower back pain can develop into a chronic one if the underlying cause is serious and left untreated. The longer a person is disabled by back pain, the less chance he or she returns to work and the more health care cost he or she will require. It is therefore important to identify the cause of back pains as early as possible in order to improve the chance of patient rehabilitation. The speediness of early diagnosis can depend on many factors including referral time from a general practitioner to the hospital, waiting time for a specialist appointment, time for a Magnetic Resonance Imaging (MRI) scan and time for the analysis result to come out. Currently diagnosing the lower back pain is done by visual observation and analysis of the lumbar spine MRI images by radiologists and clinicians and this process could take up much of their time and effort. This, therefore, rationalizes the need for a new method to increase the efficiency and effectiveness of the imaging diagnostic process.
This thesis details a novel methodology to automatically aid clinicians in performing diagnosis of CLBP on lumbar spine MRI images. The methodology is based on the current accepted medical practice of manual inspection of the MRI scans of the patient’s lumbar spine as advised by several practitioners in this field. The main methodology is divided into three sub-methods the first sub-method is disc herniation detection using disc segmentation and centroid distance function. While the second sub-method is lumbar spinal stenosis detection via segmentation of area between anterior and posterior (AAP) Elements. Whereas, the last sub-method is the use of deep learning to perform semantic segmentation to identify regions in the MRI images that
iv | P a g e are relevant to the diagnosis process. The method then performs boundary delineation between these regions, identifies key points along the boundaries and measures distances between these points that can be used as an indication to the health of the lumbar spine.
Due to a limitation in the size and suitability of the currently existing open-access lumbar spine dataset necessary to train and test any good classification algorithms, a dataset consisting of 48,345 MRI slices from a complete clinical lumbar MRI study of 515 symptomatic back pain patients from several specialty hospitals around the world has been created. Each MRI study is annotated by expert radiologists with notes regarding the observed characteristics, condition of the lumbar spine, or presence of diseases. The ground-truth dataset containing manually labelled segmented images has also been developed. To complement this ground-truth dataset, a novel method of constructing and evaluating the suitability of ground truth data for lumbar spine MRI image segmentation has been developed.
A subset of the dataset, which includes the data for 101 patients, is used in a set of experiments that have been conducted using a variety of algorithms to conclude with using SegNet as the image segmentation algorithm. The network consists of VGG16 layers pre-trained using a subset of non-medical images from the ImageNet database and fine-tuned using the training portion of the ground-truth dataset. The results of these experiments show the accurate delineation of important boundaries of regions in lumbar spine MRI. The experiments also show very close agreement between the expert radiologists’ notes on the condition of a lumbar spine and the conclusion of the system about the lumbar spine in the majority of cases.
v | P a g e
Table of Contents
Acknowledgments ... ii
Abstract ... iii
Table of Contents ... v
List of Figures ... viii
List of Tables ... x
Thesis Acronyms ... xi
List of Publications ... xiii
Chapter 1 . Introduction... 1
1.1 Research Problems... 3
1.2 Research Aims and Objectives ... 4
1.2.1 Research Aims ... 4
1.2.2 Research Objectives ... 4
1.3 Research Contributions ... 5
1.4 Research Goal ... 6
1.5 Thesis Structure ... 7
Chapter 2 Background Information ... 9
2.1 Lower Back Pain ... 9
2.2 Lumbar Spine Anatomy ... 11
2.3 Causes of lower back pain ... 14
2.3.1 Spinal Canal Stenosis ... 15
2.3.2 Disc Herniation ... 16
2.4 MRI Imaging ... 17
2.5 Diagnosis of the Lower Back Pain ... 18
2.5.1 The current method of diagnosing the spinal canal stenosis and disc herniation. ... 18
2.6 Chapter Summary ... 21
Chapter 3 Literature Review ... 22
3.1 Medical Image Analysis ... 22
3.2 Medical Images in the Computer-Aided Diagnosing System ... 24
3.3 Computer-Aided Diagnosing System for Lumbar Spine Stenosis ... 26
3.4 Machine Learning ... 28
3.4.1 Artificial neural networks ... 30
3.4.2 Convolutional Neural Network ... 32
3.4.3 Support Vector Machine ... 32
3.4.4 Decision Tree ... 36
vi | P a g e
3.4.6 K-Nearest Neighbour ... 38
3.5 Chapter Summary ... 39
Chapter 4 The Dataset Developed for this Research ... 41
4.1 The Available Open-Access Dataset ... 41
4.2 Lumbar Spine MRI (LSMRI) Dataset ... 44
4.3 Dataset Used in the First Two Experiments ... 49
4.4 Summary ... 52
Chapter 5 Disc Herniation Detection using Disc Segmentation and Centroid Distance Function ... 53
5.1 Basic Edge Detection Algorithms to detect disc boundaries ... 56
5.2 Image Labels and Ground Truth... 57
5.3 Classifier Model Selection ... 60
5.3.1 Classifier Training Result ... 63
5.3.2 Automatic Segmentation Result ... 64
5.4 Detecting the Disc Herniation in Segmented Lumbar Spine MR Image using Centroid Distance Function ... 66
5.5 Chapter Summary ... 71
Chapter 6 Lumbar Spinal Stenosis Detection via Segmentation of Area between Anterior and Posterior (AAP) Elements ... 72
6.1 MRI Image Cropping ... 73
6.2 Deep Neural Network Architecture ... 75
6.3 Training ... 77
6.4 Discussion and Analysis ... 82
6.5 Two Regions Boundary Delineation through Semantic Segmentation ... 84
6.6 Locating the main points in the delineated boundaries ... 89
6.7 Chapter Summary ... 98
Chapter 7 Semantic Segmentation using Convolutional Neural Networks ... 99
7.1 SegNet Training Setup ... 101
7.1.1 Image Labels and Ground Truth ... 102
7.1.2 Ground Truth Quality Metrics ... 105
7.1.3 Compositing T1- and T2-weighted MRI images ... 107
7.2 Development of Ground Truth Data for Automatic Lumbar Spine MRI Image Segmentation 109 7.2.1 Analysis of image labelling results ... 109
7.2.2 Individual Region Analysis ... 110
7.2.3 Confidence and consistency metrics ... 112
vii | P a g e
7.3.1 Segmentation Results and Analysis ... 114
7.4 Chapter Summary ... 118
Chapter 8 Conclusion and Future Work ... 120
8.1 Conclusion ... 120
8.2 Research Contributions ... 122
8.3 Summary and Future Research ... 125
viii | P a g e
List of Figures
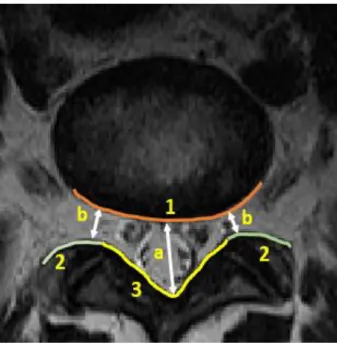
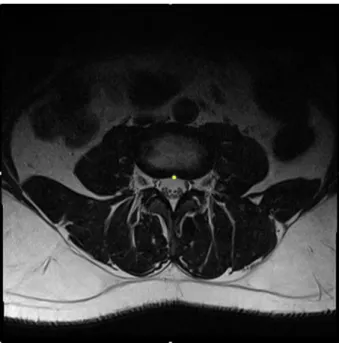
Figure 2.1: Anatomy of the Spine [25] _________________________________________________________ 11 Figure 2.2: Lumbar Spine that contains the vertebrae from L1 to L5 [26]. _____________________________ 12 Figure 2.3: A T2-weighted mid-sagittal view of lumbar spine MRI.___________________________________ 13 Figure 2.4: Axial View of the Lumbar Spine. ____________________________________________________ 14 Figure 2.5: The three important boundaries for stenosis detection between AAP and 1) IVD, 2) Facet Joints, and 3) LF to measure a) the anteroposterior diameter of the spinal canal and b) the left and right width of the foramen __________________________________________________________________________________ 16 Figure 2.6: Axial view of (A) non-herniated and (B) herniated Disc [35]. _____________________________ 17 Figure 2.7: The selected slice for the disc L3-L4. _________________________________________________ 19 Figure 2.8: Illustrate a point at the bottom centre of the disc L3-L4. __________________________________ 19 Figure 2.9: Shows the lowest point on the spinal canal for the disc L3-L4. _____________________________ 20 Figure 2.10: Illustrate the line between the lowest point on the spinal canal and the point at the bottom centre for the disc L3-L4. __________________________________________________________________________ 20 Figure 3.1: illustrations of biological neuron parts. _______________________________________________ 30 Figure 3.2: Network of artificial neuron or perceptron. ____________________________________________ 31
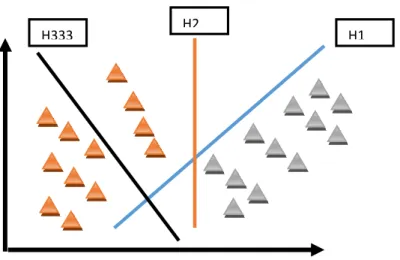
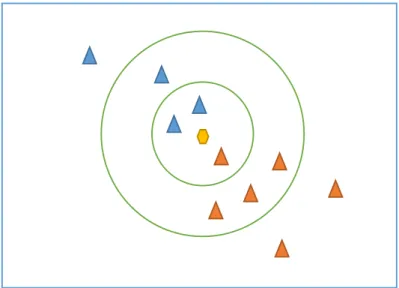
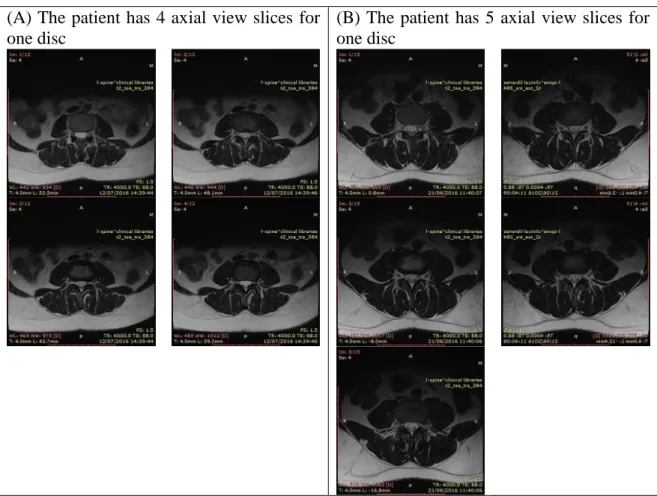
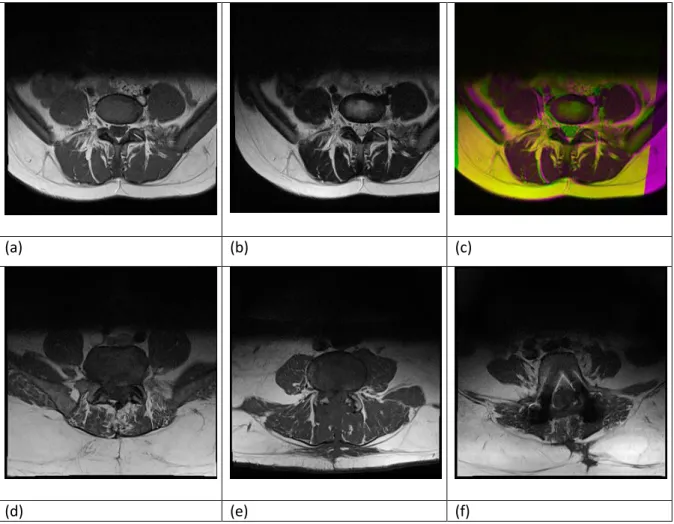
Figure 3.3: Convolutional deep neural network layers _____________________________________________ 32 Figure 3.4: Diabetic and non-diabetic data separated linearly by hyper-plane. _________________________ 33 Figure 3.5: SVMC linearly separable set of two classes. ___________________________________________ 34 Figure 3.6: Two and three-dimensional illustration of data. ________________________________________ 35 Figure 3.7: K-nearest neighbour algorithm (KNN) example. ________________________________________ 39 Figure 4.1: Illustrates an example for two different patients MRI (A) Four slices of images for the level 3 disc. (B) Five slices of images for the level 3 disc. _____________________________________________________ 47 Figure 4.2 Some examples of the discarded MRI scans. Image (a) is T1-weighted and (b) T2-weighted MRI scans of the same part of the lumbar spine of a patient. There is a significant difference in the position of the same organ in both images resulting in a large number of mismatch pixels (purple regions) in the resulting (c) composite image. Image (d) and (e) are example cases where multiple regions are fused together making manual segmentation unreliable. And (f) is an example of a scan that contains unexplained imaging distortion or artefact. ________________________________________________________________________________ 49
Figure 4.3: Example of the radiologist report for one of the patients __________________________________ 51
Figure 5.1: Machine Learning Framework. ______________________________________________________ 54
Figure 5.2: Shows the methodology followed to label the lumbar spine disc using axial view MRI based on pixels coordinate and grey level features. ____________________________________________________________ 55
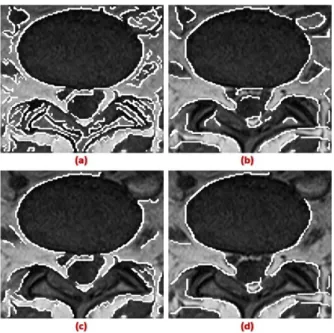
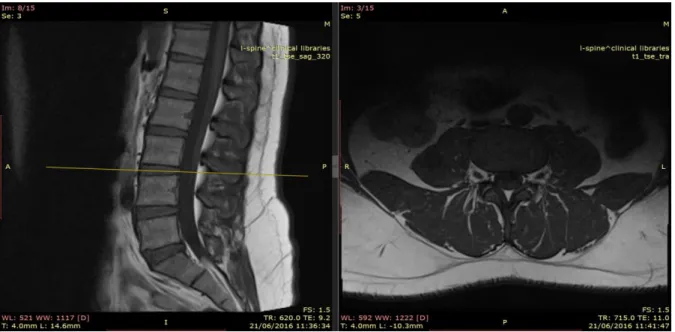
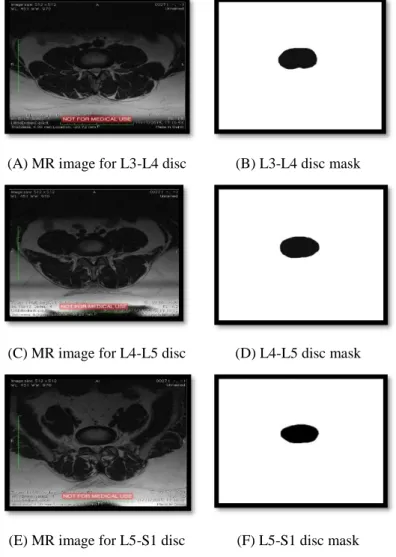
Figure 5.3: The results of Canny edge detection using a combination of two threshold values and two sigma value where a) low threshold – low Gaussian width, b) low threshold – high Gaussian width, c) high threshold – low Gaussian width and d) high threshold and high Gaussian width. _________________________________ 56 Figure 5.4: Dual-view of MRI images showing the mid-sagittal view (left) and the corresponding axial-view slice (right) at the cut line ____________________________________________________________________ 58 Figure 5.5: The selected MRI Images of the Three Lumbar Spine Discs. ______________________________ 58 Figure 5.6: Discs MRI and the developed Mask for each disc. _______________________________________ 59 Figure 5.7: The classifiers for the two experiments and the accuracy for each of them. ___________________ 64 Figure 5.8: The Original and Segmented Images by Weighted KNN. _________________________________ 65 Figure 5.9: The Original and Segmented Images by SVM Fine Gaussian. _____________________________ 66 Figure 5.10: Axial view of (A) non-herniated and (B) herniated discs. ________________________________ 67 Figure 5.11: Illustration of the radial distances calculated from (A) non-herniated and (B) herniated disc. __ 67 Figure 5.12: The distance between the centroid and the disc boundary (d) in the angle (θ). _______________ 68 Figure 5.13: Plot of the Centroid Distance Function of a non-herniated disc. __________________________ 69 Figure 5.14: Plot of the Centroid Distance Function of a herniated disc. The red region marked the area of the disc where the herniation occurs. ______________________________________________________________ 69 Figure 5.15: Plot of the Centroid Distance Function of a non-herniated disc. __________________________ 70 Figure 5.16: Plot of the Centroid Distance Function of a herniated disc. ______________________________ 70
ix | P a g e
Figure 6.1: Methodology used for segmenting the AAP area in the lumbar spine MRI images. _____________ 73
Figure 6.2: An example of MRI and ground-truth image pair used for training. _________________________ 74
Figure 6.3: The process flow of image segmentation using patch-based pixel classification method. ________ 74
Figure 6.4: The three important boundaries for stenosis detection between AAP and 1) IVD, 2) Facet Joints, and 3) LF to measure a) the anteroposterior diameter of the spinal canal and b) the left and right width of the foramen __________________________________________________________________________________ 82
Figure 6.5: The result of superimposing the edges of the segmentation result on to the ground truth (right), and their corresponding original MRI images (left). The top images are taken from D3, middle from D4, and bottom from D5. __________________________________________________________________________________ 83
Figure 6.6: Visual evidence of overfitting of SegNet in this experiment. The figure shows prediction on (left) a training image and (right) on a test image. The bright pixels outline the edges of the segmented image. ____ 84
Figure 6.7: The process flow of SegNet's encoder-decoder architecture. _______________________________ 86
Figure 6.8 Example of the reconstructed images using SegNet using full-size MRI images _________________ 88 Figure 6.9: The four labelled Regions of Interest namely 1) Intervertebral Disc (IVD), 2) Posterior Element (PE), 3) Thecal Sac (TS) and 4) the Area between Anterior and Posterior (AAP) vertebrae elements. Delineation of boundaries between these regions is used to measure A) the anteroposterior diameter of the spinal canal width. ____________________________________________________________________________________ 89 Figure 6.10: Axial View of the Lumbar Spine. ___________________________________________________ 90 Figure 6.11: Sample of the reconstructed image for the AAP for L3-L4, L4-L5, and L5-S1 ________________ 90
Figure 6.12: Important points locations _________________________________________________________ 92
Figure 6.13: The distribution of the differences between the manually computed spinal canal width and the width measured using Fine Gaussian SVM _______________________________________________________ 95
Figure 6.14: The distribution of the differences between the manually computed spinal canal width and the width measured using the SegNet _____________________________________________________________ 96 Figure 6.15: (A) – (F), Illustrate the System Diagnosed Result in % for L3-L4, L4-L5 and L5-S1 Using SegNet and Fine Gaussian SVM. ____________________________________________________________________ 98 Figure 7.1Shows the methodology followed in the segmentation using the convolutional neural network __ 100
Figure 7.2 The four labelled RoIs namely 1) Intervertebral Disc, 2) Posterior Element, 3) Thecal Sac and 4) the AAP. ____________________________________________________________________________________ 103
Figure 7.3 Dual-view of MRI images showing the mid-sagittal view (left) and the corresponding axial-view slice (right) at the cut line. ______________________________________________________________________ 104 Figure 7.4: Visualizing vote counts that each pixel in and around each RoI receives as a heat map, where the brighter pixels have more votes than darker pixels. The RoIs are a) IVD, b) PE, c) TS and d) the AAP _____ 110 Figure 7.5: The plot of a) Pixel Accuracy and b) Mean Accuracy of the SegNet semantic segmentation results at different training data percentages. ___________________________________________________________ 115 Figure 7.6: The plot of a) Frequency-Weighted IoU and b) Mean IoU of the SegNet semantic segmentation results at different training data percentages. ___________________________________________________ 116 Figure 7.7: The plot of the class accuracy of the semantic segmentation results using a) SegNet-FS and b) SegNet-TL at different training data percentages. ________________________________________________ 117 Figure 7.8: The plot of class IoU of the semantic segmentation results using a) SegNet-FS and b) SegNet-TL at different training data percentages. ___________________________________________________________ 117
x | P a g e
List of Tables
Table 4.1: Shows all the available dataset in the SpineWeb web page with its details. ____________________ 44 Table 4.2: MRI Scanning Parameters. __________________________________________________________ 45
Table 4.3: Data Categorization for 101 Patients. _________________________________________________ 50 Table 4.4: Sample of the provided data _________________________________________________________ 51 Table 5.1: Shows sample of the exported data including the pixel position, Intensity, and Disc which
represented by (1) or Non-Disc which represented by (0). __________________________________________ 60
Table 5.2 The Models trained in the two experiments _____________________________________________ 61 Table 5.3: The first experiment result based on the evaluation of 6 models. The Models trained using one patient data. _____________________________________________________________________________________ 62 Table 5.4: The second experiment result based on the evaluation of 6 models. The Models trained using seven patients’ data. _____________________________________________________________________________ 62
Table 6.1: The Architecture of PALMSNet _______________________________________________________ 76
Table 6.2 Performance using All Intervertebral Discs ______________________________________________ 79
Table 6.3 Performance when trained and tested using D3 only ______________________________________ 80
Table 6.4 Performance when trained and tested using D4 only ______________________________________ 80
Table 6.5 Performance when trained and tested using D5 only ______________________________________ 81
Table 6.6 PALMSNet Performance when tested on D5 _____________________________________________ 82
Table 6.7: The classifier's performance using all intervertebral discs. _________________________________ 91 Table 6.8: Sample of the calculated distances using the Fine Gaussian SVM to reconstruct the images are compared with the manually calculated distances for the three lumbar spine disc L3-L4, L4-L5, and L5-S1 respectively _______________________________________________________________________________ 93 Table 6.9: sample of the calculated distances using SegNet to reconstruct the images are compared with the manually calculated distances for the three lumbar spine disc L3-L4, L4-L5, and L5-S1 respectively ________ 94
Table 7.1 Intersection-over-union values of different vote-threshold groups. __________________________ 109 Table 7.2: Confidence and consistency values of the resulting ground truth data. ______________________ 113 Table 7.3: The performance of the best semantic segmentation network (SegNet-TL trained using 80% PTD) 118
xi | P a g e
Thesis Acronyms
AAP Area between Anterior and Posterior
ap Pixel Accuracy
am Mean Accuracy
CAD Computer-Aided Diagnosis
CDF Centroid Distance Function
CLBP Chronic Lower Back Pain
CNN Convolutional neural network
CSI Challenges on Spine Imaging
CT Computed Tomography
DNN Deep Neural Network
GBDTs Gradient-Boosted Decision Trees
GBM Gradient Boosting
iouc The Intersection-Over-Union
IVD Intervertebral Discs
IVUS Intravascular Ultrasound
KDD Knowledge discovery in databases
KNN K-Nearest Neighbour Algorithm
LSMRI Lumbar Spine MRI
xii | P a g e
MA Media Adventitia
MFAAS Multi-Feature and Adaptive Spectral Segmentation
MICCAI Medical Image Computing and Computer-Assisted Intervention
ML Machine learning
MLP Multilayer Perceptron
MRI Magnetic Resonance Image
MRM Magnetic Resonance Myelography
PALMSNet Patch-based Axial-view Lumbar-spine MRI
PE Posterior Element
PTD Percentage of Training Data
RBF Radial Basis Kernel Function
ReLU Rectified Linear Unit
RoIs Regions of Interest
SMAD Symmetric Mean Absolute Surface Distance
SOM Self Organised Map
SVM Support vector machines
TS Thecal Sac
xiii | P a g e
List of Publications
[1] Al-Kafri, Ala S., Sud Sudirman, Abir Hussain, Dhiya Al-Jumeily, Friska Natalia, Hira Meidia, Nunik Afriliana, Wasfi Al-Rashdan, Mohammad Bashtawi, and Mohammed Al-Jumaily. "Boundary Delineation of MRI Images for Lumbar Spinal Stenosis Detection through Semantic Segmentation using Deep Neural Networks." IEEE Access 7 (2019): 43487-43501.
[2] Al Kafri, Ala S., Sud Sudirman, Abir J. Hussain, Dhiya Al-Jumeily, Paul Fergus, Friska Natalia, Hira Meidia et al. "Segmentation of lumbar spine MRI images for stenosis detection using patch-based pixel classification neural network." In 2018 IEEE Congress on Evolutionary Computation (CEC), pp. 1-8. IEEE, 2018.
[3] Natalia, Friska, Hira Meidia, Nunik Afriliana, Ala S. Al-Kafri, Sud Sudirman, Andrew Simpson, Ali Sophian, Mohammed Al-Jumaily, Wasfi Al-Rashdan, and Mohammad Bashtawi. "Development of ground truth data for automatic lumbar spine MRI image segmentation." In 2018 IEEE 20th International Conference on High Performance Computing and Communications; IEEE 16th International Conference on Smart City; IEEE 4th International Conference on Data Science and Systems (HPCC/SmartCity/DSS), pp. 1449-1454. IEEE, 2018.
[4] Khalaf, Mohammed, Abir Jaafar Hussain, Dhiya Al-Jumeily, Thar Baker, Robert Keight, Paulo Lisboa, Paul Fergus, and Ala S. Al Kafri. "A Data Science Methodology Based on Machine Learning Algorithms for Flood Severity Prediction." In 2018 IEEE Congress on Evolutionary Computation (CEC), pp. 1-8. IEEE, 2018.
[5] A. S. Al Kafri, S. Sudirman, A. J. Hussain, P. Fergus, D. Jumeily, H. Al Smadi, M. Khalaf, M. Al-Jumaily, W. Al-Rashdan, and M. Bashtawi, “Detecting the Disc Herniation in Segmented Lumbar Spine MR Image Using Centroid Distance Function,” 2017 10th Int. Conf. Dev. eSystems Eng., pp. 9–13, 2017.
[6] A. S. Al Kafri, S. Sudirman, A. J. Hussain, P. Fergus, D. jumeily, H. Al Smadi, M. Khalaf, M. Al-jumaily, W. Al-rashdan, M. Bashtawi, and J. Mustafina, “Lumbar Spine Discs Labeling Using Axial View MRI Based on the Pixels Coordinate and Gray Level Features,” vol. 10363, pp. 107–116, 2017.
[7] M. Khalaf, A. J. Hussain, D. Al-jumeily, R. Keight, A. S. Al Kafri, and I. O. Idowu, “A Performance Evaluation of Systematic Analysis for Combining Multi-class Models for Sickle Cell Disorder Data Sets,” vol. 10362, pp. 115–121, 2017.
[8] A. S. Al Kafri, S. Sudirman, A. J. Hussain, P. Fergus, D. Al-Jumeily, M. Al-Jumaily, and H. Al-Askar, “A Framework on a Computer Assisted and Systematic Methodology for Detection of Chronic Lower Back Pain Using Artificial Intelligence and Computer Graphics Technologies,” in International Conference on Intelligent Computing, 2016, pp. 843–854.
[9] Natalia, Friska, Hira Meidia, Nunik Afriliana, Ala Al-Kafri, and Sud Sudirman. "Methodology to Determine Important-Points Location for Automated Lumbar Spine Stenosis Diagnosis Procedure." In Proceedings of the 2019 International Conference on Intelligent Medicine and Health, pp. 53-57. ACM, 2019.
1 | P a g e
Chapter 1 . Introduction
Lower back is pain considered as the second most common illness after the common cold. More than half of the world population are affected by lower back pain once in their lives [1]. In the UK, the figure is higher where about sixty to eighty percent of its population will suffer from back pain once in their lives [2]. As a result back pain costs the UK government £1.3 million per day [3]. One of the main techniques for diagnosing the cause of lower back pain is through MRI examination by a radiologist. It has been reported that the number of MRI examination in 2014 has increased in the UK by 11.3% to reach 2.61 million compared with the number of imaging tests in 2013 [4]. However, the number of radiologists in the UK is insufficient for the clinical demand made by the radiology services as there is an increase of 26% for the MRI requests in comparison to only 3% increase in the consultant radiology workforce [5]. The gap between the increasing rate of the radiology services compared to the number of radiologists is very wide which justifies the need for automating the diagnosing process which usually includes two steps that start with labelling the intervertebral discs area then diagnosing the disc abnormality. Lumbar spine MRI images can also be used to diagnose different kinds of diseases such as Lumbar Spinal Stenosis (LSS) which is one of the leading causes of chronic lower back pain. It is a narrowing of the lumbar spinal canal caused by inflammation of bone or soft tissues, which in turn produces pressure on spinal nerve roots. Patients will experience symptoms ranging from radicular pain to atypical leg pain to neurogenic claudication [6]. Chronic lower back pain is suffered by millions of people around the world and MRI is one of the main techniques used for diagnosing patients with back pain. The lumbar spine MRI can be taken of the patients in different positions. However, the most common position is while the patient is in the supine position where that can affect the load and pressure on the disc Subsequently, there have been a number of studies that suggest
2 | P a g e improvements in the way the scans are carried out which include taking the scans while the patient is in an upright position [7] and using a Lumbar Pillow [8]. Other studies propose to use different radiology techniques such as Radiographic Myelography [9] to detect the most difficult cases of LSS. While we acknowledge that these methods can serve as better alternatives to using supine MRIs in some cases, we also argue that supine MRIs remain, in the majority of cases, the most practical way to study the lumbar spine. Our argument lies on a simple fact that the equipment to carry out supine MRI is much more ubiquitous in hospitals than the others. Furthermore, scans taken in a standing or sitting up position are most likely affected by patients' movement due to discomfort and can result in bad quality images. Because our study relies on gathering and analysing a large amount of data, we, therefore, focus on using supine MRI scans rather than other types of scans. For the purpose of brevity, we refer to them simply as MRI in the remainder of the thesis.
In this research, a method is proposed to aid clinicians in performing lumbar spinal stenosis detection through semantic segmentation and delineation of important boundaries in axial-view MRI images. We will first provide a concise review of related methodologies in the literature before presenting the rationale of our proposed method. There is a wide range of algorithms for computer-aided medical diagnosis depending on the type of disease they are targeting. These algorithms are often specific to a certain type of medical images, such as CT scan, X-Ray, intravascular ultrasound, or MRI. This is the case because certain types of images can capture features of certain diseases better than others. For example, the detection of lumen and media adventitia (MA) borders is the key procedure to determine anomalies inside coronary arteries. Production, costs, and insurance are usually matters that involve economics [10] [11].
To achieve the purpose of this research, utilisation has been made of the current advances in image analysis and machine-learning technologies to develop computer-assisted diagnostic software. Clinical studies have shown that there are strong correlations between clinical
3 | P a g e outcome and the morphological characteristics of the patient’s lumbar spine as captured in the MRI images [12]. Using a combination of different image analysis and machine learning techniques, computers can analyse the images and identify regions of interests for clinicians to focus on. The techniques could also be used to provide tools for specialists to help them come to the correct diagnosis quickly. As with many other medical imaging processes, the aforementioned approach will apply image segmentation as one of the earliest yet important steps. To ensure the validity of this step, the process must be grounded in sound medical evidence and reasoning as well as proven methodology.
1.1Research Problems
We deduce from analysing the different relevant algorithms in the literature to date that boundary delineation through image segmentation is a very popular yet effective method to medical image analysis. Nonetheless, we have identified three main problems in the current state-of-the-art research in this field.
1. The first one is the size of the freely available dataset. The most comprehensive database of lumbar-spine-related medical images is hosted by SpineWeb [18], however, it only contains a relatively small sample size and incomplete datasets taken from between 8 and 125 patients. To address this problem, we work together with one specialty hospital in Jordan and several physicians and radiologists around the world to gather a significant number of relevant MRI scans complete with medical annotation to develop our dataset. We made this dataset freely available to the research community. 2. The second problem is the lack of ground truth data and the means to assess its quality. Since the ground truth data is tied to the dataset, the argument of needing a suitably large ground truth dataset also applies. Furthermore, because the task of developing ground truth data by manually labelling the MRI images is a laborious one, it becomes prone to errors. In other words, the data can be inaccurate and inconsistent. We address
4 | P a g e the problem of how to measure accuracy and variability in ground truth data by developing two new metrics which are derived from the existing machine learning metrics.
3. Despite the rapid advances in machine learning techniques, to the best of our knowledge, there is only a limited study on their application to lumbar spine image segmentation. In this research, we show how the new advances machine learning methods can be used to perform the segmentation for the important region of lumbar spine MRI which can subsequently be used for disc herniation and lumbar spinal stenosis detection.
1.2Research Aims and Objectives
1.2.1 Research Aims
The aim of this research is to develop a computer-assisted and systematic methodology for detection and prediction of potential sources of chronic lower back pain.
1.2.2 Research Objectives
To achieve the above-stated aim, the following research objectives are set:
1. To produce a comprehensive literature review that catalogues previous achievements in the related area of research including image processing, computer vision, artificial intelligence, computer graphics, and physics simulation that would provide valuable knowledge, validation criteria and information of previous work relating to this research field.
2. To understand the reasons and causes of CLBP and how this disease affects the lumbar spine. In addition, a clear understanding of the process carried out by the radiologist and orthopaedist when diagnosing CLBP. This can be achieved by interviewing several
5 | P a g e radiologists and orthopaedists and understand their ways of analysing related medical data.
3. To gather a sufficient number of data that is required for this research which includes the lumbar spine MRI images and related radiologist reports.
4. To define methods to do the following: A) Select the MRI image with the best view for the lumbar spine disc that can help in diagnosing and detecting the CLBP. B) Separate the different important regions in the lumbar spine MRI image to help in help in diagnosing patients with chronic lower back pain. C) Locate the important points in the lumbar spine MRI image to determine and measure the relevant features that can be used to detect the cause of the CLBP.
5. To implement a working prototype of the proposed methodology and evaluate its performance. The evaluation will be done by comparing its results with the reports provided by the radiologist for the MRI images used in this research
1.3Research Contributions
1. This research presented a method to aid clinicians in performing CLBP detection through three sub-methods: the first one is Disc Herniation Detection using Disc Segmentation and Centroid Distance Function, the second sub-method is Lumbar Spinal Stenosis Detection via Segmentation of Area between Anterior and Posterior (AAP) Elements, the third sub-method is Semantic Segmentation using Convolutional Neural Networks. The mentioned sub-methods will be used to delineate the important boundaries in MRI images using different types of machine learning algorithms. The delineated images will be used to allocate specific points which have been used to calculate the distance for the spinal canal width as an indicator for the spinal canal stenosis.
6 | P a g e 2. Due to the limitation in size and suitability of the currently existing open-access lumbar
spine dataset, there are a limited number of images in all the available datasets which range from 30 to 242 images and the majority of them are CT images. Moreover, the currently available datasets are not supported by radiologist reports to help the researchers in analysing those images. In addition, the process for receiving the dataset is very complicated. For all these reasons, it has been decided to develop our own dataset. Our dataset contains clinical lumbar spine MRI study of 515 patients with symptomatic back pains. From this dataset, a ground truth label image dataset is developed. It can be used to train and test an image segmentation model.
3. The development of two novel metrics to assess the accuracy and variability of a ground truth dataset, namely the confidence and consistency metrics, respectively. These metrics are derived from the widely used intersection-over-union metric to measure the accuracy of image segmentation algorithms.
1.4Research Goal
The main goal of this research is to provide all researchers “who aim to aid the clinicians in diagnosing patients using different types of images” the base needed to start their research by providing them with the up to date techniques and methods used in this area. The work done in this research can help in developing methodologies to diagnose patients with chronic lower back pain and many other types of diseases like detecting lung cancer or brain tumor. Moreover, the data used in this research is now freely available for all researchers to speed up the research process and benefit in diagnosing other diseases.
7 | P a g e 1.5Thesis Structure
The thesis is divided into 8 chapters, each part covering a specific area of the research work. The remainder of this thesis is organised as follows:
Background Information (Chapter 2): background on lower back pain and the economic cost of this disease has been provided. In addition, the spine anatomy including a detailed explanation about the lumbar spine and MRI have been also discussed.
Literature review (Chapter 3): a literature review on medical image analysis and methods that currently used medical images. The different types of machine learning have been also discussed.
Dataset (Chapter 4): the dataset has been introduced in which all our experiments are performed in the following two chapters. We introduce parts of our image analysis and explain them in more detail, along with explaining the publicly available dataset. Disc Herniation Detection using Disc Segmentation and Centroid Distance
Function (Chapter 5): This chapter discusses in detail a method for detecting the disc herniation using the centroid distance function that uses the disc boundary from the segmented MRI images. This chapter will discuss the selected classifiers and their training results in addition to the experiments’ results.
Lumbar Spinal Stenosis Detection via Segmentation of Area between Anterior and Posterior (AAP) Elements (Chapter 6): A method for presenting an automated delineation for our area of interest (AAP) that are used to help in diagnosing patients with spinal canal stenosis is explained. Furthermore, we have discussed an automatic calculation of the spinal canal width. This chapter also includes the technique used for cropping the images and the architecture for the deep neural network.
8 | P a g e Semantic Segmentation using Convolutional Neural Networks (Chapter 7): The
Convolutional neural network is used to segment four important regions in the lumbar spine MRI image which includes the area of interest (AAP) and three other areas which are the intervertebral disc, posterior element and thecal sac which can be used for diagnosing more diseases. The development of ground Truth data for automatic lumbar Spine MRI Image segmentation will be also discussed in detail in this chapter.
Conclusion and Future Work (Chapter 8): we conclude the thesis, listing our aims, objectives, contributions and discussing potential future work.
9 | P a g e
Chapter 2 Background Information
Back pain is one of the major musculoskeletal pain problems which affects many people and it is considered as one of the main causes of disability all over the world [13]. The Pain Community Centre [14] indicated that in the United Kingdom (UK), 2.5 million people have back pain every day of the year. The survey also found that back problems are the leading cause of disability with nearly 119 million days per year lost. The survey also found that one in eight unemployed people give back pain as the reason for unemployment. Statistically, an individual who has been off sick with back pain for a month has a 20% chance of still being off work a year later [15]. The percentage of people who return to see their general practitioner (GP) with back pain within 3 months is more than 29% [16].
2.1 Lower Back Pain
According to which part of the spine the pain originates from, back pain can be classified into two categories, upper and lower. Upper back pain is not as common as lower back pain. However, although it is not a very common spinal disorder, upper back pain can cause significant discomfort and pain when it occurs. The most common causes of upper back pain are muscular irritation and joint dysfunction. While most patients will have a resolution of their back pain with simple measures such as using simple analgesia and exercise, a small proportion of them develop a more chronic condition, referred to as Chronic Lower Back Pain or (CLBP) [2][17]. CLBP is a debilitating illness that affects the health, social life, and employment of millions of people around the world. In the UK, the cost of treating patients with CLBP is estimated to be around £500 million annually to the National Health Service (NHS) [18]. This is on top of other economic costs resulting from the loss of productivity and other informal care which is estimated to reach around £10,668 million [19].
10 | P a g e It is important to emphasise that CLBP is a chronic illness. While millions of people experience some sort of back pain at one point in their lives, only a small percentage of them experience what is termed acute lower back pain. This form of back pain is often non-specific and may not necessarily be caused by a serious condition. However, a small percentage of people with acute lower back pain can develop CLBP if the underlying cause is serious and left untreated. A study [15] discovered that the longer a person is disabled by back pain, the less chance that he or she returns to work and the more health care cost he or she will require. It is therefore important for early identification of back pain cause to happen, in order to improve the chance of patient rehabilitation.
The speediness of early diagnosis can depend on many factors including referral time from GP to the hospital, waiting time for a specialist appointment, time for an MRI scan and time for the analysis result to come out. Due to the heavy demand for radiologists and clinicians, the whole process could take weeks to complete.
As a short case study, NHS England currently put a target for all imaging and radio diagnostics to be within 6 to 13 weeks [20]. However, specialist shortages have caused many patients to wait longer. A report by NHS England [20] reveals that there is a significant number of cases where diagnostic wait time can be extended to more than 13 weeks. This problem is expected to get worse since the number of scans is historically on an uptrend. A report [21] by the Office of National Statistics shows that there is a 12.3% average annual growth in demand for MRI scans since 1995. This rationalises the need for a new method to increase the efficiency and effectiveness of the imaging diagnostic process.
To have more understanding about this disease detailed explanations and descriptions of the lumbar spine anatomy and the MRI will be discussed in the next sections.
11 | P a g e 2.2 Lumbar Spine Anatomy
The lumbar spine is the lower back area in the spinal column which contains five vertebrae labelled L1 to L5 [22][23]. Figure 2.1 shows the diagram of the relative position of each part of the spinal column and Figure 2.2 describes the lumbar spine and its parts which are the area affected by Chronic Lower Back Pain (CLBP) [24].
12 | P a g e Figure 2.2: Lumbar Spine that contains the vertebrae from L1 to L5 [26].
The lumbar spine is made up of five lumbar vertebrae and each vertebra consists of an anterior (body) arch and posterior (rear) arch. In a T2-weighted mid-sagittal view of the lumbar spine, as shown in Figure 2.3, the two arches are separated by a long white opening. The part of this opening that is visible in this mid-sagittal cut is the Thecal Sac (TS) which contains Cerebrospinal Fluid (CSF), the same type of fluid that resides inside the brain. The back of the opening, which borders with the anterior of the posterior arch, is covered with Ligamentum Flavum (LF). The figure shows the five vertebrae of the lumbar spine labelled L1 to L5. Adjacent vertebrae are separated by an Intervertebral Disc (IVD) which is denoted by the two vertebrae that sandwich the disc, e.g., L1-L2, L2-L3, L3-L4, L4-L5 and L5-S1, the latter being the large triangular-shaped bone at the bottom of the spine, called the sacrum.
13 | P a g e Figure 2.3: A T2-weighted mid-sagittal view of lumbar spine MRI.
The sagittal view of lumbar spine MRI is the easiest to understand and traditionally is considered the best view that can be used to detect certain types of pain-inducing conditions. This can be seen from the methods used by some of the earliest computer-assisted diagnosis of disc herniation [1], [27], [28]. On the other hand, the axial view of MRI is more difficult to read because it has much more information about the lumbar spine at each vertebrae segment. As a result, in this view, the clinicians could identify the exact location of any tissue inflammations, facet cysts, intervertebral disc herniation, stenosis, or fractures. This view, as illustrated in Figure 2.4, can show more information on the various tissues surrounding the vertebra, the IVD and the posterior element (PE) of the vertebral body. Also in this view, we can see clearly the area between the anterior and posterior element of the vertebral body which contains the Thecal Sac and the nerve roots in both lateral recesses. This area extends from the cervical spine down to the lumbar spine. For the lack of a suitable medical terminology, in this thesis, we will refer to this area as AAP, which is short for Area between Anterior and Posterior vertebrae elements.
14 | P a g e Figure 2.4: Axial View of the Lumbar Spine.
2.3Causes of lower back pain
When a patient experiences lower back pain, there may be many possible causes for it, including [29], [30]:
An irritation to either the large nerve roots in the lower back that go to the legs or the smaller nerves supplying the lower back.
Straining of the large paired lower back muscles.
Damage to the bones, ligaments or joints in the lumbar spine. Degeneration or injury of one or more of the intervertebral discs. Lumbar spinal stenosis.
Disc Herniation.
Lumber spine stenosis and disc herniation are widespread medical problems as they can occur when carrying heavy items or having incorrect movements like twisting the lower back and
15 | P a g e many other reasons which cause heavy stress on the disc [31], [32]. In addition, the lumbar spinal stenosis and disc herniation affect a wide range of ages mostly between 30 and 60 years old which means a huge percentage of the population may be affected by the disc herniation in their life. That was the main reason for choosing these two diseases in our research, in this section, two of these reasons will be discussed starting by the spinal canal stenosis followed by the disc herniation.
2.3.1 Spinal Canal Stenosis
Lumbar spinal stenosis is a narrowing of the spinal canal caused by inflammation of bone or soft tissues, which in turn produces pressure on spinal nerve roots. This pressure could result in Chronic Lower Back Pain (CLBP) with symptoms ranging from radicular pain to atypical leg pain to neurogenic claudication [19]. The area between the anterior arch and the posterior arch of the vertebral body, that we discussed previously, extends from the cervical spine down to the lumbar spine. For the lack of a better word, in this research, we will refer to this area as AAP, which is short for Area between Anterior and Posterior. The width of AAP varies depending on the location in the spine where the measurement is taken. Furthermore, there have been a number of studies [20]–[22], which record the measurements of spinal canal widths in a population of different countries and the results suggest that width of AAP is also affected by the patient’s ethnicity.
Lumbar spine stenosis can manifest as the narrowing of any parts of the AAP and depending on where it occurs can be classified as either central stenosis or lateral stenosis. This phenomenon is associated as one of the main causes of CLBP because of both the spinal canal and the lateral part of the AAP, called foramen, house many nerve roots from different parts of the spine to other parts of the body. An abnormal compression of either of them would exert pressure on these roots and creates a sensation of pain.
16 | P a g e The stenosis could occur in any part of the AAP and could be caused by different types of defect such as posterior or posterolateral disc herniation, osteoarthritic thickening of the posterolateral vertebral body, or hypertrophy of LF. In all of these cases, clinicians will measure three distances in the AAP, namely the anteroposterior diameter of the spinal canal and the left and right width of the foramen. This process starts by manual delineation of the boundaries between AAP and the IVD, between AAP and the left and right facet joints, and between the AAP and LF. The three distances and the three boundaries are illustrated in Figure 2.5.
Figure 2.5: The three important boundaries for stenosis detection between AAP and 1) IVD, 2) Facet Joints, and 3) LF to measure a) the anteroposterior diameter of the spinal canal and
b) the left and right width of the foramen
2.3.2 Disc Herniation
Disc herniation is one of the main possible causes of lower back pain. It affects the spinal column by bulging out the nucleus pulposus to the outer ring through the annualus fibrosus [33] causing the pain by applying pressure to the nerve root during most of the body’s movements [34]. Figure 2.6 (A) illustrates a non-herniated disc seen from an axial view
17 | P a g e whereas Figure 2.6 (B) illustrates a herniated disc by highlighting the herniated area which produces pressure to the nerve root.
2.4 MRI Imaging
Magnetic Resonance Image (MRI) is mainly used to diagnose patients with CLBP or those with symptoms consistent with radiculopathy or spinal column stenosis [36]. MRI is the preferred method of medical scans for detecting the causes of back pains. MRI images can be used to visualise lumbar spine, slice by slice, in three view-planes namely sagittal (side), axial (top-down) and coronal (frontal) – typically only the first two are used in lumbar spine MRI.
Sagittal view of lumbar spine MRI is the easiest to understand and traditionally is considered the best view that can be used to detect certain types of pain-including conditions. This can be seen from the methods used by some of the earliest computer assisted diagnosis of disc herniation [28], [37], [38]. On the other hand, the axial view of MRI is much more difficult to read because it has much more information about the lumbar spine at each vertebrae segment.
A. Axial View Model Showing a non-herniated Disc.
B.Axial View Model Showing the Herniated Area on the Disc.
18 | P a g e As a result, in this view, the clinicians could pinpoint the exact location of any tissue inflammations, facet cysts, disc herniation, stenosis, and fractures.
Based on the timing of radiofrequency pulse sequences used, MRI images can be one of two types namely T1- and T2-weighted MRI [39]. The same tissue could have markedly different intensity levels when imaged in each type. One example is Cerebrospinal Fluid (CSF), a clear and colourless body fluid that can be found inside our brain and spinal cord. Identification of CSF tissue in MRI images has significant relevance to our case since it surrounds the many nerve roots inside the spinal cord. Further and more detailed information on MRI and its uses as medical imaging technology are explained in chapter 4.
2.5Diagnosis of the Lower Back Pain
The diagnosis of back pains is usually carried out by a radiologist or an orthopedist through manual inspection and observation of the patient’s spine MR images, because of the nature of different causes of back pains and the way each of them is diagnosed and treated.
2.5.1 The current method of diagnosing the spinal canal stenosis and disc herniation.
Currently diagnosing the lower back pain is done by visual observation and analysis of the lumbar spine MR images and this process could take up much of a radiologist’s time and effort. To understand this process, several interviews have been done with experienced clinicians in this field to summarise these steps. The current visual observation approach by the radiologist for diagnosing the spinal canal stenosis and disc herniation is explained in the following steps.
1. Selecting the best axial view for the appropriate disc. Normally, each disc has a range of slices between 3 and 5 images and the best axial view slice is the image that shows all the required details in a way that gives the radiologist the ability to take a diagnosing
19 | P a g e decision in the current disc for a particular disease. An example of the selected image for the disc L3-L4 is shown in Figure 2.7.
Figure 2.7: The selected slice for the disc L3-L4.
2. The radiologist or the orthopaedist then will find a point at the bottom centre of the disc as in Figure 2.8.
20 | P a g e 3. On this step, they need to allocate the lowest point in the spinal canal as shown in Figure
2.9.
Figure 2.9: Shows the lowest point on the spinal canal for the disc L3-L4.
4. Find the distance between the point at the centre of the disc and the lowest point of the spinal canal as displayed in Figure 2.10.
Figure 2.10: Illustrate the line between the lowest point on the spinal canal and the point at the bottom centre for the disc L3-L4.
21 | P a g e 5. Compare the distance with the standard distance for the normal lumbar spine and then
decide if spinal canal stenosis is there or not.
2.6Chapter Summary
While diagnosis accuracy is most paramount in medicine, we argue that it is also important to improve the effectiveness of the early diagnosis process to prevent benign cases from becoming more acute and chronic. A diagnosis of lumbar spine stenosis and disc herniation is performed through inspection of a Magnetic Resonance Imaging (MRI) scan of the patient’s lumbar spine. The current diagnosing process of the lower back pain could take up much of the physician’s time and effort. Moreover, it can increase the probability of misdiagnosis. The speed of early diagnosis can depend on many factors including referral time from the general practitioner to the hospital, waiting time for a specialist appointment, time for an MRI scan and time for the analysis result to come out. Due to the heavy demand for radiologists and clinicians, the whole process could take weeks to complete. Developing a computer-aided diagnosing system will help the clinicians to efficiently diagnose this kind of disease. At the same time, there is a pressing need for this type of application to help radiologists and orthopedists in their tasks. In our method, however, we argue that it is best to use the axial-view slice of the MRI because it has much more information about the lumbar spine at each vertebrae segment than a sagittal-view slice. In the following chapter, the literature resagittal-view for the current methodologies that use the medical images in the computer-aided diagnosing is discussed.
22 | P a g e
Chapter 3 Literature Review
Clinical studies have indicated that morphological characteristics of lumbar discs and signal intensity of the patient’s MR image have a strong relationship with clinical outcome [34]. To this end, Computer Vision and Artificial Intelligence algorithms can be utilised to exploit these facts by analysing the MR images, calculating appropriate image features, and classifying them to decide if any particular regions in the image belong to problematic areas. The literature review in this research is build using the up to date published research which includes the medical images, computer-aided diagnosing system, and machine learning. The research started by analysing most of the available research and only the significant research is referenced in this thises.
3.1Medical Image Analysis
Image features are as a set of important information derived from an image or a subset of an image that can uniquely describe the image contents. This information is extremely important in computer vision as it can be used to label or mark specific locations of the image and can be used in comparing different images. There are two types of image features namely global and local features.
Local features are computed at different locations in the image using only the small support area around the location point. As such, local features describe only the image in the context of that small subset and nothing else. That means even when the other parts of the image undergo changes, as long as the support area remains the same, local features would more likely not be affected. This is one of the strong points of local features over global features because they are robust to occlusion. Examples of local features are corners, edges, and texture descriptors. On the other hand, global features are derived from the entire image which results in their ability to generalise the entire image into one single feature vector. One example of
23 | P a g e global features are image code, which is a compressed form of the image using an appropriate coding technique that preserves the high-level information of the image contents [40]. Alternatively, global features could be constructed from a collection of local features such as shape descriptors, contours descriptors and/or texture descriptors.
Image analysis and comparison are performed by means of classifying its features. This is done by comparing the features from the test image in question with those from training data. A brute force approach for comparing two sets of image features would compare every feature in one set to every feature in the other and keep track of the "best so far" match. This results in a heavy computational complexity in the order of O(N2) where N is the number of features in each image. A number of algorithms have been proposed to improve the computational complexity, including the popular kd-tree technique [41]. This technique uses the exact nearest neighbour search and works very well for low dimensional data but quickly loses its effectiveness as dimensionality increases. The popularity of the kd-tree technique has seen a number of proposals to further improve the algorithm including [42], [43]. The success of a more recent matching technique called Fast Library for Approximate Nearest Neighbour (FLANN) [44] is another example how the computational complexity of image feature comparison can be further reduced to allow near real-time execution.
The uniqueness of each proposed algorithm in this category often lies in the choice of features and matching algorithms as well as a novel application of existing methods to a new or untested application. Below we review a number of algorithms that were proposed to identify regions in the MRI that are responsible for CLBP.
A method for curvature scale space image in shape similarity retrieval is developed in [45]. The paper used the curvature scale space CSS images to solve the problem in the shape similarity retrieval in image databases. The arch-shape contours in the CSS images are used to
24 | P a g e represent the flexion of the shape in the image. The shape is represented by having the maximum of this contour. The CSS representation provides a method which can be easily used for the process of the shape similarity retrieval.
Ma and Manjunath [46] have provided an implementation of NeTra which is an image retrieval system by using many different features including the image colour, information of the location for the segmented region of the image, texture and the shape. An algorithm for image automatic segmentation is developed that gives the ability to search for a specific region on the image. They are segmenting the images into different regions after which a calculation for the image attribute is done. Moreover, there are many other processes performed to increase the performance of the retrieval process which represents the colour, colour indexing, texture and calculating the shape features. The curvature, centroid, and complex functions are used by the author’s experiment as a contour type derived from the boundary coordinate.
Saleh and Eswaran in [47] developed an automatic diagnosing system for diabetic retinopathy. The system has a user-friendly interface which gives the ability to grade the severity of the diabetic retinopathy after locating and examining the first indication for the disease. The authors use the centroid distance function and depend on the shape to find the exact location of the optic disc.
3.2Medical Images in the Computer-Aided Diagnosing System
Computer-Aided Diagnosis (CAD) systems have been researched and developed to improve the effectiveness and efficiency of many medical procedures. As an example, when locating regions of interest in medical images for radiologists to focus on, or to provide a “second opinion” before a physician makes their final decision. It is important to note that fully automated diagnosis systems are not expected to replace, in the foreseeable future, experts performing medical diagnoses. Instead, a CAD system is expected to complement the
25 | P a g e physicians’ ability rather than replace it [48]. The development of a CAD system involves modelling and embedding medical knowledge and thus incorporate a design of artificial intelligence through machine learning.
Visual observation and analysis of MR images could take up much of a physician’s time and effort. As a result, physicians would opt to use a Computer-Aided Diagnosis (CAD) to help with this task. There are a number of CAD systems that can be used for various clinical purposes ranging from a CAD system for detecting colonic polyps and breast cancer in mammography, to another for detecting prostate cancer using MR images [27]. Despite the availability of these systems, physicians still have to overcome a number of technical challenges due to the wide range of imaging characteristics and resolutions [49] as well as due to the limitation of the algorithms employed to highlight areas of interest.
Segmenting the area of interest and allocating the border for the segmented area is one of the main required tasks to help in automising the diagnostic process. There are many different methods that have been developed for segmentation and disease detection. One of the most recent frameworks for detecting these borders was proposed by Gao et. al. [10]. In [50], the authors then apply this framework by using an Artificial Neural Network (ANN) method as the feature learning algorithm for detecting the borders. In this method, two types of imaging information, including spatial-neighbouring features, were used as the input data to one ANN that has two sparse auto-encoders as a classifier. Another ANN was used as an optimizer. The paper presented a comparison between this method’s performance and the manual drawing approach on 461 IVUS images and reported a highly accurate result. A variant of the method using three types of features has also been proposed in [51] using 538 IVUS images.
Intravascular ultrasound images are not, however, the only possible source of information for detecting vascular anomalies. Recently, a regression segmentation framework to delineate the
26 | P a g e boundaries of bi-ventricle from cardiac MRI was proposed [52]. In this framework, a regression model has been trained automatically on a deep belief network by using extracted DAISY feature [53] as input and using automatically generated boundary points as labels. The method was reported to yield high performance when tested on 2,900 images taken from 145 clinical subjects.
MRI scans and Neural Networks have also been used to diagnose other illnesses. A recent study [54] shows that a Convolutional Neural Network (CNN) can be used to reliably (with a reported accuracy of 98.8% when data augmentation and stochastic pooling are applied) identify Multiple Sclerosis in brain MRI scans. The experiment was conducted on images from an open-source dataset [55] (containing 676 Multiple Sclerosis slices from 38 subjects) and another [56] (containing 681 healthy slices from 26 subjects) as a control dataset
3.3Computer-Aided Diagnosing System for Lumbar Spine Stenosis
The previous methods are some of the most recent examples of how image segmentation can be used for border detection and delineation in medical images. There is a wide range of algorithms for computer-aided medical diagnosis depending on the type of disease they are targeting. These algorithms are often specific to a certain type of medical images, such as computed tomography (CT) scan, X-Ray, intravascular ultrasound, or MRI. This is the case because certain types of images can capture features of certain diseases better than others. For example, the detection of lumen and media adventitia (MA) borders is the key procedure to determine anomalies inside coronary arteries. This procedure is most often carried out using intravascular ultrasound (IVUS) images rather than any other types of images because it has been well recognized as one powerful imaging techniques to evaluate the stenosis inside the coronary arteries.
27 | P a g e Jiang et. al. proposed a visualization and quantitative analysis framework using the image segmentation technique to derive the features that are extracted from patients’ MR images, which were found to have a close relationship with the Lumbar Disc Herniation score [57]. The features are the distribution of the protruded disc, the ratio between the protruded part and the dural sacs, and its relative signal intensity.
Alomari et. al. [27], [28] proposed a probabilistic model for automatic herniation detection work by combining the appearance and shape features of the lumbar intervertebral discs. The technique models the shape depending on both the T1-weighted and T2-weighted co-registered sagittal views for building a 2D feature image. The disc shape feature is modelled using Active Shape Model algorithm while the appearance is modelled using the normalised pixel intensity. These feature-pairs are then classified using Gibbs-based classifier. The paper reported that 91% accuracy is achieved in detecting the herniation.
A vertebrae detection and labelling algorithm of lumbar MR images is proposed in [49]. The paper firstly converts the 2D MR images to 3D before using them as an input to the detection algorithm. This detection algorithm is a combination of two detectors namely Deformable Part Model (DPM) [58] and inference using dynamic programming on chain [59]. After the spines were detected in the 3D images a graphical model of the spine layout is built and bounded boxes for all vertebrae in the images are labelled. The algorithm is evaluated on a set of 291 lumbar spine test images with a variable number of vertebrae visible and is reported to achieve 84.1% and 86.9% correct identification rate for overall vertebrae and lumbar vertebrae respectively.
A computational method to diagnose Lumbar Spinal Stenosis (LSS), which is a medical condition in which the spinal canal narrows and compresses the spinal cord, from a patient’s Magnetic Resonance Myelography (MRM) and MRI was proposed. An image segmentation