Using Local Moran’s I to identify contamination hotspots of
rare earth elements in urban soils of London
Yumin Yuan a, Mark Cave b, Chaosheng Zhang a*
a International Network for Environment and Health, School of Geography and Archaeology, National
University of Ireland, Galway, Ireland
b
British Geological Survey, Environmental Science Centre, Nottingham, United Kingdom * Corresponding author. Tel: 00353 91 492375; fax: 00353 91 495505.
E-mail address: [email protected] (C. Zhang).
Highlights
Local Moran’s I is used to identify contamination hotspots of REEs in urban soils.
Several areas in London soils had elevated concentrations of Ce, La, Nd, Sc, Sm, Yb and Y. Soil parent material was the natural factor leading to enrichment of REEs in some areas. Possible anthropogenic sources include fertilizer, industries activities and vehicular emission.
Abstract
Rare earth elements (REEs) in urban soils are receiving more attention because of their increased use in modern technology. Up to now, there is little information about the spatial patterns of REEs and their influencing factors in urban soils. In this study, based on the British Geological Survey “London Earth” geochemical survey data containing a total of 6467 soil samples collected from the urban area of London, the spatial distributions of Ce, La, Nd, Sc, Sm, Yb and Y, and their influencing factors were investigated. The element Sc is included in this study as related element. Urban samples were collected at a depth of (0 to 20 cm), and total concentrations of 48 chemical elements were determined in the < 2 mm size fraction of the topsoils using X-ray Fluorescence Spectrometry (XRFS). Spatial clusters and spatial outliers were identified using the index of local Moran’s I, showing elevated concentrations of REEs in the northwest, northeast and southern parts of the study areas while all the 7 REEs exhibited generally similar spatial patterns: high values were mainly located in soils over Alluvium, Glacial till and Clay-with-flints deposits, demonstrating the close relationships between REEs and the lithology. Meanwhile, hotspot analysis revealed high values of REEs in public parks, private golf clubs, wetlands and agricultural lands especially in Hillingdon, Enfield, Brent, Harrow, Croydon and Bromley. Soil parent material was identified as the primary source for larger spatial patterns of natural origin, while smaller spatial patterns were associated with anthropogenic sources
including agricultural practices, industrial activities, vehicular emission and urbanization. The REE hotspots revealed in urban soils may imply potential contamination requiring further attention.
Key words: Hotpots analysis; Rare earth elements; Local Moran’s I; Urban soil
1. Introduction
The rare earth elements (REEs) are a group of seventeen chemical elements comprising the 15 lanthanides elements (lanthanum to lutetium), scandium (Sc) and yttrium (Y) (Henderson, 1984 and Mareike L, 2011), and are of increasing economic importance, because their unique properties are proving to be indispensable and essential for a number of new technologies. Over the past decades, there has been a sharp emergence in demand for REEs with a consequent increase in anthropogenic REE discharges to the environment (Volokh et al., 1990; Chua, 1998; Liang et al., 2005). After excessive REEs enter soils, they can be transported to ground water, accumulate in the soil surface,
and then enter humans through ingestion, dermal contact or inhalation (Abrahams, 2002;
Meza-Figueroa el at., 2007; Guo et al., 2012; Liang et al., 2013; Benhaddya and Hadjel, 2014). Due to their long residence time in soils and their potential toxicity, the contamination of urban soils has become more important in recent years (Harrison et al., 1981; Schuhmacher et al., 1997; Li et al., 2001; Wang et al., 2005; Li and Huang, 2007; Rashed, 2010). Several studies have shown that elevated concentrations of REEs in urban soils, not only influence the quality of the local environment, but also pose a potential human health risk (Husain et al., 1980; Ichihashi et al., 1992; Raghunath et al., 1999; Feng et al., 2000; Yuan et al., 2003; Chen Z Y, 2005; Liang et al., 2005; Chen and Zhu, 2008). For instance, REEs can accumulate in human brains via blood circulation, which may induce neurotoxic effects (Hollriegl et al., 2010 and Rim et al., 2013), cause lung diseases when inhaling dust and metal fumes (USEPA, 2012), and afflict patients with diseases such as leukemia, cancer, and birth defects of children (Ismail et al., 2001; Liang et al., 2014; Rim et al., 2013). In addition, high exposure levels of REEs may lead to liver function decline (Wei et al. 2013). Due to the rapid development of modern technology, the need of these elements has increased significantly in industry, and consequently anthropogenic REEs could emerge as a severe environmental problem in cities and significant source of contamination of urban soils (Carrero et al., 2013).
The origins of REEs in urban soils include natural and human sources, like other trace metals. In most areas, the concentrations of REEs in soils are mainly determined by the natural sources of local geology weathered to form the parent materials (Liu, 1988; Beckwith and Bulter., 1993; Dong et al., 2001; Hu et al., 2006; Schulin et al., 2007). On the other hand, the influences of human activities include mining, waste disposal, fertilizer, coal and fuel combustion and industry processes may cause
elevated concentrations of REEs in soils (Zhang et al., 2001; Lou et al., 2012b; Szolnoki et al., 2013). For example, through the phosphate fertilizers, approximately 85 tonnes of neodymium (Nd) were discharged into the environment in the Netherlands in 1994 (Sneller et al., 2000). In the USA, the catalyst emission of REEs into atmosphere by petroleum refineries(Mizohata, 1986; Dzubay et al., 1988).In particular, as noted by Kertis and Yudowich (2009), coal fly ashes can be regarded as one of potential sources of REEs, which contain 445 ppm of REEs on an average global basis. Therefore, it is important to understand the background variation of REEs in urban soils at a variety of scales from continental(Salminen et al., 2005; Reimann et al., 2015) to local, as in this study.
Due to the complex land use and heterogeneous nature of urban soils, the concentrations and distribution of REEs vary over space (Goovaerts, 2000; Legret and Pagotto., 2006; Mmolowa et al., 2011). When evaluating the potentially toxic elements from a specific area, it is necessary to assess the current status of REEs contamination and explore the factors that have influences on REE accumulation and distribution in urban soils (Liang et al., 2013 and Zhang el at., 2016). Mapping based on geographical information system (GIS) in conjunction with statistical methods are useful approaches to describe the spatial distribution of contamination and to explore possible contamination sources in urban soils (Liu et al., 2006; Tiwari and Rushton, 2010).The local Moran’s I index has been identified as an effective method to identify contamination hotspots (Zhang et al., 1995; Anselin, 2001; Overmars et al., 2003). This index examines the individual locations based on a comparison with the neighbouring samples, which has been successfully applied in environmental research and planning (Mc Grath and Zhang, 2003; Zhang and McGrath, 2004; Brody el at., 2006).
London is located in the south east of Great Britain. It has a long history of the use of coal, industrialization and urbanization (Royse et al., 2012). Metal mining and peat burning have already existed over several millennia in the British Isles (Mighall et al., 2002; Meharg and Killham, 2003; Oldfield et al., 2003), which could have resulted in trace element discharges directly in soil and emissions into the atmosphere which eventually deposit into soil. But the pre-industrial status of trace elements in soils is not obvious particularly in urban soils where the history of land use is complicated and thus the potential sources of contaminated soil are difficult to unravel (Leung et al. 2008;Xu et al. 2013a, 2013b; Yang et al., 2013a). Moreover, research into REEs in urban soils and the information on the impacts of REEs on human health are still lacking, especially the spatial distribution of REEs in topsoils. This information is very important in order to identify contamination hotspot areas and assess the potential polluting sources in an urban region. The demand for REE-based materials is an increasing trend and it is an urgent mission for Britain, to give priority to the development of new sources of REEs outside of China and greater recycling from priority waste streams (Erecon, 2014). Supervision and control of the extent and severity of soil contamination and the potential sources of
REEs in urban soils is thus significant for urban environmental management. The aim of this study was to identify contamination hotspots of Ce, La, Nd, Sc, Sm, Yb and Y in the urban soils of London city using the local Moran’s I index and GIS. The objectives were to: (i) investigate the concentration of seven REEs in urban soils; (ii) identify contamination hotspots by these REEs in the soils in the city of London; and (iii) explore the influencing factors of these REEs in the study area.
2. Materials and methods
2.1.Study area and soil samplings
The London Earth field survey of a total of 6467 soil samples were collected at a depth of 5 to 20 cm and a sampling density of four samples every square kilometre from the city of London and London
Boroughs (GLA) during 2005 to 2009 (Johnson et al., 2005 and Knights and Scheib, 2010). Each
sample comprised of a composite sample, consisting of 4 soil cores taken from 20×20 m square at four corners and the centre, for the purpose of achieving a grid of high density sample coverage for the entire GLA with samples spaced about 500 m apart (BGS, 2011 and Flight and Scheib, 2011). All soil samples were air-dried and then passed through a nylon sieve to <2 mm and sub-sampled by coning and quartering.Subsamples were further ground in an agate planetary ball mill (50 g), with 95% of the material finer than 53 µm. The total concentrations of the 48 chemical elements were determined for each sample by wavelength dispersive X-ray fluorescence (XRF) spectrometry, together with loss on ignition (LOI at 450˚C) and pH in all the urban samples. Sample preparation, detection limits, and quality control procedures are described in Allen et al. (2011) and Johnson (2011).
2.2.Local Moran’s I
Moran’s I involving global and Local Moran’s I, is commonly used to study spatial autocorrelation. In this study, Local Moran’s I index was used as a local indicator of spatial association (LISA). It was calculated for every sampling location to reveal the degree of spatial autocorrelation (Anselin, 1995). It is also a widely used tool for identifying contamination hotspots in urban soils, as well as classifying them into spatial clusters and spatial outliers (Zhang et al., 2008). Local Moran’s I index (Anselin, 1995), is expressed as:
= ,
Where represents the Moran’s I coefficient; represents the variable (here REE) at location i; is the mean value of the variable with the sample number; is the value at other locations (where j i);
is the variance of z, and is the spatial weight which can be represented based on a distance
weighting between and (Zhang et al., 2008).
A positive local Moran’s I value refers to the location under study which has similarly high or low values as its neighbours and then the location is called a “spatial cluster”. On the other hand, a negative local Moran’s I value indicates a potential spatial outlier which is different from the values of its surrounding locations(Lalor and Zhang, 2001). In this study, the Local Moran’s I was applied to identify the spatial clusters and spatial outliers of each of the seven REEs based on 9999 permutations at the significance level of p < 0.05. Various distance bands for the weight function were tried with the REEs, The results from the distance band of 1000m were chosen, which not only revealed the spatial clusters in the city centre, but also allowed other general patterns to emerge (Zhang et al., 2008).
2.3.Inverse Distance Weighted
The inverse distance weighted (IDW) interpolation estimates values at un-sampled points using weighted average of the sampled points within a selected number of neighbours of the un-sampled location(Robinson and Metternicht, 2006). In IDW, the value of can be estimated from data using the following equation:
= ,
Where n is the number of neighbouring points used for the calculation, and p is a positive real number called the power parameter (typically, p = 1 or 2), di means the distance between the sampled location and the un-sampled location for which an interpolated value is sought
(Isaaks and Srivastava, 1989)
. Based on the spatial correlation between scattered points, as the simplest spatial interpolation method,the IDW method is widely applied in soil geochemical mapping (Shepard, 1964 and Wackernagel,
1998). In this study, the power of 1 and the number of neighbouring samples of 16 were chosen in order to show smooth spatial patterns of the pollutants and reduce the ‘bulls-eye’ effect. A ‘quantile classification’ was applied to allow the REEs concentration values to reveal their spatial patterns.
2.4.Data transformation and computer software
To limit the influences of outliers and to exhibit the pattern of that element relative to the average behaviour of other elements in this compositional dataset, a centred log-ratio (clr) transformation (Mckinley et al., 2015)was employed for the data. The centred log-ratio (clr) transformation and box-and-whisker plots were carried out in R, an open source software. SPSS (version 21.0) was used for
the descriptive statistics. All maps were produced using GIS software ArcMap (version 10.3), and the Local Moran’s I index was calculated using GeoDa (version 0.95i, Spatial Analysis Laboratory, 2007).
3. Results
3.1 REEs concentrations in urban soils
There is no information available on the background values for REEs concentrations in urban soils of the London. Therefore, we used the statistical parameters of REEs concentrations in European soils data for FOREGS to evaluate REEs contamination in our samples(Salminen et al., 2005; Martiya et al., 2012). The descriptive statistics (minimum, maximum, mean, median, standard deviation (SD), coefficient of variation (CV), skewness and detection limits) for the raw data of the REEs and selected soil properties (pH, LOI) are summarized in Table 1. The median concentrations of Ce, La, Nd, Sc, Sm, Yb and Y in the study area were 49, 24, 21.4, 7.9, 3.4, 1.8 and 20.4 mg/kg-1, respectively.
According to the median concentrations of REEs in European (Table. 1), the results indicated that REE concentrations in London urban soils did not reach the environmental and health risk thresholds. Table 1 shows the accumulation order of REEs in all samples in descending order was Ce>La>Nd> Y>Sc>Sm>Yb. In addition, the coefficient of variation (CV) can be used to compare in relative terms the variability of the same property under similar values of variances and different means (Wang et al., 2014).Based on the coefficient of variation (CV), the variability of La, Nd, Sc, Sm, Yb and Y was moderate with the CV fluctuating from 0.7%-76.5%. The highest CV of soil Ce concentration was 166.2% (Table.1) indicating that Ce could be enriched in some parts of the study area.
Table 1 Descriptive statistics of REEs in topsoils of urban soils in London. (n= 6467, unit in mg kg-1)
Min 25% Mean Median 75% Max SD CV Ske DL %<DL FOREGS
Ce 18 43 50.9 49 57 238 12.9 166.1 2.3 1 0 48.2 La 3 20 25.2 24 29 130 8.8 76.6 2.5 1 0 23.5 Nd 0.5 17 22.3 21.4 26.1 122.8 8.7 76.2 2.8 4 0.07 20.8 Sc 0.2 6 8.3 7.9 10.2 33.3 3.2 10.2 0.6 3 2.59 ~ Sm 0.1 2.3 3.6 3.4 4.7 25.8 2 4.1 1.7 3 39.4 3.9 Yb 0.1 1.3 1.9 1.8 2.4 8.8 0.9 0.8 0.8 1.5 31.6 1.9 Y 4.8 17 21.1 20.4 24.1 132.9 7.6 58.2 4.3 1 0 ~ pH 2.8 5.6 6.2 6.6 7 8.3 1 1 -1 0.01 0 ~ LOI 0.71 5.9 7.8 7.3 9.1 58.7 3.1 9.9 3.5 0.01 0 ~
SD: standard deviation; CV: coefficient of variation; DL: detection limits
3.2 Spatial distribution of REEs
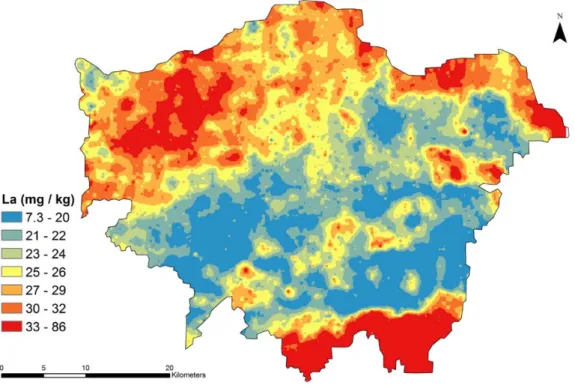
The spatial distribution map of La in the urban areas of London city is shown in Fig. 1. The spatial distribution maps for Ce, Nd, Sc, Sm, Yb and Y are shown in the Appendix (Fig. A1). Due to their similar chemical and physical properties and close behaviour in the environment (Henderson, 1984;
Tyler, 2004a; Hu et al., 2006b) all 7 REEs displayed similar spatial patterns showing the elevated values in the northwest, northeast and south parts. Sc exhibited slightly elevated values in the central area. Low values of REEs were located along both sides of the River Thames. Of particular note, are the large areas of elevated and low concentrations reflecting the influences of natural factors. Meanwhile, a large amount of scattered elevated values can also be observed surround by relatively low values, indicating the presence of potential spatial outliers, which are discussed in more detail in the following sections.
3.3 Spatial-cluster and spatial-outlier analysis
For the Local Moran’s I results for the centred log-ratio transformation data of Ce, La, Nd, Sc, Sm, Yb and Y concentrations in London soils (Fig. 2), most of the REEs in soil showed generally similar spatial patterns. About 40% of the REEs in samples of soil belonged to the significant spatial clusters including high-high and low-low spatial patterns, except for Yb and Sm with smaller percentages (Table 2). For soil La, Ce, Nd and Sc, the northwest and southern regions of the study area were dominated by High-high patterns, and the low-low spatial clusters were located in the central area. It is worth noting that the Local Moran’s I index is sensitive to outliers(Zhang et al., 2008). In the maps for the 7 REEs, most of the high-low outliers were located close to the Low-low cluster in the central area. There were some high-low outliers in the northern and eastern part of city. Spatial outliers in the city centre, west and northeast were in accord with their high concentrations (Fig. 1).
Table 2 Numbers of soil samples identified as spatial outliers and spatial clusters based on LISA method
REEs Not significant High-high Low-low Low-high High-low
Ce 3758 1059 1199 165 286 La 3602 1094 1383 119 269 Nd 4046 909 1096 127 289 Sc 4364 1154 517 200 232 Sm 5116 573 326 153 299 Yb 5018 667 337 178 267 Y 3887 854 1341 115 270 High-high clusters: high values in a high value neighbourhood.
Low-low clusters: low values in a low value neighbourhood. Low-high outliers: a low value in a high value neighbourhood. High-low outliers: a high value in a low value neighbourhood.
Fig. 2. The LISA maps of soil (a) Ce, (b) La, (c) Nd, (d) Sc, (e) Sm, (f) Yb, (g) Y (Distance Band = 1000 m).
Fig. 3. Simplified soil parent material map of the London region (GLA = Greater London Authority )
Fig. 4. Hotspots of REEs overlaying on simplified soil parent material map of the Greater London Authority (GLA).
Fig. 5. LISA map of soil La in the London city (Highlighting hotspots and cool spot of La).
4. Discussion
4.1 Geogenic factors
4.1.1 Bedrock
All seven REEs had very similar spatial patterns, with a large number of hotspots simultaneously located in the northwest and southern parts of the study area, while most of the cool spots of the REEs are found in the middle of the study area (see Fig. 1 and Fig. 2). This pattern corresponds to the soil parent materials in the study area, with the samples plotted on their underlying rock types (Fig. 3 and Fig. 4). Soils from the White chalk subgroup, Clay-with-flints and Thames Group (clay) areas displayed the highest REE concentrations among all the rock types, followed by the Alluvium and Brickearth areas. The elevated REE concentrations are associated with the Chalk and the predominantly chalky deposits developed over carbonate rocks due to weathering, mineralization and transportation processes. The Chalk of the London Basin is typically a fine grained white limestone made mainly from organically precipitated aragonite (Hancock, 1975), which arepresent in the GLA area to the south and west. Compared with chalk, flint is a very hard, brittle, siliceous material formed in bands in the more carbonate-rich chalks, which is a very widespread deposit, covering south and upper east of the Basin. Ca minerals may have bound most REEs in the earth’s crust during magmatism and hydatogenetic processes (Alessandro et al., 2009),as a result a large number of REEs in soil minerals emerge in the form of carbonates. REEs are hydrolysed in the soil, and the amorphous hydroxyl groups, RE (OH) 2+, are adsorbed to the surfaces of clay minerals and Fe-Mn oxides in soils
(Zhu and Xing, 1992a). According to the result, the close association between carbonate rocks and REEs was clearly revealed by the LISA results (see Fig. 4).
Fig. 6. LISA maps for (a) Al2O3, (b) TiO2 (Distance Band = 1000 m).
Furthermore, The LISA maps of Al2O3 and TiO2 illustrate the high concentrations in top-soils over the
London Clay (Thames Group clays), Clay-with-flints and Alluvium, as well as particularly low concentrations in most of the River Terrace deposits, Plateau Gravels and the Thanet Sand Formation (seeFig. 6).Zones highly enriched in those elements indicate that REEs are probably either adsorbed by clay minerals or bound to Fe- and Mn-(hydr) oxides and or fixed within crystal lattice of ilmenite (Liu et al., 2006 and Giusti., 2013). The positive correlation between REEs and Ti in weathering profiles indicate that the released REEs are fixed by clay minerals and Fe-oxides/hydroxides (Middelburg et al., 1988). Previous studies also support the result that clay minerals in surface sediments also impact the adsorption of trace metals in combination with Fe, Mn amorphous oxides, and even some of which may cover clay surfaces (Bradl, 2004). Thus, the high level of those trace metal concentrations may be the consequence of the higher clay content in the subsoil of the northwest and south part of the study area. It is not unreasonable to assume that soil parent material and weathering process are a natural factor leading to enrichment of REEs in soils of this district.
4.1.2 Influences of pH and soil type
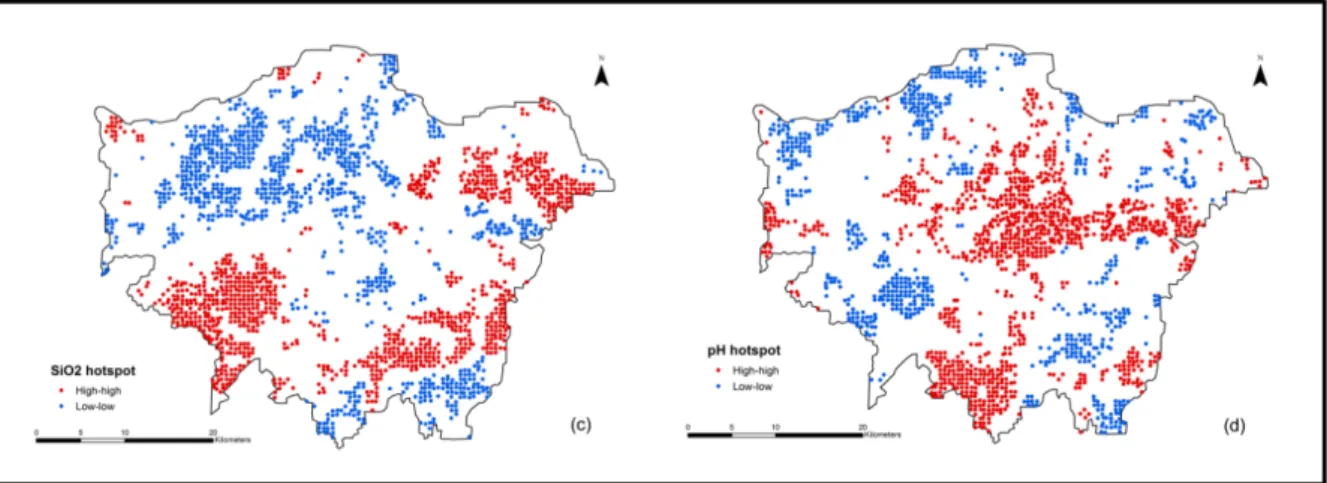
The LISA map of La, Nd, Sm and Y shows that a cool cluster in Richmond upon Thames (see Fig. 2). Richmond Park, in the London borough of Richmond upon Thames, has little history of industrial activities. The reason for the cool pattern is not only related to the lack of anthropogenic activity in this area, but also due to the pH and soil type. The majority of Richmond is underlain by River Terrace deposits which vary in age and thickness, and are composed mainly of gravels and sands. The LISA map of SiO2 (see Fig. 7) reveals a large of high-high cluster located in Richmond Park, which
also indicates low content organic matter. This occurs because as the SiO2 percentage rises with an
increase of sandstone in sandy soil there is a decrease, by dilution, of organic matter and CaCO3 (Bear, 1964). Owing to the dissociation of protons from the carboxyl and phenolic groups of humic polymers in the soil, studies (Beckwith and Butler, 1993) show that organic matter contributes dramatically to the adsorption of REEs. Thus, the sandy soil containing the high concentrations of SiO2 is likely to be
in Fig. 6, and a clear cool pattern of soil pH in Richmond Park is observed. The soil pH value is another essential consideration affecting the adsorption of REEs (Dong, et al. 2001., Gao, Zhang, and Wang 1999b). When soil pH is high, the surface of soil particles are charged with more OH¯ ions, so that dissolved REE ions can easily form complexes, such as Ln (OH)2+ and Ln (OH) (Zhu and Xing, 1993). Therefore, adsorption of REEs generally increases with higher soil pH values. The maps of SiO2 and pH, and cool patterns of REEs in the topsoil, clearly show the influence of soil types and pH on REE content.
Fig. 7. LISA maps for (c) SiO2, (d) pH (Distance Band = 1000 m).
4.2 Anthropogenic factors
4.2.1 Influences of fertilizer application
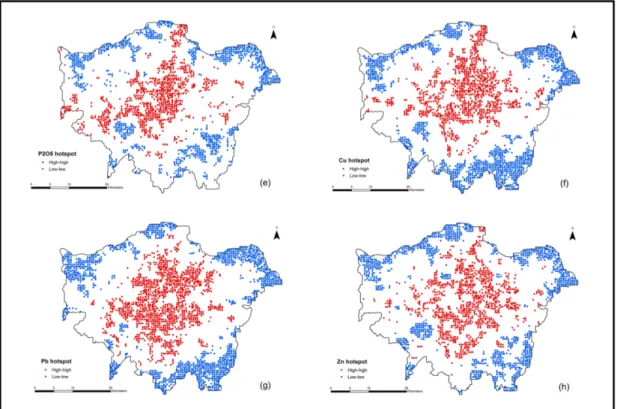
Relatively high concentration of Ce, La, Nd, Yb and Y hotspots are also found in parks, wetlands and agricultural lands especially in Hillingdon, Hounslow and Enfield (see Fig. 2). They present, some scattered High-high cluster and High-low outliers of these five REEs in farmlands and wetlands(Fig. 2 and Fig. 5), indicating similarities in their origins. We also observed a larger concentration of High-high clusters of P in the central of London, especially accumulating along the banks of the main river (Fig. 8). It is widely recognised that the P-fertilizers are an important path for REEs and metals get into agricultural soils (Buckingham et al., 1999; Hu et al., 2004; Pang and Peng, 2002). With an annual agricultural input rate of 300 kg ha-1 of P-fertilizers, about 30-170g REEs ha-1 will inevitably
enter the soil (Todorovsky, Minkova and Bakalova, 1997). The map of P shows high clusters in
Hillingdon, Hounslow and Enfield areas, which do not contain intensive vehicular-related activities, but does contain agricultural activities. This may indicate that REEs are probably derived from the use of phosphate fertilizers. In addition, the spatial patterns of other trace metals (Cu and Zn, see Fig. 8) that are also associated with phosphate fertilizer show the same high-high clusters as the LISA maps of Ce, La, Sc, Yb and Y, which points to P-fertilizer being the source.This is also supported by of the study of Nicholson et al (2003), which shows that phosphate fertilizers are an important source of heavy metals entering agricultural soils in England and Wales, especially Cu, Zn and Cd. This implies
that the spatial distribution patterns of REEs in farmland and wetland soils could be attributed to the application of phosphate fertilizers.
Fig. 8. LISA maps for (e) P2O5, (f) Cu, (g) Pb, (h) Zn (Distance Band = 1000 m).
4.2.2 Influences of industrial activities
Local Moran’s I index is sensitive to spatial outliers, especially to the high-value ones when used in highlighting potential contamination in environmental contamination studies (Zhang et al., 2008b). For soil REEs, some scattered High-high cluster and High-low outliers are found in areas of
Redbridge, Newham, Barking, Dagenham, and Rainham (see Fig. 2). This indicates that the REEs
concentration may be affected by scattered sources. Based on field investigation, some landfill, metal recycling and cement plants are located in these areas. According to other authors, leachate generated in waste landfill contains a high concentration of heavy metals, most commonly Fe, Cd, Cu, Zn and Ni (Elwali et al., 2008), and other trace elements (Aulin, 1998 and O¨ stman et al., 2006). The LISA maps of Cu, Pb, Zn and REEs show high value clusters in the vicinity of landfill, metal recycling and cement plants in the study area (see Fig. 8). This suggests that industrial and waste landfill may also be related to REEs enrichments. As already discussed in the case of Richmond Park, soil pH is also important in controlling translocation of exogenous REEs in the environment (Heinz et al., 1993 and Cao et al., 2001) as high pH increases the absorption of REEs, thus decreasing their mobility (Liang et al., 2013). As expected, the soil pH cluster map shows a clear high-high spatial cluster in Newham, Barking, Dagenham and Rainham area, and soil Cu, Fe and Zn have very similar spatial patterns, with hotspots located in the same areas (Fig. 8). This indicates that hotspots with high concentrations of
REEs in the Dagenham, Rainham, Redbridge and Barking could be attributed to the landfill, municipal dumps and small-scale metal recycling.
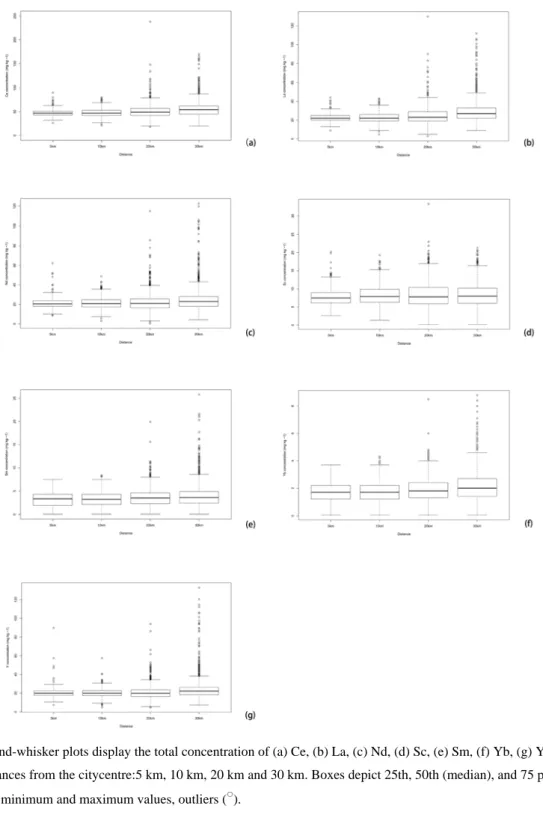
Fig. 9. Box-and-whisker plots display the total concentration of (a) Ce, (b) La, (c) Nd, (d) Sc, (e) Sm, (f) Yb, (g) Y related to different distances from the citycentre:5 km, 10 km, 20 km and 30 km. Boxes depict 25th, 50th (median), and 75 percentiles and whiskers minimum and maximum values, outliers (○).
4.2.3 Influences of vehicular emission
In the LISA maps of the 7 REEs, many scattered High-low outliers are found in central of London (see Fig. 2), especially Ce, La, Nd and Y. Because the REEs share similar chemical and physical properties they represent a geochemically coherent group, suggesting a similar source origin for these
trace metals. Moreover, it can be seen from the LISA maps of Cu, Pb and Zn that three metals displayed similar spatial patterns: relatively high-concentrated of high-high cluster in the central of city and low-low cluster around in rural area, decreasing with the increasing distance from the centre.
Nicholson et al (2003) reported that atmospheric Zn deposited on soil accounted for the largest amounts of metals from the atmosphere in England and Wales, followed by Cu and Pb. Similar patterns of these metals and REEs were evident(Fig. 2 and Fig. 8) indicated the strong influence of vehicular emission (Culbard et al., 1991; Manta et al., 2002). Additionally, London is one of the oldest industrialised cities in the world, which has undergone rapid economic development in past centuries. The increasing population and traffic volume in the city of London have inevitably caused an increase in local anthropogenic emission during the urbanization. Therefore, this study also employed the Box whisker plots of the Ce, La, Nd, Sc, Sm, Yb and Y in London soils. Based on the boxplots results, the total concentration of each REE was classified into four groups using a criteria value of rescaled distance between 5 and 10 Km from the centre of London to rural area (Fig. 9). These boxplots share a common trend: the soils at distance of 20 km and 30 km from the centre exhibited relatively high REEs concentrations. As mentioned earlier, REEs in the rural areas were strongly enriched by soil parent material rather than anthropogenic sources. However, it is interesting to note that soil samples within 10km distance from the centre contained a few high value outliers,especially, Ce, La, Nd and Y where a few high value outliers were found at distance of 5 km. Previous studies have suggested that Cu, Pb and Zn concentrations in the urban park soils may be related to the location and the history of parks(Li et al., 2001). (Huang et al., 1994) show that REE in exhaust fumes is derived from REE elements used in the catalytic converters of petrol engines. The Ce, La, Nd and Y of the soil samples within the central of London area show the large number of High-low outliers compared to the rest of the soils studied in more rural areas (Fig. 2). Therefore, our finding further indicated that vehicular emission may play a part, in addition to urbanization may contribute to Ce, La, Nd and Y in urban soils from the central area. While the above factors have been explored in this study, it needs to be noted that it still a difficult to establish a causal relationship between contamination hotspots and the influencing factors based on spatial distribution patterns (Volokh et al., 1990; Todorovsky, Minkova, and Bakalova, 1997).
5. Conclusions
This paper highlights the value of using Local Moran’s I for the identification of contamination hotspots in urban soils. The spatial patterns of Ce, La, Nd, Sc, Sm, Yb and Y in their distribution maps showed similar trends to the LISA maps revealed by Local Moran’s I. Moreover, this paper also highlights the influence of the factors controlling REE distribution and sources within urban soils. Soil parent material was an important factor leading to the natural enrichment in REEs of soils in the city of London with large scale spatial patterns. Based on previous research as well as the spatial
analyses of the study area, the results indicated that REEs enrichment in urban soil may have complex sources, the most likely factors are from the agricultural practices, waste disposal, metal recycling, vehicular emission and urbanization.
Acknowledgment
This study is sponsored by the Royal Society International Exchange Scheme of the UK (2015-2017). The soil data used in this study were provided by the British Geological Survey from the London Earth Project.
Appendix A. Supplementary data
The following is the supplementary data related to this article:
References
Abrahams, P.W., 2002. Soils: their implications to human health. Sci. Total Environ. 291(1-3), 1-32.
Anselin, L., 2001. Spatial effects in econometric practice in environmental and resource economics. Am. J. Agr. Econ. 83, 705-710.
Allen, M.A., Cave, M.R., Chenery, S.R.N., Gowing,C.J.B., Reeder, S., 2011. Sample preparation and inorganic analysis for urban geochemical survey soil and sediment samples. doi: 10. 1002/9780470670071. ch3.
Anselin L., 1995. Local indicators of spatial association — LISA. Geogr Anal; 27, 93–115.
Alessandro, G., Fabrizio, N., & Aurelio, G., 2009. Mineral chemistry and alteration of rare earth element (REE) carbonates from alkaline pegmatites of Mount Malosa, Malawi. Am. Mineral. Vol. 94, pp, 1216-1222.
Aulin, C., 1998. Transport, degradation and immobilisation processes in a landfill. In: Licentiate of Engineering Treatise. The Royal Institute of Technology, Stockholm, Sweden.
Benhaddya, M., Hadiel, M., 2014. Spatial distribution and contamination assessment of heavy metals in surface soils of Hassi Messaoud, Algeria. Environ. Earth. Sci. 71(3), 1473-1486.
Beckwith, R., Bulter, J., 1993. Aspects of the chemistry of soil organic matter. In soils, An Australian Viewpoint; Division of soils. CSIRO. Canberra, Australia, pp, 561-581.35. Soils,
an Australian viewpoint / sponsored by the Division of Soils, Commonwealth Scientific and Industrial Research Organization, Australia.
Brody, S.D., Highfield, W.E., Thornton, S., 2006. Planning at the urban fringe: an examination of the factors influencing nonconforming development patterns in southern Florida. Environ. Plan. B – Plan. Des. 33, 75–96.
BGS, 2011. London earth. (http://www.bgs.ac.uk/gbase/londonearth.html) (last accessed 11.02.13.)
Bradl, H.B., 2004. Adsorption of heavy metal ions on soils and soil constituents. J. Colloid Interface Sci. 277, 1-18.
Bear, F.E., 1964. Chemistry of the soil (2nd edition). Reinhold Publishing Corporation, New York, Amsterdam, London, pp, 80.
Beckwith, R., Bulter, J., 1993. Aspects of the chemistry of soil organic matter.In soils, An Australian Viewpoint; Division of soils. CSIRO. Canberra, Australia, pp, 561-581.35.
Buckingham, S., Maheswaran, J., Meehan, B., and Peverill, K., 1999. The role of applications of rare elements in enhancement of crop and pasture production. MSF, 315–317, 339–347.
Chua, S.Y., Sharma, S.C., 1998. An Investigation of the Effects of Prices and Exchange Rates on Trade Flows in East Asia. AEJ. Vol. 12(3), pp, 253-271.
Culbard E.B., Thornton I., Watt J., Wheatley M., Moorcroft S., Thompson M., 1991. Metal contamination in British urban dusts and soils. J. Environ. Qual. 17, 226-234.
Chen, Z.Y., 2005. Accumulation and toxicity of rare earth elements in bone and its toxicity and potential hazard to health. J. Ecol. Rural Environ. 24, 88-91.
Chen, Z.Y., Zhu, X.D., 2008. Accumulation of rare earth elements in bone and its toxicity and potential hazard to health. J. Ecol. Rural Environ. 24, 88-91.
Carrero, J. A., Arrizabalaga, I., Bustamante, J., Goienaga, N., Arana, G., & Madariaga, J. M. 2013. Diagnosing the traffic impact on roadside soils through a multianalytical data analysis of the concentration profiles of traffic-related elements. Sci. Total Environ. 458, 427–434.
Cao, X.D., Chen, Y., Wang, X.R., Deng, X.H., 2001. Effects of redox potential and pH value on there lease of rare earth elements from soil. Chemosphere, 44, 655-661.
Dong, W.M., Wang, X.K., Bian, X.Y., Wang, A.X., et al., 2001. Comparative study on sorption desorption of radioeuropium on alumina bentonite and red earth: effect of pH, ionic strength, fulvic acid, and iron oxides in red earth. Appl. Radiat. Isot. 54 (4), 603-610.
Dzubay T.G., Stevens R.K., Gordon G.E., Olmez I., Sheffield A.E., Courtney W.J., 1988. A composite receptor method applied to Philadelphia aerosol. Environ Sci Technol 22, 46-52.
Erecon, J., 2014. Europe’s rare earth dependence on China: future perspectives. EIAS Briefing Seminar, 2014-eias.org.
Elwali, B-EEAR., Yusoff, I., Samsudin, A.R., Yaacob, W.Z.W and Ghani, M.R.A., 2008. Heavy metal contamination of soil beneath a waste disposal site at Dengkil, Selangor, Malaysia. Soil Sediment Contam. 17, 449–466.
Feng, J., Zhang, H., Zhu, W.F., Liu, C.Q., Wu, D.S., 2000. Bio-effect of rare earths in the high background region I, some blood biochemical indices from population resided in light REE district. J. Rare Earth 18, 356-359.
Flight, D.M.A., Scheib, A.J., 2011. Soil geochemical baselines in UK urban centres: the G-BASE project. In: Johnson, C., Demetriades, A., Locutura, J., Ottesen, R.T. (Eds.). Mapping the chemical environment of urban areas. Wiley- Blackwell, Oxford, pp, 186-206.
Guo, G.H., Wu, F.C., Xie, F.Z., Zhang, R.Q., 2012. Spatial distribution and pollution assessment of heavy metals in urban soils from southwest China. J Environ Sci (China). 24(3), 410-418.
Goovaerts, P., 2000. Estimation or simulation of soil properties? An optimization problem with conflicting criteria. Geoderma. 97, 165e186.
Giusti, L., 2013. The chemistry and parent material of urban soils in Bristol (UK): implications for contaminated land assessment. Environ. Geochem. Health. Vol 35, Issue 1, pp, 53-67.
Gao, X.J., Zhang, S., and Wang, L.J., 1999b. The adsorption of La3þ and Yb3þ on soil and mineral and its environmental significance. China Environ. Sci.19 (2), 149–152.
Henderson, P., 1984. Rare earth element geochemistry. Developments in geochemistry, vol. 2 Elsevier, Amsterdam.
Harrison, R.M., Laxen, D.P.H., Wilson, S.J., 1981. Chemical associations of lead, cadmium. Copper and zinc in street dusts of Xi’an, Central China. Sci. Total Environ. 355(1-3), 176-186.
Husain, M.H., Dick, J., & Kaplan, Y., 1980. Rare earth pneumoconiosis. Occup. Med. 30, 15.
Hollriegl, V., Gonzalez-Estecha, M., Trasobares, E.M., Giussani, A., Oeh, U., Herraiz, M.A., Michalke, B., 2010. Measurement of cerium in human breast milk and blood samples. J. Trace. Elem. Med. Biol. 24, 193-199.
Hu, Z., Haneklaus, S., Sparovek, G., Schnug, E., 2006. Rare earth elements in soil. Commun. Soil Sci. Plant Anal. 37, 1381-1420.
Hu, Z., Haneklaus, S., Sparovek, G., 2006b. Rare earth elements in soils. Commun. Soil Sci. Plant Anal. 37 (9-10), 1381-1420.
Hu, Z.Y., Richter, H., Sparovek, G., and Schnug, E., 2004. Physiological and biochemical effects of rare earth elements on plants and their agricultural significance: a review. J. Plant Nutr. 27 (1), 183–219. Hancock, J.M., 1975. The petrology of the Chalk. Proc Geol Assoc. 86, 499–535.
Heinz, K. W., Robert, E.P. 1993. Acid extractable rare elements in Florida citrus soils and trees. Commu. Soil Sci. Plant Anal. 24, 2059-2068.
Huang, X.D., Olmez, I., Aras, N.K., 1994. Emissions of trace elements from motor vehicles: Potential marker elements and source composition profile. Atmos Environ. Vol 28, Issue 8, pp, 1385-1391. Ichihashi, H., Morita, H., Tatsukawa, R., 1992. Rare earth elements (REEs) in naturally grown plants in
relation to their variation in soils. Environ. Pollut. 76, 157-162.
Isaaks, E.H., & Srivastava, R.M., 1989. Applied Geostatistics. Oxford University Press, New York, 561 pp. Johnson, C.C., Breward, N., Ander, E.I., Ault, I., 2005. G-BASE: Baseline geochemical mapping of Great
Britain and Northern Ireland. Geochemistry: Exploration- Enviornment- Analysis 5, 1-13.
Johnson, C.C., 2011. Understanding the quality of chemical data from the urban environment- part 1: quality control procedures. In: Johnson, C., Demetriades, A., Locutura, J., Ottesen, R.T. (Eds.). Mapping the chemical environment of urban areas. Wiley-blakwell, Oxford, pp, 61-76.
Ketris, M., Yudovich, Y., 2009. Estimations of clarkes for carbonaceous biolithes: world averages for trace element contents in black shales and coals. Int J Coal Geol. 78(2), 135–148.
Knights, K.V., Scheib, C.J., 2010. London Earth: details of field campaigns across the Greater London area, 2005 to 2009, British Geological Survey Internal Report OR/09/056. British Geological Survey, Keyworth.
Liang, T., Zhang, S., Wang, L.J., Kung, H.T., Wang, Y.Q., Hu, A.T., Ding, S.M., 2005. Environmental biogeochemical behaviours of rare earth elements in soil-plant systems. Environ. Geochem. Health. 27, 301-311.
Liang, T., Li, K.X., Wang, L.Q., 2013. State of rare earth elements in different environmental components in mining areas of China. Springer Science. Environ. Monit. Assess. 186, 1499-1513.
Li, X.D., Poon, C.S., Liu, P.S., 2001. Heavy metal contamination of urban soils and street dusts in Hong Kong. Appl. Geochem. 16(11-12), 1361-1368.
Li, X., Huang, C., 2007. Environment impact of heavy metals on urban soil in the vicinity of industrial area of Baoji city, P.R. China. Environ. Geol. 52, 1631-1637.
Liu, Z., 1988. The effects of rare earth elements on growth of crops V. In: Pais. I. (Ed). Proc. Int. Symp. New results in the research of hardly known trace elements and their role in food chain. University of Horticulture and food industry. P. 23 (Budapest).
Lou, X.S., Yu, S., Zhu, Y.G., Li, X.D., 2012b. Trace metal contamination in urban soils of China. Sci. Total Environ, 421-422, 17-30.
Legret, M., Pagotto, C., 2006. Heavy metal deposition and soil pollution along two major rural highways. Environ. Technol. 27 (3), 247-254.
Liu, X., Wu, J., Xu, J., 2006. Characterizaing the risk assessment of heavy metals and sampling uncertainty analysis in paddy field by geostatistics and GIS. Environ. Pollut. 141, 257-264.
Leung, A.O.W., Duzgoren-aydin, N., Cheung, K.C., Wong, M., .2008. Heavy metals concentrations of surface dust from e-waste recycling and its human health implications in southeast China. Environ. Sci. Technol. 42(7), 2674–2680.
Lalor, G., Zhang, C.S., 2001. Multivariate outlier detection and remediation in geochemical databases. Sci. Total. Environ. 281, 99–109.
Liu, X., Wu, J., & Xu, J., 2006. Characterizaing the risk assessment of heavy metals and sampling uncertainty analysis in paddy field by geostatistics and GIS. Environ. Pollut. 141, 257-264.
Meharg, A.A., & Killham, K., 2003. A pre-industrial source of dioxins and furans. Nature, 421 (2003), pp, 909–910.
Mighall, T.M., Mighall, P.W., Abrahams, J.P. Grattan, D. Hayes, S. Timberlake, S. Forsyth., 2002. Geochemical evidence for atmospheric pollution derived from prehistoric copper mining at Copa Hill, Cwmystwyth, mid-Wales, UK. Sci. Total Environ. 292 (2002), pp, 69–80.
McGrath, D., Zhang C.S., 2003. Spatial distribution of soil organic carbon concentrations in grassland of Ireland. Appl Geochem, 18, 1629–39.
Mckinley J.M., Hron K., Grunsky E.C., Reimann C., Caritat P.DE., Filzmoser P., Van den Boogaart K.G., Tolosana-Delgado R., 2016. The single component geochemical map: Fact or fiction? J. Geochem. Explor.162. 16-28.
Mmolowa, K.B., Likuku, A.S., Gaboutloeloe, G.K., 2011. Assessment of heavy metal pollution in soils along major roadside areas in Botswana, African. J. Environ. Sci. Technol. 5 (3), 186e196.
Meza-Figueroa, D., De la O-Villanueva, M., De la Parra, M.L., 2007. Heavy metal distribution in dust from elementary schools in Hermosillo, Sonora, Mexico. Atmos. Environ. 41(2), 276-288.
Mareike, L., Christian, A., Peter, F., 2011. Rare earth elements and relation between their potential bioavailability and soil properties, Nidda catchment (Central Germany). Sci. Plant Soil. 349, 303-317. Martiya S., George A.M., Emmanuel J M C., Anna L., Madelen A., 2012. Rare earth element distribution
and mineralization in Sweden: An application of principal component analysis to FOREGS soil geochemistry. J. Geochem. Explor.
Manta D.S., Angelone M., Bellanca A., Neri R., Sprovieri M., 2002. Heavy metal in urban soils: a case study from the city of Palerme (Sicily), Itlaty. Sci. Total Environ. 300, 229-243.
Mizohata A., 1986. Rare earth element on airborne particles in motor-vehicle emissions. JOA Research 1, 274-283 (in Japanese).
Nicholson, F.A., Smith, S.R., Alloway, B.J et al., 2003. An inventory of heavy metal inputs to agricultural soils in England and Wales. Sci. Total Environ. 311, 205-219.
O¨stman, M., Wahlberg, O., A ˚ gren, S., Ma˚rtensson, A., 2006. Metal andorganic matter contents in a combined household and industrial landfill. Waste Manag. 26, 29–40.
Overmars, K.P., de Koning, G.H.J., Veldkamp, A., 2003. Spatial autocorrelation in multi-scale land use models. Ecol. Model. 164, 257-270.
Pang, X., Li, D., and Peng, A., 2002. Application of rare-earth elements in the agriculture of China and its environmental behavior in soil. Environ. Sci. Pollut. Res. 9 (2), 143–148.
Rashed, M.N., 2010. Monitoring of contaminated toxic and heavy metals, from mine tailings through age accumulation, in soil and some wild plants at Southeast Egypt. J. Hazard. Mater. 178(1-3), 739-746. Raghunath, R., Tripathi, R.M., Kumar, A.V., Sathe, A.P., Khandekar, R.N., Nambi, K.S., 1999. Assessment
of Pb, Cd, Cu, and Zn exposures of 6-to 10-year-old children in Mumbai. Environ. Res. 80(3), 215-221.
Rim, K.T., Koo, K.H., Park, J.S., 2013. Toxicological evaluations of rare earths and their health impacts to workers: a literature review. Saf. Health. Work. 4, 12-26.
Royse. K.R., & 10 coauthors., 2012. Geology of London, UK. Proceedings of the Geologists’ Association 123, 22-45.
Robinson, T., Metternicht, G., 2006. Testing the performance of spatial interpolation techniques for mapping soil properties. Comput. Electron. Agric. 50, 97–108.
Reimann C., Garrett R.G., 20050 Geochemical background-concept and reality. Sci. Total. Environ. 350, 12-27.
Salminen, S., Batista, M.J., Bidovec., et al., 2005. FOREGS Geochemical Atlas of Europe. Part 1. Background Information, Methodology, and Maps. Geological Survey of Finland, Espoo.
Shepard, D., 1964. A Two Dimensional Interpolation Function for Irregulallry Data Spaced, ACM Nat. Conf., pp. 517–524.
Szolnoki, Z., Farsang, A,m Puskas, I., 2013. Cumulative impacts of human activities urban garden soils: origin and accumulation of metals. Environ. Pollut. 177, 106-115.
Sneller, F.E.C., Kalf, D.F., Weltje. L., Van Wezel, A.P., 2000. Maximum permissible concentrations and negligible concentrations for rare earth elements (REEs). RIVM report 601501 011. National institute of public Health and the environment, the Netherlands.
Schulin, R., Curchod, F., Mondeshka, M., Daskalova, A., Keller, A., 2007. Heavy metal contamination along a soil transect in the vicinity of the iron smelter of Kremikovtzi (Bulgaria). Geoderma, 140, 52-61.
Schuhmacher, M., Meneses, M., Granero, S., Llobet, J.M., Domingo, J.L., 1997. Trace element pollution of soils collected near a municipal solid waste incinerator: human health risk. Bull. Environ. Contam. Toxicol. Dec. 59(6), 861-7.
Tiwari, C., & Rushton, G., 2010. A spatial analysis system for integrating data, methods and models on environmental risks and health outcomes. Trans GIS. 14, 177–195.
Tyler, G., 2004a. Rare earth elements in soil and plant systems- a review. Plant soil. 267 (1-2), 191-206. Todorovsky, D.S., Minkova, N.L., and Bakalova, D.P., 1997. Effect of the application of superphosphate on
rare earth content in the soils. Sci. Total. Environ. 203 (1), 13–16.
USEPA., 2012. Integrated Risk Information System (IRIS). National Center for Environmental Assessment, Office of Research and Development Washington DC.
Volokh, A.A., Gorbnov, A.V., Gundorina, S.F., and Revich, B.A., 1990. Phosphorusfertilizer production as a source of rare-earth elements pollution of the environment. Sci. Total Environ. 95, 141–148.
Wei, B., Li, Y., Li, H., Yu, J., Ye, B., Liang, T., 2013. Rare earth elements in human hair from a mining areas of rare-earth in South Jiangxi. Chin. Epidemiol. 24, 879-882.
Wang, X.S., Qin, Y., Sang, S.X., 2005. Accumulation and sources of heavy metals in urban topsoils: a case study from the city of Xuzhou, China. Environ. Geol. 48, 101-107.
Wackernagel, H., 1998. Multivariate Geostatistics: An Introduction with Applications. Springer-Verlag, Berlin. pp.
Wang L.Q., Liang T., 2014. Geochemical fractions of rare earth elements in soil around a mine tailing in Baotou, China. Sci rep-UK DOI: 10. 1038/srep12483.
Xing, G., Zhu, J., 2003. Chemistry of trace elements and rare earth elements in soils (in Chin.) [M]. Beijing: Scientific Press, 1.
Xu, X., Zhang, Y., Yekeen, T.A., Li, Y., Zhuang, B., Huo, X., 2013a. Increase male genital diseases morbidity linked to informal electronic waste recycling in Guiyu, China. Environ. Sci. Pollut. Res. 21, 3540–3545.
Xu, X., Yekeen, T.A., Liu, J., Zhuang, B., Li, W., Huo, X., 2013b. Chromium exposure among children froman electronic waste recycling town of China. Environ. Sci. Pollut. Res. Vol 22, Issue 3, pp, 1778-1785.
Yuan, Z.K., Liu, Y., Yu, H.Q., Zheng, H.L., Wang, N.F., Wu, M.K., Liu, Y.T., Yan, S.M., 2003. Study on relationship between rare earth level in blood and health condition of residents. Chin. Publ. Health 19, 133-135.
Yang, H., Huo, X., Yekeen, T.A., Zheng, Q., Zheng, M., Xu, X., 2013a. Effects of lead and cadmium exposure from electronic waste on child physical growth. Environ. Sci. Pollut. Res. 20, 4441–4447. Zhang, S., Shan, X., 2001. Speciation of rare earth elements in soil and accumulation by wheat with rare
earth fertilizer application. Environ. Pollut. 112, 395-405.
Zhang, Z., Pamela, H., 2016. Evaluation of accumulation and concentration of heavy metals in different urban roadside soil types in Miranda Park, Sydney. J Soils Sediments. 16, 2548.
Zhang, C.S., Tao, S., Yuan, G.P., Liu, S., 1995. Spatial autocorrelation analysis of trace element contents of soil in Tianjin plain area (in Chinese, with English abstract). Actapedol. Sin. 32, 50-57.
Zhang, C.S., McGrath, D., 2004. Geostatistical and GIS analyses on soil organic carbon concentrations in grassland of southeastern Ireland from two different periods. Geoderma. 119, 261-275.
Zhang, C. S., Lou, L., Xu, W., & Ledwith, V., 2008. Use of local Moran’s I and GIS to identify pollution hotspots of Pb in urban soils of Galway, Ireland. Sci. Total Environ. 398, 212-221.
Zhang, C.S., Frank, T.M., John, H., Jeffrey, N.G., 2005. Statistical characterization of a large geochemical database and effect of sample size. Appl. Geochem. Vol 20, Issue 10, pp, 1857-1874.
Zhu, J.G., and Xing, G.X., 1992a. Sequential extraction procedure for the speciation of REEs in soils. Soils (in Chinese), 24 (4): 215–218.
Zhu, J.G., Xing, G.X., Yamasaki, S., and Tsumura, A., 1993. Adsorption and desorption of exogenous rare earth elements in soils: I. Rate of forms of rare earth elements sorbed. Pedosphere. 3 (4), 299–308. Zhang, C. S., Lou, L., Xu, W., & Ledwith, V., 2008b. Use of local Moran’s I and GIS to identify pollution