NBER WORKING PAPER SERIES
CAPITAL FLOWS AND CONTROLS
IN BRAZIL: WHAT HAVE WE LEARNED?
Ilan Goldfajn
André Minella
Working Paper
11640
http://www.nber.org/papers/w11640
NATIONAL BUREAU OF ECONOMIC RESEARCH
1050 Massachusetts Avenue
Cambridge, MA 02138
September 2005
This paper is forthcoming in the NBER book "Capital Controls and Capital Flows in Emerging Economies:
Policies, Practices and Consequences", organized by Sebastian Edwards. We thank Edmar Bacha, Sebastian
Edwards, Tricia Kissinger and the participants in the International Capital Flows Conference and seminar
at IEPE-CdG of Brazil for useful comments, Fernando Rocha and Fernando Lemos of the Balance of
Payments Division of the Central Bank of Brazil (BCB) for valuable explanations of the Balance of Payments
statistics, Jose Maria de Carvalho, Maria do Socorro Reboucas and Luciana de Oliveira of the Exchange and
Foreign Capital Regulation Executive Office (Gence) of the BCB for precious and detailed comments on
capital control issues. We are also grateful to Érica Diniz Oliveira and Eurípedes de Freitas Neto for
excellent assistance with data. The views expressed here are those of the authors and not necessarily those
of the Central Bank of Brazil. Goldfajn: Partner, Gavea Investimentos and Pontifical Catholic University
of Rio de Janeiro (PUC-Rio). E-mails: [email protected] and [email protected].
Minella: Research Department, Central Bank of Brazil. E-mail: [email protected] The views
expressed herein are those of the author(s) and do not necessarily reflect the views of the National Bureau
of Economic Research.
©2005 by Ilan Goldfajn and André Minella. All rights reserved. Short sections of text, not to exceed two
paragraphs, may be quoted without explicit permission provided that full credit, including © notice, is given
to the source.
Capital Flows and Controls in Brazil: What Have We Learned?
Ilan Goldfajn and André Minella
NBER Working Paper No. 11640
September 2005
JEL No. F21, F32, F40
ABSTRACT
This paper analyzes the relationship between capital account liberalization and macroeconomic
volatility using Brazil as a case study. The paper provides several stylized facts regarding the
evolution of capital flows and controls in Brazil in the last three decades. We conclude that,
notwithstanding the financial crises and macroeconomic volatility of the recent past, capital account
liberalization and the floating exchange regime have led to a more resilient economy. Further
liberalization of the capital account is warranted and should be accompanied by a broad range of
reforms to improve and foster stronger institutions.
Ilan Goldfajn
Gávea Investimentos
Rua Dias Ferreira, 190 7
thandar
22431-050-Rio de Janeiro-RJ
BRAZIL
[email protected]
André Minella
Research Department
Central Bank of Brazil
SBS-Quadra 3-Bloco B-Edificio Sede- 9
thandar
70074-900-Brasília-DF
BRAZIL
1. Introduction
In the last few years, there has been a revival of the notion that capital controls
may be a necessary evil. The main argument is that, although capital controls may
introduce some economic distortions, excess capital mobility is partially responsible for
financial crises (and macroeconomic instability) in emerging market economies
(Stiglitz, 2002). Capital controls, goes the argument, provide emerging market
economies the means to prevent these unpleasant consequences. However, recent
papers (e.g., Edwards, 2005) have found no systematic evidence suggesting that
countries with higher capital mobility tend to have a higher incidence of crises.
Detailed case studies may provide evidence for this debate. The Brazilian case
provides an interesting example. Although Brazil still adopts a complex web of
bureaucratic controls on capital flows, in the last fifteen years it has been more
financially open than other large emerging market economies, in particular China and
India. The analysis of Brazil, a large sub-investment grade emerging market economy,
relatively integrated to the financial world and that has suffered both from financial
crises and macroeconomic volatility, could shed further light on the capital controls
issue. This paper details the experience of Brazil with capital mobility and controls.
Macroeconomic performance in Brazil has indeed been quite volatile over the
last 30 years. Part of this volatility can be traced to a sequence of financial crises,
sudden stops and a boom-and-bust pattern of current account deficits and capital flows.
Brazil experienced two large cycles of current account deficits, one in the 1970s that
lasted until the debt crisis of the early 1980s and the second in the 1990s, that ended
with an abrupt reversal of the current account deficit after the 2002 electoral crisis.
Currently, Brazil is running a current account surplus of almost 2% of GDP,
receiving approximately 2% of GDP in net foreign direct investment (FDI) and, for the
first time in decades, reducing its external debt. In this environment, one wonders
whether this performance is the sign of a new trend or the beginning of yet another
cycle that eventually will reverse course. The issue is whether a regime based on a
floating exchange rate, inflation targeting, fiscal responsibility and a relatively more
open financial account induced a structural change? It is difficult to judge at this point.
However, the combination of a few factors suggests a new trend. First, the floating
exchange rate regime is providing more incentives for borrowers to better assess risk, in
particular in the non-tradable sector. Second, exports are increasing in a magnitude not
seen before, leading to a record low ratio (still high by international comparison) of
external debt to exports. Third, the larger role of net direct investment in the latest surge
in capital flows is encouraging from a debt accumulation perspective. Nevertheless,
more analysis is needed. From an historical perspective, a relevant question is how does
the current phase compare to the previous adjustment undertaken after the debt crisis of
the 1980s? It is important to look at the past experience in Brazil.
In the last 15 years Brazil has also started liberalizing its capital account. The
liberalization was a gradual process of establishing new rules on capital inflows and
outflows. The result of the liberalization process was: (i) reduction or elimination of
taxes on foreign capital financial transactions as well as of minimum maturity
requirements on loans; (ii) elimination of quantitative restrictions on investments by
nonresidents in financial and capital markets securities either issued domestically or
abroad; (iii) permission for residents to issue securities abroad, including debt, without
prior approval by the Central Bank; (iv) more freedom for residents to invest in FDI and
portfolio abroad; and finally (v) introduction of currency convertibility initially through
the mechanism of “international transfers in reais,” whereby residents could transfer
their resources abroad through the use of nonresident accounts. Since March 2005 a
more direct procedure is in place.
In spite of the liberalization the resulting system does not mean unrestricted
freedom or free convertibility.
1Export proceeds still are required to be converted into
domestic currency (“exports surrender”) and there are limits on foreign currency
deposits. Current currency convertibility is based on monetary authority’s rules instead
of laws. Therefore, they can be lifted at any time. In addition, the public opinion still
associates transfers abroad with illicit or antipatriotic practices.
Also, notwithstanding
the efforts to consolidate the exchange and capital account rules, the regulation is still
fragmented and involves rules set in different contexts and driven by various
motivations.
A consolidation of the whole regulation in a unified law approved by Congress
is necessary. Reduction in bureaucratic requirements is needed as well. The rules would
become less uncertain and clearer. These changes would facilitate the change in
mentality, originated back in the capital flight period, when transfers abroad were
necessarily associated with illicit or antipatriotic practices.
The large volatility of capital flows has been one of the main arguments for
those that oppose complete liberalization of capital movements. Since liberalization in
Brazil has occurred in parallel to a period of higher macroeconomic volatility, one could
wonder whether the case of Brazil reinforces the argument. The key points of the paper
do not point in this direction:
i.
The debt accumulation pattern changed substantially after the
liberalization of the capital account and, especially, after the floating of the currency.
The private sector decreased significantly its issuance of external debt. The reduction in
private debt resulted partly from the abrupt interruption of access during the crises but
also from the floating of the currency, which ended a period of implicit guarantees that
included a fixed parity for borrowers;
ii.
The profile of external financing has also changed since liberalization
and the floating regime. After a period based on portfolio investment, FDI replaced it as
the main financing source. Since 1998, net direct investment has comprised more than
100% of the net private capital flows. In general, FDI flows tend to be more stable and
less correlated with the other flows. Long-term debt flows worked as a stabilizing factor
during external crises, but behaved pro-cyclically during domestic crises;
iii.
Net financial flows have, in general, financed current account deficits.
Some differences emerge over time. Net financial flows financed: i) a strong
accumulation of international reserves between 1992 and 1996; ii) a large expansion of
the current account deficit from 1995–1997, representing a growth of both investment
and consumption; and iii) an increase in the current account deficit from 1998–2001,
resulting from a higher deficit in net income from abroad;
iv.
Following capital account liberalization, consumption—its growth rate
and share in GDP—has been more stable than in the 1980s. In comparison to the 1990s
growth episodes, economic growth in 2000–2001 and at the present (2004) took place in
a different context. First, net capital flows have been of a lower magnitude and have
been dominated by FDI. There has been no significant surge of short-term flows or
portfolio investment. Second, the expansions have been accompanied by a more
favorable situation in the trade balance. Third, one could argue that fundamentals
improved with the change in the fiscal policy regime and the adoption of inflation
targeting;
v. Sudden stops are more pronounced when the crisis is mostly domestically
driven. Analysis using a vector autoregressive (VAR) estimation indicates that shocks to
the country risk premium (measured by the EMBI) have the clearest effect on
macroeconomic performance. Higher country risk levels induce greater interest rates, a
more depreciated exchange rate, a reduction in capital inflows, and lower output. This
lead us to the importance of building up good fundamentals in the economy.
These key points lead us to conclude that, notwithstanding the financial crises
and macroeconomic volatility of the recent past, capital account liberalization has led to
a more resilient economy. Therefore, further capital account liberalization should be
considered. Liberalization should be accompanied by a broad range of reforms to
improve and foster stronger institutions—such as approval of de jure central bank
independence (not only de facto)—establish a longer track record of responsible fiscal
policy (under the fiscal responsibility law) and reduce microeconomic inefficiencies and
contractual uncertainties.
This paper is organized as follows. The next section provides the balance of
payment stylized facts of the last three decades (current account cycles, capital flow
cycles and composition, and debt accumulation). Section 3 describes the evolution of
capital controls in Brazil and evaluates the benefits and costs of further capital account
liberalization. Section 4 examines the volatility of capital flows in general and the
behavior of the flows during financial crises. Section 5 analyzes the relationship
between capital flows and macroeconomic performance in Brazil, evaluating what
capital flows have financed, the recent growth pattern, and whether there is more
consumption smoothing. In addition, we conduct some estimations on the determinants
of capital flows and develop a structural VAR to estimate the relationship between
capital flows and macroeconomic performance. The final section presents the main
conclusions.
2. Stylized facts
Macroeconomic performance in Brazil has been volatile. Part of this volatility
can be traced to the boom-and-bust pattern in the balance of payments. In fact, there
have been long and pronounced cycles of current account deficits that ended abruptly.
Each cycle had its own history: different types of capital flows financed the boom,
sudden stops had different characteristics, and policy behavior was distinct.
Brazil is currently in a post-adjustment period, running both trade and current
account surpluses. How does the current phase compare to the previous adjustment after
the debt crisis?
This section provides the stylized facts of the main components of the balance of
payments in the last decades, starting with the current account cycles, but then focusing
on the capital flows, and the accumulation of external debt.
2.1. Current account cycles
In the last decades, Brazil experienced two large cycles of current account
deficits, one in the 1970s, which lasted until the debt crisis of early eighties, and the
second in the 1990s, punctuated by the crises of the last few years. Figure 1 shows the
behavior of the current account and “private capital account", defined as the capital and
financial accounts minus official-agency-related loans.
2These long periods of current
account deficits were financed by voluntary capital flows. The first period was also a
period of high average GDP growth, but this was not the case in the second period.
Tables 1 and 2 show annual values and period averages for broad categories of the
balance of payments as a percentage of GDP as well as for GDP growth rate.
2 See Appendix C for a more detailed explanation of the capital flows variables used in the text. The figures in the text are shown either as percentage of GDP or based on constant 2003 U.S. dollars.
The behavior of the current account has been, in general, dominated by the
dynamics of the trade balance, whose deficit cycles are financed by large expansions of
capital inflows. Figure 2 depicts the path of the trade balance and income balance (net
remittances abroad of wages, profits, dividends, and interests), which are the main
components of the current account.
3To analyze the current account performance in a broader macroeconomic
context, internationally as well as domestically, including the effect of policy decisions,
we subdivide the current account performance into five phases since the mid-1970s:
1974–1982: the second National Development Plan (II PND) and external debt
accumulation. The economy presented large trade deficits from 1974 through 1980—
averaging 1.6% of GDP—as a result of the heavy investments under the II PND and the
two oil price shocks (1973 and 1979). The current account deficit was also exacerbated
by the increase in U.S. interest rates in 1979. The deficits were financed basically by
syndicated loans, in the context of a large expansion of international financial market
liquidity. The external financing and investments under the II PND supported
maintenance of high economic growth—GDP growth average of 7.0% in the 1974–
1980 period—despite the oil crisis. The inflation rate was also increasing, rising from
15.5% in 1973 to 110.2% in 1980 (measured by IGP-DI—General Price Index).
However, external debt reached high unsustainable levels, leading to the 1982 external
debt crisis;
1983–1994: External debt renegotiation, current account adjustment, and high
inflation. With the interruption of voluntary capital flows, the economy had to generate
trade surpluses to finance the income account deficits. In fact, after the 1981–1983
adjustment—maxi-devaluation of the domestic currency and tightness of
macroeconomic policy—the economy generated large trade surpluses from 1983
through 1994 (averaging 4.0% of GDP). In 1984, the trade surplus peaked at 6.9% of
GDP. The current account balance stood around zero, except for the deficits at the end
of 1986 and beginning of 1987, as a result of the Cruzado Plan. GDP growth fell
3 Current account balance ≡ trade balance + balance of services + income balance + current transfers balance.
significantly, averaging 2.0% from 1983 through 1992, reaching negative values in four
of these years. It was also a period of high inflation, which peaked at 82.4% per month
in March 1990 and 47.4% in June 1994 (measured by IPCA—Broad National
Consumer Price Index). Several stabilization programs tried to curb inflation, but
achieved only temporary success. The end of the high inflation period came with the
Real Plan, launched in July 1994. The process of external debt renegotiation underwent
several phases, eventually concluding with the conversion of the loans into debt
securities under the Brady Plan in April 1994.
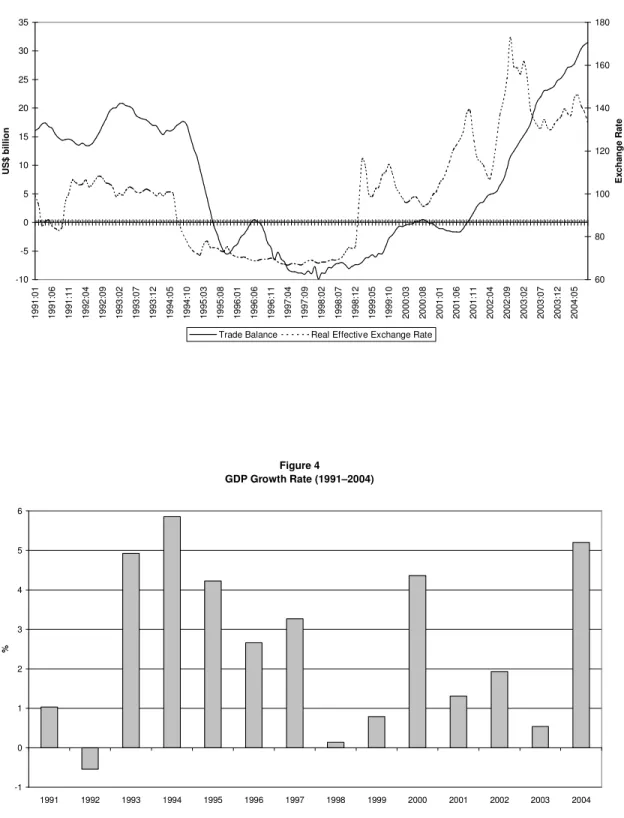
4From 1992 through mid-1994, exchange
rate policy, under a managed system, basically aimed to keep constant the purchasing
power of the domestic currency, as we can see in Figure 3, which shows the real
effective exchange rate and the trade balance;
1995–1998: New cycle of trade deficits, low inflation, and financial crises. The
revival of capital flows to emerging market economies at the beginning of the 1990s,
the regulation changes in the capital account, and the external debt restructuring ended
the external financing restrictions of the 1980s. Moreover, for the first time in more than
three decades, the economy enjoyed a low-inflation environment. In 1995, inflation fell
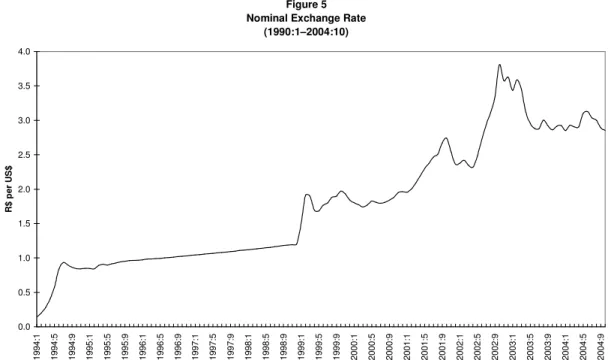
to 22.4%, and in 1998 reached 1.7%. The stability brought by the Real Plan was also
accompanied by a relatively short economic growth cycle, as depicted in Figure 4. In
the initial months after the launch of the Real Plan, a floating system was adopted,
followed the following year by a crawling band, which increasingly turned into a
crawling peg. Figure 5 shows the steady and low rate of adjustment in the nominal
exchange rate, which led to a substantial appreciation of the real effective rate (Figure
3). As a consequence of the surge in capital inflows, exchange rate overvaluation, and
higher economic growth, large trade deficits emerged from 1995 through 1998 (average
of 0.7% of GDP, which is a value largely underestimated by the increase in
dollar-denominated GDP resulting from the exchange rate overvaluation). The capital inflows
that financed the deficits were predominantly portfolio investment (equity and debt
securities), mainly until 1996–1997, when foreign direct investment started to assume
greater significance. The economy was hit by external financial crises (Mexican, Asian
4 In 1991, Brazilian government and the creditor private banks committee renegotiated the delayed interest payments of 1989 and 1990, and, in the following year, agreed on a term sheet that set some principles for the negotiation. At end-1993, a final agreement was reached, under the guidelines of the Brady Plan, by which the loans were converted into sovereign bonds, some of them having U.S. Treasury bonds as collateral. The conversion occurred in April 1994. For an institutional description of the process of renegotiation, see Cerqueira (2003).
and Russian) and faced the domestic exchange crisis in 1998, which ended with the
collapse of the exchange regime in January 1999;
1999–2001: Floating exchange system, inflation targeting, sound fiscal policy,
and reversal of trade balance deficits. Economic policy had to deal with the exchange
rate crisis and undertake a substantial change in the fiscal regime. A floating exchange
rate system and an inflation-targeting regime were adopted, and substantial primary
surpluses generated. Public sector primary surplus rose from 0.0% of GDP in 1998 to
3.2% in the following year, reaching 4.4% in 2003. The exchange rate depreciated from
R$/US$ 1.22 in mid-January 1999 to R$/US$ 2.16 at the beginning of March. In June
1999, inflation targets were announced for that year and the following two years. It was
a period of transition in terms of current account adjustment. The trade deficit fell from
0.8% of GDP in 1998 to 0.2% in 1999, turning into a surplus of 0.5% in 2001;
2002–to the present: Confidence crisis and large current account adjustment.
Throughout 2002, with the electoral uncertainties, the economy faced a confidence
crisis. Country risk premiums and the exchange rate rose sharply. After the transition of
the prior years, large trade surpluses solidified from 2002 onward. The surpluses are a
consequence of significant exchange rate depreciation, strong world economic growth,
and a few specific bilateral trade agreements. In 2003 and 2004, the trade surplus
reached 5.0% and 5.6% of GDP (US$ 24.8 billion and US$ 33.7 billion), respectively,
leading to a current account surplus of 0.8% and 1.9% of GDP. The positive results in
the trade balance have been accompanied by both export and import growth. In 2004,
exports and imports reached US$ 96.5 billion and US$ 62.8 billion, respectively,
representing an increase of 32.0% and 30.0% in relation to the previous year. In fact, as
we can see in Figure 6, the degree of trade openness of the economy—measured by the
ratio of exports plus imports to GDP—has reached the record level of 26.5%, in sharp
contrast to a 14.0% average in the 1990s.
Therefore, Brazil is currently in a post-adjustment period, running both trade and
current account surpluses. How does the current phase compare to the previous
adjustment after the debt crisis? In both cases, there was a strong reversion of the trade
deficit cycle. The trade balance rose from -1.2% of GDP in 1980 to 6.9% in 1984, and
from -0.8% in 1998 to 5.6% in 2004. Similarly, the trade adjustment was stimulated by
a substantial exchange rate devaluation, which simultaneously generated significant
inflationary pressures. However, the two adjustments present some important
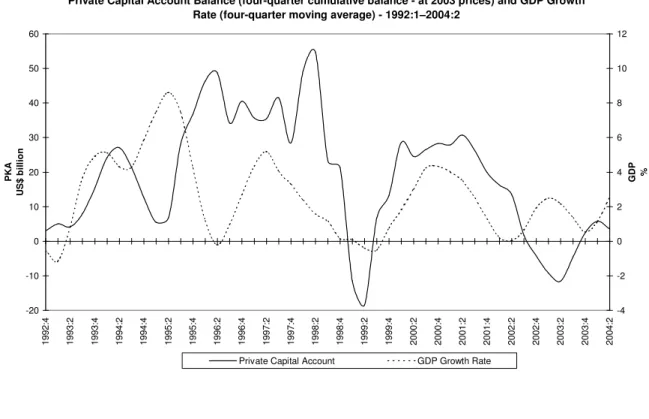
differences. First, the economic slowdown in the 1980s adjustment was substantially
higher than in the 2000s. GDP accumulated a contraction of 6.3% in the 1981–1983
period. In the recent adjustment, the higher troughs, considering four-quarter cumulative
GDP, were of -0.5% in 1999:3, 0.0% in 2002:2, and 0.5% in 2003:4. Second, the
exchange rate movement was higher in the recent adjustment. The real effective
exchange rate rose by 35% in the months following the maxi-devaluation of February
1983 in comparison to the previous months. In 1999, the increase was around 47%, and
accumulated 66% until 2001. Third, the 1980s adjustment affected imports more
intensely than exports. In 1984, imports fell by 39.4% relative to 1980, while exports
increased 34.1%. The reduction in imports accounted for 56.8% of the change in the
trade balance. In contrast, the recent adjustment has been incurred mainly by exports. In
relation to 1998, exports grew 42.9% and 88.6% in 2003 and 2004, respectively, and
imports fell by 16.3% in 2003 and grew by 8.8% in the following year. As a
consequence, although also reflecting changes in dollar-denominated GDP, the increase
in the degree of openness has been substantially higher recently. Exports plus imports as
a percentage of GDP rose from 18.1% to 21.6% between 1980 and 1984, whereas it
went from 13.8% in 1998 to 26.5% in 2004. Fourth, in the 1980s, the country was
excluded from international capital flows, whereas, since the 1990s, it has been
integrated in the financial markets. Fifth, the level of import tariffs is lower currently
than in the 1980s. Sixth, macroeconomic regimes are completely different: low
inflation, sound fiscal policy and better monetary institutions in the 2000s versus high
inflation, unsound fiscal policy and weak monetary institutions in the 1980s.
Although the trade balance has played the main role in the current account
boom-and-bust cycles, the income balance has undergone important changes as well.
Since 1998, the income deficit has reached a higher level (1998–2003 annual average of
3.4% of GDP), as a result of the surge in capital inflows, which increased
nonresident-owned assets in the economy. As a consequence of the external debt conversion under
the Brady Plan and the change in the pattern of capital inflows—from loans to direct
and portfolio investment—the composition of the income balance has changed
significantly since the 1990s, as we can see in Figure 7. The deficit in portfolio
investment income, rather than the deficit in other investments income, has become the
main component since 1997, accounting for 46.8% of the investment income deficit
from 2000 through 2003. The share of the income deficit attributable to direct
investments rose to 22.6%, whereas the share of the deficit attributable to other
investments income decreased to 30.6%.
2.2. Capital flows cycles and their composition
Although current account cycles have a corresponding capital flow financing, it
is not necessarily the case that capital flows behave in the same manner in each cycle. In
fact, there are major differences in the composition of capital flows across the current
account cycles—private versus public, portfolio or FDI—that we opted to subdivide the
capital flow behavior into three longer periods (instead of the five above). We detail the
methodological decomposition of capital flows into six categories in Appendix C.
Figures 8 and 9 show the path of the main categories.
1970s–1982: Loan flows and external debt accumulation. In the context of a
significant liquidity expansion in international financial markets, Brazil received
massive capital inflows. Table 3 shows, for each period, the average of different flows
(as a percent of GDP). The private capital account balance averaged 3.8% of GDP from
1974 through 1982. As recorded in Figure 9, the majority of capital inflows were loans,
comprising 74.3% of the private capital balance. In contrast, portfolio investment was
minimal (a 5.4% share in the flows). As a result, gross external debt, as a percentage of
GDP, from 16.8% in 1970, reached 31.5% in 1982, and peaked at 53.8% in 1984 (new
flows in the context of debt renegotiation, and maxi-devaluation of domestic currency
reducing dollar-denominated GDP);
1983–1991: Shortage of capital flows. The external debt crisis and debt
renegotiation—extended until 1994—dominated the period. The scarce capital flows
were basically part of debt renegotiation. The private account balance averaged 1.7% of
GDP in the period (declining to 1.0% when excluding 1983–1984). In 1983 and 1984,
the country still received positive loan flows, but under the debt renegotiation. In fact,
the loan flows balance remained negative for one decade (1985–1994). Likewise, the
negligible positive portfolio investment turned into (negligible) negative flows. Net
direct investment was affected as well. As a percentage of GDP, they fell from 0.6% of
GDP, in the previous period, to 0.2%;
1992–to the present: Financial openness, reintegration in the international
financial markets, and large swings of capital flows. The country was reintegrated into
cross-border flows. The resumption of capital flows to Brazil was associated with
several factors: i) increase in international liquidity and expansion of pension and hedge
funds; ii) the process of capital account liberalization; iii) high yield differentials
between domestic and foreign bonds; iv) the end of the external debt restructuring
period; and v) higher macroeconomic stability with the launch of the Real Plan. The
three main characteristics of capital flows in this period were the following: i) important
role played by portfolio investment; ii) large swings in capital flows ("sudden stop
crises"); and iii) increasing role of foreign direct investment.
The resumption of capital flows was dominated by portfolio investment.
5Except
for brief pauses during the Mexican and Asian crises, portfolio inflows increased
systematically and reached a four-quarter cumulative average of US$ 20 billion between
1996 and mid-1998. Portfolio investment accounted for 73.0% of the private capital
account balance between 1992 and 1998, averaging 2.3% of GDP. In general, debt
securities flows were larger than equity flows. The expansion of debt securities was
reinforced by the return of the government to the international financial markets after
the debt restructuring, with the first issuance of sovereign bonds taking place in
mid-1995.
Portfolio investment also played an important role in the large capital flow
swings associated with the financial crises, more intensely in the domestic crises
(exchange crisis in 1998–1999 and confidence crisis in 2002). The net portfolio balance
amounted to US$ -11.2 billion from 1998:3 through 1999:1, and to US$ -7.6 billion in
the last three quarters of 2002.
5 The category portfolio investment follows IMF's definition. It is represented by cross-border investment in equity securities that is not classified as direct investment, and debt securities. This category includes securities negotiated in Brazil and abroad
The other component that played a key role during the sudden stop crises was
"other short-term assets". These flows are, in general, negative because they basically
refer to transfers of domestic currency abroad. Similar to portfolio investment, the main
negative peaks of this group were associated with the financial crises. The higher trough
took place in the exchange crisis, when its negative balance summed to US$ -15.2
billion in the last three quarters of 1998. These outflows were associated with growing
doubts about the sustainability of the exchange rate regime, and the corresponding
expectations of currency devaluation. It was a way of protecting asset values in terms of
foreign currency and having capital gains in terms of domestic currency. For those who
had issued foreign-currency denominated or linked debt, it represented a way of
hedging against prospective devaluation. After the devaluation in January 1999, these
outflows fell significantly and were increasingly lower, except during the confidence
crisis, when they reached a balance of US$ -5.6 billion in the last three quarters of 2002.
The main change in the profile of capital flows in the second half of the 1990s
was the increasing role played by foreign direct investment. In fact, since 1998, net
direct investment has become the main inflow group. These inflows followed a cycle of
expansion, from mid-1990s through 2002, peaking in 1999 and 2000. The expansion
was stimulated by the improvement in domestic macroeconomic conditions with the
Real Plan, the lifting of restrictions on foreign investments in some sectors, and the
wave of privatizations. The change to a low-inflation environment has reduced the level
of uncertainty in the economy and ended the distortions brought about by high inflation.
Furthermore, the passage to a more solid macroeconomic regime in 1999 has built a
better economic environment.
Privatization was not, however, the main component of net foreign direct
investment (Figure 10). From 1997 through 2000, privatizations accounted for 25.0% of
net FDI. These data, however, tend to underestimate the contribution of privatization
because they do not include additional capital inflows in the form of investment
following privatization. In spite of the reduction in FDI, the levels have been relatively
high. Net FDI stood at US$ 10.1 billion and US$ 18.2 billion in 2003 and 2004,
representing 2.1% and 3.0% of GDP, respectively.
6Therefore, in recent years, the
pattern of external financing has shifted from debt inflows to direct investment.
Moreover, as we can see in Figure 8, net direct investment was much less affected than
the other components during the crises.
Flows related to official agencies have demonstrated large increases when there
was a sharp reduction in private capital flows, working clearly as “compensatory
flows”. Figure 11 shows the balance of the private capital account and the
official-agency-related loans. The role of these flows is evident during both domestic crises.
Between 2002:2 and 2003:3, net credits from the IMF reached US$ 22.7 billion (a gross
credit of US$ 33.6 billion). The correlation coefficient between the two groups is -0.17
(1992:2–2004:2).
Using the definition of short- and long-term flows described in Appendix C,
Figure 12 shows that short-term debt flows were preponderant between 1993 and 1996,
and were clearly affected by the crises. Long-term debt flows, in turn, fell significantly
during the domestic crises. Therefore, it seems that short-term flows were more
sensitive to contagion crises than long-term flows, but the latter did not work as a factor
of stability during domestic crises.
2.3. The stocks: has the accumulation of external debt been halted?
The revival of capital flows to Brazil was accompanied by an increase in
external debt, mainly in the second half of the 1990s. Figure 13 shows gross and net
external debt as a proportion of GDP.
7This ratio, however, is largely affected by the
effect of exchange rate variations on GDP measured in dollars. Considering the debt
level at constant prices, Figure 14 shows the path of both public and private external
debt.
The debt accumulation in the second half of the 1990s was primarily undertaken
by the private sector. The lower interest rates on external debt relative to domestic debt,
the stability of the exchange rate, and the associated implicit guarantee of exchange rate
system continuity worked as important stimuli for the issuance of external debt, in the
7 Net external debt is obtained subtracting reserves, commercial banks' assets, and Brazilian credits abroad from gross debt.
context of abundant international liquidity. Private external debt was rapidly increasing
between 1992 and 1998, rising from US$ 21.9 billion to US$ 112.3 billion. As a
consequence, the share of private sector debt in total external debt rose from 17.0% to
50.2%.
The debt accumulation pattern has changed substantially after the float and large
depreciation of the currency. The private sector significantly decreased its issuance of
external debt, leading to a strong decline in private external debt, from US$ 111.6
billion in 2000 to US$ 71.7 billion in September 2004. The reduction in private debt
resulted partly from the abrupt termination of access during the crises, but also from the
increased uncertainty that a floating exchange regime introduces to borrowers. For
agents that do not have dollar revenues, it is highly risky to issue foreign currency debt.
Thus, the trend is for firms in the non-tradable sector to repay their debts.
The public sector has also changed its behavior after the float of the currency.
Brazil returned to issue sovereign bonds in 1995, but, since 1998, issuance of public
external debt has been dominated by compensatory flows. After a downward trend until
1997, the growth of public sector debt resumed during the crises under IMF programs.
IMF debt rose from nearly zero in 1997 to US$ 8.8 billion in 1999, falling back in the
following year with the repayments. However, in the subsequent programs, debt owed
to the IMF debt resumed an upward trend, peaking at US$ 33.5 billion in the third
quarter of 2003. Between end-2000 and the third quarter of 2003, IMF accounted for
90.1% of the US$ 35.2 billion increase in public external debt. The latest repayments to
the IMF in 2004 have reduced total public sector debt by US$ 9.3 billion between the
third quarters of 2003 and 2004. Overall, private debt was partly replaced by public
debt.
In the aggregate, however, the total external debt level has been decreasing since
2000. After peaking around US$ 225 billion in 1998–1999, it reached US$ 202.2 billion
in September 2004. As a proportion of GDP, after reaching 45.9% of GDP in 2002, total
external debt decreased to 34.9% in September 2004. The
net-external-debt-ratio-to-GDP fell from 35.9% to 24.9% in the same period.
With the large expansion in exports in recent years, the ratio of gross external
debt to 12-month-exports has declined substantially, as we can see in Figure 15,
reaching 2.2 in September 2004, the lowest value in the last thirty years, and 1.6 when
considering net debt. Likewise, the proportion of interest payments to exports has
declined steadily. It reached 15.9% in September 2004, which also represents one of the
lowest values in the last three decades, as recorded in Figure 16.
One wonders whether the remarkable decrease in debt since 2000 is the sign of a
new trend or the beginning of yet another cycle that eventually will reverse its course. It
is difficult to judge at this point. However, the combination of a few factors suggests a
new trend. First, more incentives are being provided by the floating regime for
borrowers to better assess risk, in particular in the nontradable sector. Second, exports
are increasing in a magnitude not seen before, leading to a record low ratio (although
still high by international comparison) of external debt to exports. Third, the larger role
provided by net direct investment in the latest surge in capital flows is encouraging from
a debt accumulation perspective.
3. Capital controls
During the 1990s, Brazil liberalized its capital account, in parallel to the process
of trade liberalization and the surge in capital inflows. The capital account liberalization
was a gradual process of establishing new rules on capital inflows and outflows. Figure
17 shows an index of capital control estimated for 1990–2004: the lower the index the
more liberalized is the capital account.
8The list of liberalization measures is vast,
mostly adopted in the first half of the decade. Appendix A shows the current major
restrictions, and Appendix B presents a chronology of the main changes in capital
account regulation in the 1990–2004 period.
The result of the liberalization process was the following: (i) reduction or
elimination of taxes on foreign capital financial transactions as well as of minimum
maturity requirements on loans; (ii) elimination of quantitative restrictions on
investments by nonresidents in financial and capital markets securities issued
8 The index was elaborated using the chronology in Appendix B. We have normalized December 1999 equal to 100, and assigned -1 to each liberalizing measure and +1 to each restrictive one.
domestically or abroad; (iii) permission for residents to issue securities abroad,
including debt, without prior approval by the Central Bank; (iv) more freedom for
residents to invest in FDI and portfolio abroad; and finally (v) introduction of currency
convertibility through the mechanism of “international transfers in reais,” whereby
residents could transfer their resources abroad through the use of nonresident accounts.
Since March 2005, a more direct procedure is in place.
This liberalization process occurred, however, without the necessary changes in
the overall legislation. Each new liberalizing rule was inserted at the margin of the
existing legislative framework resulting in a complex web of regulations. The present
set of regulations comprises different types of rules (laws, decree-laws, resolutions,
memos, etc.) established in different contexts and driven by diverse motivations.
The existing legislative framework dates back as early as the 1930s. It was
originally based on less liberal principles and was implemented before financial
integration was an important consideration. The most important pillar of the existing
legislation is that the domestic currency is the only legal tender; i.e., payments in
foreign currency are not allowed.
9Moreover, banking deposits in foreign currency are
usually not allowed.
10The second pillar is that export proceeds are required to be
converted into domestic currency (“exports surrender”).
11Furthermore, the netting of
payments is not allowed, e.g., exporters cannot use their proceeds to pay for an import
or an external debt before converting them into domestic currency.
12However, the most important pieces of capital flow legislation were introduced
in the 1960s
13to regulate foreign direct investment and loans. According to that
regulation, foreign capital inflows should be registered (and income tax paid) in order to
obtain permission for associated outflows (profits, interests, royalties, and repatriation).
9 Decree 23,501, 11.27.33, replaced by Decree-Law 857, 9.11.69 (the exception was given for some cases, such as contracts related to imports and exports, exchange contracts, and debt involving nonresidents as creditor or debtor). Law 10,192, 2.14.01 (previously Provisory Measure 1,053, 6.30.95), reaffirmed those restrictions, making also clear the restriction involves indexation to a foreign currency. 10 There are few exceptions. Currently, foreign currency deposits are allowed for embassies, international organisms, oil and electric energy companies, insurance companies, institutions operating in the floating exchange market, foreigners temporarily in Brazil, Brazilians living abroad, Brazilian Postal Service Company (ECT), and foreign cargo companies.
11 Decree 23,258, 10.19.33. 12 Decree-Law 9,025, 2.27.46.
This basic legislation has remained in place without major changes.
14The legislation
also sets the grounds for the existence of two separate exchange markets.
The 1960s legislation was enacted in the context of the Bretton Woods system
when private capital flows were scarce and dominated by direct investment.
Domestically, financial markets were underdeveloped, currency was weak—reflecting
the effects of inflation—and import substitution policies at their peak. The basic idea
was to control and limit currency convertibility. Access to foreign currency should be
restricted to imports—heavily taxed—and remittances, within certain limits, should be
associated with previous registered inflows. This legislation survived the next couple of
decades when the scenario was dominated by the debt crisis and unstable
macroeconomy.
Nevertheless, the strong capital controls system did not prevent capital flight.
The “parallel” (or black) exchange market gained importance. The exchange rate spread
over the official exchange rate averaged 40% over the 1980s, peaking at 170% in May
1989.
15The high spread of the exchange rate over the official market encouraged import
overinvoicing and export underinvoicing. Even individuals that traveled abroad had to
resort to the (illegal) parallel market because of the extremely low limits of foreign
currency that they were allowed to buy in the official market.
The first change in the regulation occurred in 1987 when portfolio inflows were
allowed through the establishment of foreign capital investment companies, foreign
capital investment funds, and stock and bond portfolios (the so-called Annexes I to III).
Other changes followed. An important reference point was the liberalization of
the securities market to foreign institutional investors in 1991, with the so-called Annex
IV. Other important measures that stimulated foreign capital flows at the beginning of
the 1990s were the following: i) reduction in the tax on remittances abroad of profits
and dividends; ii) authorization for conversion of external debt instruments of the
federal public sector, bonds, and deposits denominated in foreign currency for use in the
National Privatization Program; iii) authorization for foreign investors represented by
14 The main changes were the end of restrictions on investments in some sectors and lower tax burden. 15 Ipeadata.
funds, investment companies, and institutional investors to operate in the options and
futures markets for securities, exchange, and interest rates; and iv) authorization for the
issuance abroad of convertible debentures and of Depository Receipts representing
Brazilian securities, such as the American Depositary Receipts (ADRs).
The creation of the "floating exchange rate market"—also called "dollar-tourism
market"—at end-1988, alongside the “commercial or free exchange rate market”, was
another important reference point in the process of capital account liberalization. The
goal was to bring exchange operations that were conducted in the "parallel market" into
a regulated market.
16Increasingly, the regulation broadened the operations that could go
through the new market. As a consequence, the parallel market lost its economic
significance, as reflected in the spread, which decreased significantly, averaging 14%
and 4% in the first and second halves of the 1990s. The rates in the floating and free
exchange markets were aligned in 1996, and the markets in practice unified in 1999.
17The floating exchange rate market allowed further liberalization of residents
outflows. The main change was to broaden the possibility of conversion of domestic
into foreign currency through the nonresident accounts (the so-called CC5 accounts),
starting at the end of 1988 and further developed in the following decade.
18The 1960s
legislation determines that nonresidents could transfer abroad, regardless of any
authorization, the balance not withdrawn coming from foreign exchange sales or money
orders in foreign currency. However, it did not establish what would happen to
resources from other sources. At the end of the 1980s and beginning of the 1990s, the
central bank extended the possibility of transferring abroad, giving a "general and public
authorization" for transfers from nonresident financial institutions, as pointed out in
Banco Central do Brasil (1993), an important official text that clarified the changes in
the exchange regime. Any transfers above US$ 10,000.00 (afterwards changed to R$
10,000.00), however, should be identified and registered in the Central Bank
Information System (Sisbacen).
16 Banco Central do Brasil (1993). 17 Resolution 2,588, 1.25.99.
This transfer mechanism through the nonresident account was named
"international transfers in reais" (TIR). In practice, residents in Brazil could deposit in a
nonresident bank’s account held in a domestic bank, that could convert domestic into
foreign currency. In other words, residents could transfer money abroad making these
deposits and asking the nonresident financial institution to buy foreign currency to make
the deposit in an account abroad.
19This mechanism has represented a crucial change in
the capital account regulation: from a system based on strict limits to currency
conversion—restricted only to nonresidents and outflows related to previous inflows—
to a much broader scope, extended in practice also to residents. As stressed in Franco
and Pinho-Neto (2004), this rule represented the introduction of de facto convertibility.
Convertibility was enhanced by the authorization for non-financial resident firms
to invest abroad up to US$ 1 million each twelve months—later expanded to US$ 5
million—without prior authorization. When above this limit, investors should provide
information to the Central Bank 30 days ahead of the exchange transaction.
20These
investments were conducted in the floating exchange rate market.
21From 1993 to 1996, however, capital inflows reached levels that prompted the
monetary authorities to adopt restrictive measures,
22some of them temporarily relaxed
after the Mexican crisis. The vast liquidity in international markets, the more open
capital account and the interest differential between domestic and foreign interest rates
23led to a surge of capital inflows that pressured the exchange rate and the money market.
In fact, the restrictive measures were motivated by concerns regarding the amount of
sterilization operations—with their fiscal cost associated with the yield differentials—
and the short-term tenor of a significant portion of the inflows.
The restrictive measures involved quantitative and price-based measures, which
constantly evolved as market participants found ways to circumvent them, as shown in
19 For a more recent explanation of the international transfers in reais, see Schwartsman (2004). 20 See section “Brazilian capital abroad” in Appendix B for more details.
21 From 1988 through 1992, Brazilian investment abroad was required to be compensated by a sale to the Central Bank of gold bought in the domestic market for a value equivalent to the investment.
22 See Ariyoshi et al. (2000), Cardoso and Goldfajn (1998), Garcia and Barcinski (1998), and Garcia and Valpassos (1998).
23 Cardoso and Goldfajn (1998) and Garcia and Barcinski (1998) have shown that capital flows to Brazil responded to interest rate differentials. Our estimations also provide evidence that domestic interest rates have stimulated capital flows.
Garcia and Valpassos (1998) and Carvalho (2005).
24The regulatory changes
discouraging capital inflows included: i) increase in the financial transaction tax on
capital inflows, in particular for shorter term flows; ii) increases in the minimum
maturity requirements for capital inflows; and iii) further quantitative restrictions on
several portfolio investment instruments. For example, foreign investment under
Annexes I to IV was prohibited to channel resources to fixed-yield bonds and
debentures (although partially compensated by the creation of specific foreign capital
fixed-income funds—FRF-CE). These prohibitions were gradually expanded over the
period 1993–1995, with successive measures restricting investment in derivatives
markets—unless as an explicit hedge of existing contracts—certificates of privatization
and related securities, Financial Investment Funds (FAF), futures and options markets,
and finally other specific debt securities.
Measures aimed to stimulate outflows, such as the permission for prepayment of
foreign borrowing and import financing, were also adopted. New channels for Brazilian
investment abroad were established, such as the Brazilian Depositary Receipts (BDRs)
regulation, which allows residents to purchase securities of nonresident companies in
Brazil, or the creation of Foreign Investment Funds, which facilitates purchases of debt
securities by residents in international markets.
The measures easing outflows make it clear that the overall objective was to
reduce net inflows without affecting the trend towards greater integration with
international financial markets. In fact, the restrictive measures did not reverse the
liberalization trend, but represented a “cycle” of restrictions around that trend, as we can
see in Figure 17. Furthermore, Figure 18 decomposes the index into controls on
outflows and inflows, showing that the focus of the measures was inflows.
The restrictive capital inflow measures did not involve foreign direct investment.
On the contrary, the liberalization trend continued through the mid-1990s. The
constitutional distinction between Brazilian firms—licensed under Brazilian laws and
with headquarters and administration in the country—and Brazilian firms of national
capital—restricted to those under control of residents—were removed. Likewise, new
opportunities for investment in public utilities were opened with the Concession Law, as
well as with the increase in the ceiling for nonresidents’ ownership of financial
institutions. Moreover, the income tax on remittance of profits and dividends abroad
was removed.
The motivation for the restrictions adopted in this period stands in sharp contrast
to that of the 1960s legislation. The latter was established in the context of a scarcity of
foreign resources in order to prevent capital outflows—the so-called capital flight. The
objective was to restrict currency convertibility to avoid pressures on the exchange
rate—and their consequences on inflation and import costs—and try to preserve the
demand for domestic currency. In contrast, the 1993–1996 restrictions were aimed to
reduce capital inflows and ease outflows. In fact, as shown in Cardoso and Goldfajn
(1998), capital controls were endogenous. The government reacted strongly to capital
flows by increasing controls on inflows when these were booming and relaxing them in
moments of distress. However, Cardoso and Goldfajn (1998) also show that, although
the volume and composition of capital flows responded to the restrictive measures,
these measures were ineffective in the long run.
Starting in 1997, capital controls on inflows were again relaxed with the
outbreak of the Asian and Russian crises, and later on with the Brazilian exchange
crisis. The measures from 1997 through 1999 included reduction and later elimination
of both the minimum average maturity for external loans and the financial transaction
tax on capital inflows,
25and elimination of the restrictions on investments under
Annexes I to IV. In 1999, the 1993–1996 restrictive measures had all been lifted. The
greater capital account openness culminated in Brazil accepting the obligations of IMF
Article of Agreement VIII in November 1999.
26In the first half of the 2000s, under the new floating exchange regime adopted in
1999, nonresidents were finally allowed to invest in the same instruments in the
25 A 5% tax is applied to inflows related to external loans with a minimum coverage maturity of up to 90 days.
26 This article precludes the country members, without the approval of the Fund, from imposing restrictions on the making of payments and transfers for current international transactions. It also forbids discriminatory currency arrangements or multiple currency practices. Previously, Brazil availed itself of the transitional arrangements of Article XIV, which allows exchange restrictions but requires countries to take measures towards acceptance of Article VIII as soon as conditions permit.
financial and capital markets that residents do. In addition, the prepayment of external
debt was allowed as well as the conditions for the issuance of real-denominated external
debt were set. Also, an important development of that period was to eliminate the prior
approval of external loans by the Central Bank of Brazil. In effect, the current
registration process for capital flows has become a documentary requirement instead of
part of an active authorization process.
More recently, at the beginning of March 2005, the Central Bank announced the
unification of the exchange markets and clearer rules concerning conversion of
domestic currency into foreign currency. For example, the international transfer
mechanism through deposits in accounts of nonresident financial institutions was
replaced by a more direct procedure.
In spite of the large liberalization of the 1990s, Arida, Bacha, and Lara-Resende
(2004) point out that the resulting system does not mean unrestricted or free
convertibility. The authors list several limits of the current system, including that
current convertibility is based on monetary authority’s rules instead of laws. Therefore,
they can be lifted at any time. In addition, the public opinion still associates transfers
abroad with illicit or antipatriotic practices.
27In fact, notwithstanding some efforts to consolidate the exchange and capital
account rules, the regulation is still fragmented and involves rules set in different
contexts and driven by various motivations. A consolidation of the whole regulation in a
unified law is necessary. Reduction in bureaucratic requirements is needed as well. The
rules would become less uncertain and clearer. These changes would facilitate the
change in mentality, originated back in the capital flight period, when transfers abroad
were necessarily associated with illicit or antipatriotic practices.
A further step could be adopted. Arida (2003a, 2003b, 2004) defends a change in
legislation so as to assure unrestricted convertibility. He argues that the introduction by
law of free convertibility—defined as the absence of any restriction to the exchange
between foreign and domestic currencies, although keeping the domestic currency as the
27 See Gleizer (2005) for a collection of papers on exchange arrangements and capital flow regulation in Brazil.
only means of domestic payments—would give a positive signal. Arida (2003b, 2004)
stresses that free convertibility should not be adopted immediately, but announced
previously and implemented gradually, accompanying also some macroeconomic
indicators and institutional changes, such as central bank independence.
28Our view is that much can and should be done in order to simplify and
consolidate current exchange regulations. The system is excessively bureaucratic and
complicated, consequence of the patch pattern way it was created as the macroeconomic
conditions evolved and ideology changed. At this juncture a consolidation of the
advances of the last decade should be unified in a consolidated and simple law. Further
liberalization steps, beyond consolidation, will need to be accompanied by additional
institutional developments as establishing central bank autonomy, solidifying the fiscal
responsibility law and the need for a mature fiscal policy, reaching a stronger consensus
about the necessity of lower inflation, and implementing judiciary reform and further
microeconomic reforms. Complete freedom of capital flows should emerge as a
“natural” consequence of improvements and maturity in institutions.
In summary, regarding capital controls in Brazil: i) liberalization has advanced
significantly since the 1990s; ii) the restrictive measures of the 1993–1996 period were
mostly aimed at reducing large capital inflows and did not reverse the liberalization
trend; iii) currency convertibility has increased significantly; iv) the current situation
calls for a simplification of the exchange market and elimination of existing
bureaucracy; and v) the advances achieved in the last decade (through several rules)
should be consolidated in a simple law approved by Congress.
4. Volatility of capital flows and financial crises
The large volatility of capital flows has been one of the main arguments for
those that oppose complete liberalization of capital movements. Is the volatility of
capital flows in Brazil a permanent feature? Is the volatility large across the different
types of flows?
28 Arida's proposal has generated some controversy. An opposite view can be found in Ferrari Filho et al. (2005).
Besides the normal volatility analysis, it is important to verify the behavior of
capital flows in periods of stress, such as in financial crises. This provides more
qualitative information regarding the whole distribution of the flows. The Brazilian
economy was affected by four external and two domestic crises in the last decade: i)
Mexican (late 1994); ii) Asian (last quarter of 1997); iii) Russian (third quarter of 1998);
iv) Brazilian exchange crisis (late 1998–early 1999); v) Argentinean (second half of
2001); and vi) Brazilian confidence crisis (last three quarters of 2002). Figure 19 depicts
monthly averages of the EMBI+ Brazil,
29whose peaks reflect the crises. In this section
we conduct some basic estimates of volatility of capital flows and assess their behavior
during the crises.
Volatility of capital flows
The results on volatility are shown in Table 4 for the 1992:1–2004:2 period
(quarterly data). Considering the coefficient of variation (ratio of standard deviation to
average), net direct investment is the less volatile group, in line with the results in
Prasad et. al. (2003), which shows, using a dataset of 76 industrial and developing
countries, that bank borrowing and portfolio flows are substantially more volatile than
FDI. Portfolio investment is the most volatile group. The standard deviation and
coefficient of variation of portfolio investment are 1.3 and 2.0 higher than those for
direct investment. Note that loans are extremely volatile as well. Thus, according to
these indicators, financing through debt securities is not more volatile than via loans.
Furthermore, the variance of direct investment is actually underestimated because its
average in the second half of the sample is substantially higher than in the first half.
Considering the 1997:1–2004:2 sample, its variation coefficient decreases to 0.5,
whereas that of portfolio investment rises to 3.0.
When we use net flows, however, the variation coefficient is sensitive to
averages close to zero. To minimize this problem, we estimate separately the volatility
for inflows and outflows, which are shown in Table 5. Similar to net flows, inflows and
outflows of portfolio investment present a standard deviation significantly higher than
29 The series refers to the sovereign spread of the EMBI until 1997:12, and of the EMBI+ thereafter. For simplicity, we call it EMBI along the text.