Published by Canadian Center of Science and Education
The Long-Run Performance of U.S. Bidding Firms in the Post M&A
Period: The Impact of Bid Type, Payment Method and Industry
Specialisation
George Giannopoulos1, Andrew Holt2, Ehsan Khansalar1 & Patrick Mogoya1 1 Kingston Business School, Kingston University, London, UK
2 Department of Accounting, Metropolitan State University of Denver, Denver, USA
Received: December 4, 2016 Accepted: January 20, 2017 Online Published: January 26, 2017 doi:10.5539/ijbm.v12n2p230 URL: http://dx.doi.org/10.5539/ijbm.v12n2p230
Abstract
This study investigates how mergers and acquisitions (M&A) affect the wealth of shareholders of public firms in the United States (U.S). More specifically, it investigates whether the nature of the bid, the payment method used, and the type of M&A have implications for shareholders of U.S bidding firms. The study analyses 352 mergers and acquisitions in the U.S during the period 1999-2008, and its results indicate that bidding firms suffer significant negative buy-and-hold abnormal returns in the three years period after a M&A announcement. The results also suggest that, in the long-run, hostile bids and cash-financed bidders outperform friendly bids and stock-funded bidders, respectively. Furthermore, the study also finds that in the long-run bidder firms that focus on industry specialisation within their M&A targets significantly outperform firms that adopt a more diversified strategy. The analysis also investigates the effects of M&A specialisation/diversification in six different sectors, and finds that specialised bidders outperform diversified bidders in four sectors: consumer & basic materials, energy & utilities, communications and technology. Furthermore, bidder firms in the financial services sector perform significantly better when diversifying into other sectors, while the performance of bidder firms in the industrial sector appears unaffected by the degree of M&A specialisation or diversification.
Keywords: mergers and acquisitions, abnormal return, long-run performance 1. Introduction
The number of mergers and acquisitions (M&As) has increased significantly in the past century, as has the size of the deals and geographical representation of the firms involved (Martynova & Renneboog, 2008). With each M&A, a key concern for both bidder and target shareholders is return on investment and the manner in which the merger or acquisition affects share prices in both in the short and long term. Prior studies indicate that M&As typically create short-run value for the shareholders of the target entity (Martynova & Renneboog, 2008; Rau & Vermaelen, 1998) and may also create value for bidder shareholders in the same time frame (Eckbo, 1983; Eckbo & Langohr, 1989). There are, however, limited studies on the long-run effects of M&As on shareholder performance, and these offer inconclusive findings about the impact on performance. Agrawal et al.(1992) and Loughran and Vijh (1997) found that shareholders of bidding firms experienced significant losses of 25% and 10% respectively over a 5 year post-M&A period. Similarly, Rau and Vermaelen (1998) found significant underperformance for bidders in a study of M&As on the New York Stock Exchange (NYSE), American Stock Exchange (AMEX), and National Association of Securities Dealers Automated Quotations Stock Market (NASDAQ). However, the same study revealed significant over-performance for bidders in tender offers. Dutta and Jog (2009) found neither positive nor negative cumulative average abnormal returns for 1,300 M&As in Canada during the period 1993-2002. Overall, prior studies provide mixed results about the long-run effects of M&As on shareholder performance, and as a result, this area requires further research.
1.1Aims and Objectives of the Study
The main aim of this study is to evaluate the long-run performance of U.S M&As and to ascertain whether this type of activity increases shareholder value of bidding firms. This study also aims to investigate whether the long-run performance of bidding firms is affected by the nature of the bid (i.e. friendly or hostile) and the method of payment (i.e. cash or stock) used. In addition, this study explores whether a bidding firm’s focus on industry specialisation or diversification within its M&A strategy impacts its long-run performance.
1.2 Contribution
Firstly, this study investigates the relationship between M&As and the long-run performance of bidding firms by applying the Fama-French 3 factor model on expected returns. Secondly, prior studies have failed to provide conclusive evidence on how different M&A factors affect the long-term value of bidder firms. This study add to the literature by evaluating further the effects of bid type, the method of payment and the M&A type, on shareholder value of bidding firms. Thirdly, this study provides additional industry specific analysis about the effects of the M&A type (specialisation or diversification) on the long term performance of bidder firms. Finally, this study uses a sample of U.S firms for the period 1999–2008, on which little research has been published. The remainder of this paper is structured into four sections. Section two provides a review of the existing literature on how M&As affect shareholder value in the long term. Section three describes the methods used to investigate the research questions and explains the data collection process, and Section four provides an analysis of the findings. Finally, Section 5 summarises the main findings, discusses this study's research limitations and offers recommendations for further research.
2. Literature Review
A successful M&A results in significant benefits for a firm’s stakeholders such as the shareholders, lenders and management. The success of an M&A is usually gauged by the growth of sales, profitability and market return in the long run. This is mainly attributed to the gains in efficiency and cost reduction. The BP and Amoco merger of 1998 best exemplifies this as they witnessed a profit increase of 50% in the first two years of their merger. On the other hand, because of the amount of investment required for a M&A, its failure could lead to heavy losses. For example, the acquisition of Time Warner Corporation by America Online in 2000 cost $165 billion; Time Warner Corporation generated profits exceeding $46 billion. However, two years after the acquisition, they were facing losses of over $60 billion (Sudarsanam, 2003).
2.1 Impact of M&As on Bidder Firms’ Long Run Performance
Agrawal, Jaffe and Mandelker (1992) examined the post-merger performance of bidder firms on the NYSE over the period 1955-1987. They found that over a five year period after the M&A, stockholders of the bidder firm suffered a statistically significant loss of about 10%. Loderer and Martin (1992) carried out a study on 1298 M&As in NYSE and AMEX during 1966-1986 period. They found that bidder firms outperformed the control portfolio during a five year period but underperformed the control portfolio over a three year period. Rau and Vermaelen (1998) investigated the long run underperformance of bidder firms by studying 3,517 mergers and tender offers between companies listed on the NYSE, NASDAQ and AMEX. In the three year period after the mergers, bidders underperformed while the bidders in the tender offers over-performed. A major cause for this post-merger or acquisition underperformance was the poor performance by “glamour firms” with low book-to-market ratios.
In order to investigate whether international diversification maybe the reason for bidders’ shareholder value decline in the long term, Dos Santos, Errunza and Miller (2008) investigated a sample of 136 cross-border M&As involving U.S bidder firms and foreign target firms over the period 1990–1999. They found that international diversification did not significantly destroy value in the long term, whereas industrial diversification lead to loss of value even after the pre-acquisition value of the targets was controlled for.
A number of studies investigate the impact of M&As on firms’ long run performance, outside the US. Using more than 1,900 cases of Canadian M&As, Eckbo (1986) investigated the link between corporate control and M&As. In contrast to the U.S studies, he found that bidder firms made significant gains in the long run post-M&A. He also found that during the four year window after the M&A there was no significant difference in performance between the firms involved in horizontal and vertical M&As. On the other hand the geographical location of bidder firms appeared to have an influence on their performance. Dutta and Jog (2009) used both event time and calendar time approaches to investigate the long-term stock return performance of Canadian bidder firms using 1,300 M&As over the period 1993-2002. Similarly this study, in contrast to the U.S studies, failed to find negative long-term abnormal stock market returns.
2.2 Reasons for Negative Long Term Performance after Mergers and Acquisitions
Prior studies provide some, albeit inconclusive, evidence about the positive abnormal returns enjoyed by bidder firms in the short-run post M&A period (Langetieg, 1978; Eckbo, 1983; Eckbo & Langohr, 1989; Agrawal et al., 1992; Loughran & Vijh, 1997; Rau & Vermaelen, 1998; Martynova & Renneboog, 2008, among others). However, studies about the long-term effects of M&As on the shareholder returns of bidding firms suggest that the majority of M&As generate negative abnormal returns (Agrawal et al., 1992; Sudarsanam & Mahate, 2003;
Loughran & Vijh, 1997, among others). This raises the question as to why firms earn negative abnormal returns in the long-run after having earned positive abnormal returns in the short run (Loderer & Martin, 1992; Dutta & Jog, 2009). Rau and Vermaelen (1998) suggest that the performance extrapolation hypothesis is one of the reasons for the negative abnormal returns in the long run. According to the extrapolation hypothesis when markets are assessing the value of an M&A, they extrapolate the past performance of bidders. After the M&A, as its results become apparent, the markets reassess the quality of the bidder. As a result, Rau and Vermaelen (1997) argue that bidder firms earn abnormal returns in the short run because the market reacts to the M&A enthusiastically, and expects the bidder to emulate past successes. However as time goes on, bidder firms experience a decrease in returns as their performance is reassessed, and they are rewarded according to current performance. Consequently, this leads to our first hypothesis:
Hypothesis 1: In the long term (three year) period after the M&A, the return performance of a bidding firm is worse to that achieved by firms of similar size and book-to-market ratio.
2.3 Factors Affecting Shareholder Returns at Bidder Firms
The literature suggests that shareholder return after M&As is influenced by the method of payment used (cash or equity), the nature of the bid (friendly or hostile) and the type of merger (specialisation or diversification). 2.3.1 Nature of the Bid–Friendly vs. Hostile
The nature of the bid is a factor that may affect bidder shareholders’ wealth. Cosh and Guest (2001), among others, analysed the effect of the nature of takeover bids on the long term performance of bidder firms (and targets), on a sample of UK firms over a one year period in 1986. They found that hostile bidders earn positive returns in the long-run after an M&A, while friendly bids resulted in negative long-run returns. Hostile bidders are willing to pay high premiums as compensation to the target shareholders because the target firm may have many attractive features, and the bidders are able to earn positive abnormal returns from these in the long-run. In contrast, bidder firms in friendly bids are unable to earn positive abnormal returns in the long-run, as the target firms have fewer attractive features (Dube, Glascock and Romero, 2007). This leads to our second hypothesis:
Hypothesis 2: In the long term (three year) period after the M&A, the abnormal return performance of a bidding firm in a hostile bid is greater to that achieved by bidders in friendly M&As.
2.3.2 Method of Payment Used–Cash vs. Stock
The method of payment is an important element of M&As because it significantly impacts the returns of both the target and bidding firms. As the management of the bidding firm should wish to use the cheapest payment option, the method of payment used provides a signal to the market about information the bidders’ management has about the valuation of their firm. Rau and Vermaelen (1998) called this the payment hypothesis phenomenon. For example, the management of the bidder firm may opt to finance a M&A with shares as long as the firm’s shares are overpriced by the market, otherwise the preferred method of financing a M&A would be cash. When a firm uses its overpriced shares to acquire the target, its shares will be discounted with a discount rate that arises from the difference between its actual share value and the prevailing share market price. Thus the bidder firm may generate negative abnormal returns in the short run. The management of the bidding firm may prefer to use cash to finance a M&A when their firm’s shares are under-priced by the market. This may result positive abnormal returns in the short run for the bidder firm. When the information asymmetry between the managers and the market is eliminated in the long run, the firm’s share price would be readjusted by the market and the bidder firm may generate abnormal returns in the long run.
Research has been done in this area with the aim of assessing the nature of the relationship between the method of payment and post M&A returns to bidder firm shareholders. In a study of 947 acquisitions during the period 1970-1989, Loughran and Vijh (1997) investigated this relationship. They found that during the five year period after the acquisition, firms that completed stock mergers on average earned negative excess returns of -25% whilst those firms that completed cash tender offers earned on average positive excess returns of 61.7%. Sudarsanam and Mahate (2003) found similar results over a different time period, for different sample size and in a different country. In particular, using 519 UK M&As during 1983-1995, they found that during a three year window after the M&A announcement, bidding firms on average earned negative buy and hold abnormal returns of -8.7%. They also found that bidders that used equity earned substantial negative returns and were significantly outperformed by the bidder firms that used cash as their method of payment. Given the above, our third hypothesis is the following:
Hypothesis 3: In the long term (three year) period after the M&A, the abnormal return performance of a bidding firm that used cash is greater to that achieved by bidders that used equity to finance M&As.
2.3.3 The type of Merger-Specialization vs. Diversification
While diversification does provide advantages to the bidding firm, such as diversification of risk and economies of scope, several studies have found that it actually destroys firm value (Lamonta & Polk, 2002; Dos Santos et al., 2008). These studies suggest that the loss of value after diversification is due to inefficiency. They suggest that firms invest inefficiently as a result of diversification, as they fail to invest resources in segments that are specialised and well established. Rather, they invest in areas outside their expertise and as a result they may be less efficient in the new field of operation. This implies that diversity in investment destroys corporate value, as funds are transferred from segments of speciality that provide high returns, to segments (new areas) that provide lower returns. This argument implies that when comparing the post-M&A performance of two firms of the same size, the firm that specialises (the firm that focuses on its areas of speciality) may perform better than the firm that diversifies. Though this argument is compelling, academic literature is not conclusive about which type of M&A yields greater returns for bidder firms (Eckbo, 1986). Consequently, our fourth hypothesis is the following:
Hypothesis 4: In the long term (three year) period after the M&A, the abnormal return performance of a bidding firm that specialized in M&As in their industry is greater to that achieved by bidders’ that diversified out of their industry.
In summary, since the evidence from the academic literature is inconclusive about the exact effects of the aforementioned factors on the long run performance of bidder firms, post M&A, this study aims to shed more light into these relationships.
3. Data and Methodology
3.1 Data Selection Process
The sample for this study includes all publically listed bidding firms that completed M&As with other public companies on all U.S stock exchanges during the period 01/01/1999-01/01/2009. This data was obtained from the Bloomberg database which provides a database of over 11,000 M&As completed in the U.S during that period. The specific deals analysed were either friendly or hostile in nature, and were financed by cash or stock. In addition, bidder firms were included in the sample only if data was provided about:
• The exact type of the M&A (specialisation or diversification).
• The specific industry of both bidder and target firms involved in the M&A (these data are used as the basis for grouping the data by industry).
• All share prices of the bidder firms for three years post the M&A announcement date at consecutive monthly intervals. These data are used in the calculation of the buy and hold abnormal returns (BHAR).
• The end-of-year market capitalisation for the bidder firms for the year of the M&A and for the following three years. These data are used to determine the size of the bidder firm, a prerequisite to calculate Fama-French (1993) firms’ expected return.
• The end-of-year book-to-market ratio for the bidder firms for the year of the M&A and for the following three years. These data are used to determine the bidder firms’ risk profile/riskiness, a prerequisite to calculate the Fama-French (1993) expected return for a firm.
After using the above selection criteria, the final sample size included 352 U.S M&As completed during the period 1999-2008.
3.2 Chosen Methodology
This study adopts the event study methodology as M&As are event affairs. Beitel et al. (2004) and Floegel et al. (2005, p. 25) suggest that “given an efficient market, the impact of an event is reflected immediately in a firm’s stock price”. The methodology employed is similar to that employed in similar studies such as Ikenberry et al. (1995) and Rau and Vermaelen (1998).
3.2.1 Event Study Horizon and the Identification of the Event Days
An event study focuses on the event period (window) as this forms the basis of the analysis. In this study, the event period is the three years after the announcement of an M&A. It includes all information pertaining to the value of the bidder firms on the announcement date and the following thirty-six months. No information before the announcement date is collected because the effects of M&As on long-term returns are less sensitive to this type of information. In a short-run study, there is a need to collect information about the returns of the firms before the announcement date, either due to information leakage about the deal to the market, causing either
positive or negative share prices movements, or because there is a possibility that the announcement dates were inaccurately recorded (Kuwad, 2010).
The announcement date of the M&A is classified as the event date 0 and is referred to as time T0. The event study horizon of this study starts from the announcement date of the M&A and extends to 36 months after the event i.e. T0 to T36. The 36 month period data after the announcement date are used to determine the long term bidder return performance post the M&A.
To fully investigate the long term effects of M&As on the returns of bidder firm shareholders, three long term event windows are investigated. These windows are the 0-12 month (1 year) period, 0-24 month (2 year) period and the 0 – 36 month (3 year) periods. These windows are used to assess the market reaction to the M&A through the use of the buy and hold abnormal returns (BHAR) of the bidder firms.
3.2.2 Estimation of the Abnormal Returns during the Event Horizon
To determine the abnormal returns for sample firms over the event horizon, the abnormal return for each bidder firm is first determined for every month in the event horizon using the formula below:
ARit = Rit – E(Rit) (1) Where: ARit is the abnormal return of firm i in month t.
Rit is the actual return of firm i in month t. E(Rit) is the expected return of firm i in month t.
To calculate the expected return E(Rit) for firm i in month t, U.S firms are ranked according to size and then they are divided into quintiles (five equal sets). Each of these quintiles forms portfolios which are further ranked into quintiles according to the book-to-market ratios of the firms. This forms 25 (5x5) portfolios with different ranges for size and book-to-market ratio. This process is repeated at the end of every month from January 1999 to December 2009. The average return for each of these portfolios for a specific month t is considered as the expected return for any of the sampled firms that happen to fall in the same size and book-to-market category, at the same month t. French (2012) has calculated and compiled these expected returns in his Data Library. For the purposes of this study expected returns have been collected from French-Data Library.
Having obtained the abnormal returns for each i bidder firm in each month t, the average abnormal returns for all sample firms for each month t within the event horizon are provided using the formula below:
n AR AAR N 1 i it t
= = (2) Where: AARt is the average abnormal return for all sample firms at month t.ARit is the abnormal return of firm i in month t. n is the number of sampled bidder firms.
Finally, the abnormal returns for the sample firms over the event horizon are determined using the Buy and Hold Abnormal Returns (BHAR) shown below. The BHAR represents by how much the sampled firms have underperformed or outperformed the market return expectations in the respective periods. The market return expectations were obtained from the control portfolios of the listed US firms with similar size and book-to-market ratios. The BHAR formula is provided below:
(
1)
1 2 1 − + Π ==
t
T
T
t
AAR
2 1,
T
T
BHAR (3) Where: BHART1, T2 is the Buy and Hold Abnormal Return for all sample firms over the period T1 to T2.AARt is the average abnormal return for all sample firms at month t. T1, T2 is the time period from month T1 to month T2.
3.2.3 Test to Determine Significance of BHAR
The significance of the BHAR results obtained from formula (3) is determined using the t-test statistic. This is necessary to determine whether the long run abnormal return figures calculated for the bidder firms post-M&A, are statistically significant.
To calculate the t-statistic for the BHAR, we use the one-sample t-test formula, which is provided below (Berenson et al., 2012): n S X − μ
=
STAT t (4) Where: X is the sample’s BHART1,T2.μ
is the population mean.S is the sample’s standard deviation. n is the number of bidder firms in the sample.
To calculate the t-statistic for the BHAR difference that is obtained from two sub-samples, the two-sample t-test formula is applied, which is provided below (Berenson et al. (2012)):
+ − − −
=
2 1 2 1 1 ) ( ) ( t 2 1 2 1 n n S X X p μ μ stat (5)Where: X1 and X2 are the BHAR of sub-sample 1 and 2, respectively. 1
μ
andμ
2 are the population means of populations 1 and 2, respectively.1
n
andn
2 are the number of firms in sub-samples 1 and 2, respectively.2
P
S is the pooled variance of the two sub-samples, its formula is provided below:
) 1 ( ) 1 ( ) 1 ( ) 1 ( 2 1 2 1 12 22 2 − + − − + − = n n S n S n S P (6) Where: 2 1 S and 2 2
S are the standard deviations of sub-samples 1 and 2 respectively. 4. Findings and Results
This section discusses the findings of the bidder post M&A return performance. More specifically it provides the findings of the effects of the nature of the bid (friendly or hostile) and the method of payment (cash or stock) on bidders’ performance. It also discusses the effects of the M&A type (industry specialisation or industry diversification) on bidders’ performance, across different bidder industries.
4.1 BHAR of Bidder Firms in the Post M&A Period
Table 1 reports the results of the analysis of the buy and hold abnormal returns (BHAR) of the bidder firms post the M&As. In particular Table 1 presents the BHAR of 3 post event windows based on the total sample observations (352 US M&A deals) over the period 1999-2008.
The results suggest that the sample bidder firms generated a negative BHAR of -1.79% during the 0-12 month window, -0.54% during the 0-24 month window and -5.04% over the three years after the M&A annoucement. This implies the shareholders of bidder firms suffered significant losses after the M&A announcement in the long term. In other words the bidder firms involved in the mergers and acquisitions consistently underperformed the control portfolio in the long run.
Table 1. Post M&A long-run BHAR for bidder firms
Time Period
(Event Window) Buy And Hold Abnormal Return (n = 352)
0 - 12 Months -1.79***
0 - 24 Months -0.54***
0 - 36 Months -5.04***
Notes. The monthly abnormal returns (AR) that are used to obtain the BHAR for this study are calculated using French (2012) data library expected returns for the U.S firms over the period 1999-2008. The *, ** and *** are used to show BHAR statistical significance at 10%, 5% and 1% level, respectively.
These findings also suggest that the shareholders of bidder firms suffered greater losses as the length of the event window increased. Such findings confirm our first hypothesis. In addition these findings are inline to those found by Agrawal et al. (1992), Rau and Vermaelen (1998), Loughran and Vijh (1997), and Sudarsanam and Mahate (2003), which suggest that shareholders of bidding firms suffer losses in the long-run. While the results of this study largely confirm the findings of prior studies, they also call into question the findings of other studies, such as Eckbo (1986), who found that bidders in Canadian M&As earned significant positive BHAR in the long-run post-M&A period. Additionally, Loderer and Martin (1992) and Dutta and Jog (2009) present different results as they did not discover any bidder underperformance in the long-run, post-M&A period.
4.2 Impact of the Nature of the Bid on Post M&A Long-Term BHAR
Considering that this study’s data includes different types of bids, it is also necessary to investigate the relationship that exists between the nature of the bids and the share price performance of bidding firms. The results of this test are presented in Table 2.
Table 2. Post M&A long term BHAR for bidder firms and the nature of the bid
Time Period (Event Window)
Buy And Hold Abnormal Return
Friendly Hostile Difference
(n = 343) (n = 9)
0 - 12 Months -2.13*** 10.96*** -13.09***
0 - 24 Months -0.80*** 8.60*** -9.39***
0 - 36 Months -5.67*** 20.36*** -26.03***
Notes. The monthly abnormal returns (AR) that are used to obtain the BHAR for this study are calculated using French (2012) data library expected returns for the US firms over the period 1999-2008. The *, ** and *** are used to show BHAR statistical significance at 10%, 5% and 1% level, respectively.
The findings show that the bidder firms that participated in friendly bids experienced significant negative BHAR in the long term. The bidder firms in friendly bids underperformed the control portfolio by 2.13%, 0.80% and 5.67% in the 0-12 month, 0-24 month, and 0-36 month periods, respectively. It can also be seen that shareholders of bidder firms involved enjoyed significant positive BHARs. In particular they earned 10.96%, 8.60% and 20.36% in the 0-12 month, 0-24 month, and 0-36 month periods, respectively. These findings confirm the findings of Cosh and Guest (2001) who found that hostile takeover bids result in positive long-term abnormal returns.
Furthermore it is investigated whether the differences in the nature of M&A bid generated significant different shareholders’ return. The results, presented in Table 2, show that for all event periods, the firms that used friendly bids were significantly outperformed by the firms that used hostile bids. In the 0 - 36 months window the hostile bidders outperformed the friendly bidders by 26.03%. Such findings confirm our second hypothesis. This mirrors the findings of Franks et al. (1991) who found that UK firms using hostile bids outperformed those using friendly bids over a three year period after the merger and acquisition. Given their nature and the high premiums attached to them, hostile bids are only pursued by firms when both the management and shareholders of the bidder firm are confident that the benefits of the M&A will outweigh the costs and add value to the firm.
4.3 Impact of Payment Method on Post M&A Long-Run BHAR for Bidder Firms
The literature suggests that the method of payment used for an M&A may affect the returns achieved by both the bidding and target firm. As such, it is important to investigate and analyse the impact of this factor on the abnormal returns of this study’s sample bidder firms. In a bid to accomplish this, the sample’s M&A deals are divided into two groups; those deals that used cash as payment method and those that used stock. The results of this analysis are presented in table 3 below.
Table 3. Post M&A long term BHAR for bidder shareholders and the method of payment
Time Period (Event Window)
Buy And Hold Abnormal Return
Cash Stock Difference (n = 214) (n = 138)
0 - 12 Months 0.15 -4.89*** 5.04***
0 - 24 Months 0.55*** -2.47*** 3.02***
0 - 36 Months -3.37*** -7.93*** 4.57***
Notes. The monthly abnormal returns (AR) that are used to obtain the BHAR for this study are calculated using French (2012) data library expected returns for the U.S firms over the period 1999-2008. The *, ** and *** are used to show BHAR statistical significance at 10%, 5% and 1% level, respectively.
It is found that during the 0-24 month period, bidder firms that used cash as payment method earned significant BHAR of 0.55%, however over the 0-36 month period the same firms experienced significant negative BHAR of -3.37%. However, looking at the performance of the bidder firms that used stocks to pay for their M&As, it is apparent that these firms experienced significant negative BHAR for all event windows investigated; -4.89%, -2.47% and -7.93% during the 0-12 month, 0-24 month and 0-36 month periods, respectively.
When comparing the long-run performance of bidder firms that used cash and those that used stock to finance their M&A it appears that the cash bidders significantly outperformed the stock bidders during all event windows. Over the 3 year period following the announcement of the merger and acquisition, the cash bidder firms outperformed the stock bidder firms by 4.57%, despite the fact that both groups generated negative BHAR when compared to the control portfolio. Again these findings provide evidence in support of our third hypothesis.
4.4 Impact of M&A Type on Post M&A Long Term BHAR for Bidder Shareholders
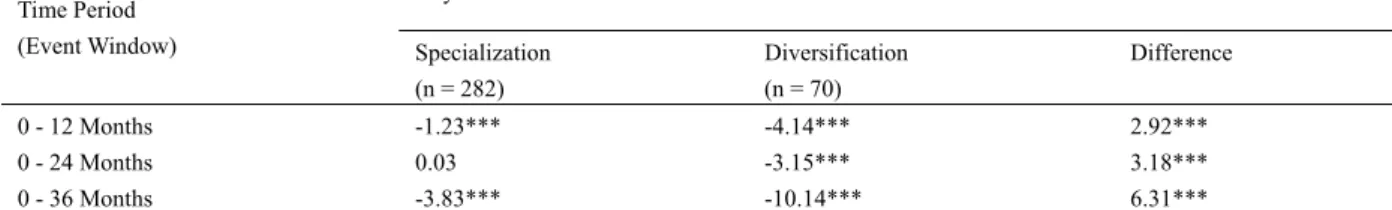
The different types of M&As can be classified by the choice to specialise in a particular industry or to diversify out of the said industry. Table 4 shows the results of the analysis of the effects of the M&A type on the BHAR of the bidder firms. In particular sample bidders are grouped by the choice to specialise in or diversified out of an industry.
Table 4. Post M&A long run BHAR for bidder firms grouped by M&A type
Time Period (Event Window)
Buy And Hold Abnormal Return
Specialization Diversification Difference
(n = 282) (n = 70)
0 - 12 Months -1.23*** -4.14*** 2.92***
0 - 24 Months 0.03 -3.15*** 3.18***
0 - 36 Months -3.83*** -10.14*** 6.31***
Notes. The monthly abnormal returns (AR) that are used to obtain the BHAR for this study are calculated using French (2012) data library expected returns for the U.S firms over the period 1999-2008. The *, ** and *** are used to show BHAR statistical significance at 10%, 5% and 1% level, respectively.
Table 4 suggests that bidder firms that chose to specialise suffered significant negative BHAR of -1.23% and -3.83% in the 0-12 month and the 0-36 month periods, respectively. In other words bidder firms that specialised underperform the control portfolio in the long run. Similarly, the bidder firms that chose to diversify suffered significant negative BHAR for all event windows in this study. These firms generated -4.14%, -3.15% and
-10.14% BHAR during the 0-12 month, 0-24 month and 0-36 month periods, respectively. These findings suggest negative BHAR for bidder firms in the long run regardless of their choice to either diversify out or specialise in an industry.
The impact of diversification and specialisation is clear, as bidder firms that specialised earned less negative returns than bidders that diversified. During the 0-12 month, 0-24 month and 0-36 month periods, the firms that specialised significantly outperformed those that diversified by 2.92%, 3.18% and 6.31%, respectively. These findings contradict the findings of Eckbo (1986), who found no significant performance difference between those firms involved in horizontal mergers (specialisation) rather than vertical mergers (diversification). Overall, the evidence provided in Table 4 confirms our fourth hypothesis.
4.5 Industry Specific Analysis of the Impact of M&A Type
The first phase of the analysis on the impact of the bidder firms’ choice to specialise or diversify industry did not focus on a specific industry. The complex structure of the US economy combined with the existence of unique niche markets may result in varied reactions to the M&A type in different industries. This calls for a deeper and more specific analysis of the underlying relationships between the choice to specialise or diversify and its impact on the returns of the bidder firms, in different industries. As a result, the analysis now focuses on M&A activity in the following six sectors: financial, consumer and basic materials, energy and utilities, industrial, communications and technology.
4.5.1 Impact of M&A Type on Post M&A Long-Run BHAR for Bidder Firms in the Financial Sector
Table 5 presents the results of the impact of the M&A type on the BHAR of the bidder firms in the financial sector over the period 1999-2008. Financial sector investigation shows that firms that chose to specialise into financial sector suffered significant negative BHAR of -4.38% and -15.76% over the 0-24 month and 0-36 month periods, respectively. However, in the 0-12 month period it was observed that bidders earned significant positive BHAR of 0.84%. The bidder firms that chose to diversify showed significant positive BHAR of 8.40% and 10.88% during the 0-12 month and 0-24 month periods, respectively. Significant negative BHAR was also realised during the 0-36 month period.
Table 5. Post M&A long-run BHAR for bidder firms in the financial sector grouped by M&A type
Industry Time Period (Event
Window)
Buy And Hold Abnormal Return
Specialization Diversification Difference Financial Sector 0 - 12 Months 0.84*** 8.40*** -7.57*** 0 - 24 Months -4.38*** 10.88*** -15.26*** (ns = 86) 0 - 36 Months -15.76*** -3.20*** -12.56*** (nd = 14)
Notes. The monthly abnormal returns (AR) that are used to obtain the BHAR for this study are calculated using French (2012) data library expected returns for the U.S firms over the period 1999-2008. The *, ** and *** are used to show BHAR statistical significance at 10%, 5% and 1% level, respectively. ns/nd is the number of firms that specialized/diversified in the financial sector.
Contrary to what was observed in the entire US economy, as shown in Table 4, bidder firms that chose to diversify out of the financial industry outperformed those that chose to specialise in the financial industry by 7.57%, 15.26% and 12.56% over the 0-12 month, 0-24 month and 0-36 month periods, respectively.
4.5.2 Impact of M&A Type on Post M&A Long-Run BHAR for Bidder Firms in the Consumer and Basic Materials Sector
Table 6 below shows the results for the relationship between bidder firm shareholder return and the M&A type in the consumer and basic materials sector over the period 1999-2008.
Table 6. Post M&A long-run BHAR for bidder firms in the consumer and basic materials sector grouped by M&A type
Industry Time Period (Event
Window)
Buy And Hold Abnormal Return
Specialization Diversification Difference Consumer and Basic
Materials Sector 0 - 12 Months 0.63 -6.09*** 6.72*** 0 - 24 Months 5.77*** -0.39 6.15*** (ns = 83) 0 - 36 Months 5.86*** 1.28** 4.57*** (nd = 17)
Notes. The monthly abnormal returns (AR) that are used to obtain the BHAR for this study are calculated using French (2012) data library expected returns for the U.S firms over the period 1999-2008. The *, ** and *** are used to show BHAR statistical significance at 10%, 5% and 1% level, respectively. ns/nd is the number of firms that specialized/diversified in the consumer and basic materials sector.
The results of Table 6 suggest that bidders that chose to specialise in this this sector earned significant positive BHAR of 5.77% and 5.86% in the 0-24 month and 0-36 month periods, respectively. On the other side, the bidder firms’ performance that chose to diversify out of the consumer and basic materials sector was not stable. In particular, they generated insignificant BHAR in the 0-24 month period and a positive BHAR of 1.28% during the 0-36 month period.
Regardless of the decision to specialise or diversify, bidder firm shareholder returns in the consumer and basic materials sector outperformed the control portfolio over the three 3 years period. This is significantly different from the findings of the non-specific sector analysis of specialisation and diversification shown in Table 4, where bidder firm shareholder returns underperformed against the control portfolio for both types of M&A.
When the performance of specialised firms is compared against the diversified firms within this sector, the results suggest that specialist bidder firms outperformed the diversified bidder firms by 6.72%, 6.15% and 4.57% in the 0-12 month, 0-24 month and 0-36 month periods, respectively. Specialization in this sector appears to yield greater returns to bidder shareholders than diversification.
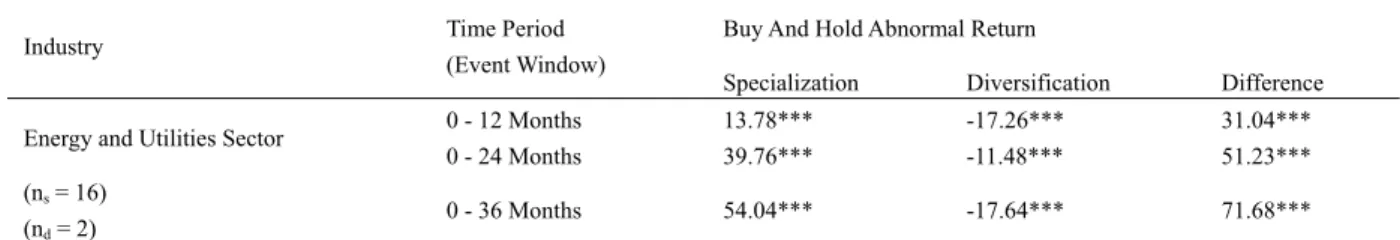
4.5.3 Impact of M&A Type on Post M&A Long-Run BHAR for Bidder Firms in the Energy and Utilities Sector Table 7 shows the results of the analysis about the impact of the M&A type on the post M&A long-run BHAR of bidders in the Energy and Utilities sector over the period 1999-2008.
Table 7. Post M&A long-run BHAR for bidder firms in the Energy and Utilities Sector grouped by M&A type
Industry Time Period
(Event Window)
Buy And Hold Abnormal Return
Specialization Diversification Difference Energy and Utilities Sector 0 - 12 Months 13.78*** -17.26*** 31.04***
0 - 24 Months 39.76*** -11.48*** 51.23***
(ns = 16)
0 - 36 Months 54.04*** -17.64*** 71.68***
(nd = 2)
Notes. The monthly abnormal returns (AR) that are used to obtain the BHAR for this study are calculated using French (2012) data library expected returns for the U.S firms over the period 1999-2008. The *, ** and *** are used to show BHAR statistical significance at 10%, 5% and 1% level, respectively. ns/nd is the number of firms that specialized/diversified in the energy and utilities sector.
Bidder firms that chose to specialise in the energy and utilities sector significantly outperformed the control portfolio during all event windows. These firms earned significant positive BHAR as large as 54.04% for the 0-36 month period. The bidder firms in the energy and utilities sector that chose to diversify underperformed the control portfolio by 17.26%, 11.48% and 17.64 in the 0-12 month, 0-24 month and 0-36 month periods, respectively.
These results for diversified bidders are similar to the non-specific sector analysis of diversified firms, presented in Table 4, which underperformed against the control portfolio over the three years period. On the other side, conflicting results are observed regarding the specialised bidders. In particular, specialised bidders in the energy and utilities sector have significantly outperformed their control portfolios unlike those in the non-specific sector analysis of specialised bidders, in Table 4.
It is further noted that the bidder firms that chose to specialise in the energy and utilities sector significantly outperformed those bidders that chose to diversify out of the industry. Table 7 reports that the bidders who specialised outperformed those that diversified by up to 71.68% in the 0-36 month period.
In conclusion, in the long run, within the energy and utilities sector, specialised bidders earn greater returns than the shareholders of the bidders that choose to diversify out of this sector.
4.5.4 Impact of the M&A Type on the Post M&A Long Term BHAR for Bidder Shareholders in the Industrial Sector
Table 8 presents the results of the analysis on the selected event windows on the impact of the M&A type on the post M&A long term BHAR of bidders in the Industrial sector over the period 1999-2008. The results of table 8 suggest that all bidder firms in the industrial sector outperformed the respective control portfolios especially those bidders that choose to specialise. The bidder firms that chose to specialise in the industrial sector earned significant positive BHAR of 2.53%, 6.25%, and 1.57% for the 0-12 month, 0-24 month, and 0-36 month periods, respectively. These results are in contrast with the non- specific sector analysis, presented in Table 4, where significant negative BHAR are experienced for the bidder firms that chose to specialise.
Similarly, the bidder firms that chose to diversify out of the industrial sector also earned significant positive BHAR of 5.29% in the 0-24 month period. Once again, these results are in contrast with the non- specific sector analysis of Table 4.
Table 8. Post M&A long term BHAR for bidder shareholders in the industrial sector grouped by M&A type
Industry Time Period (Event Window) Buy And Hold Abnormal Return
Specialization Diversification Difference Industrial Sector 0 - 12 Months 2.53*** 0.73 1.80 0 - 24 Months 6.25*** 5.29*** 0.96 (ns = 23) 0 - 36 Months 1.57*** 0.56 1.01 (nd = 14)
Notes. The monthly abnormal returns (AR) that are used to obtain the BHAR for this study are calculated using French (2012) data library expected returns for the U.S firms over the period 1999-2008. The *, ** and *** are used to show BHAR statistical significance at 10%, 5% and 1% level, respectively. ns/nd is the number of firms that specialized/diversified in the industrial sector.
Finally, there is no significant difference between the performance of the bidder firms that specialised in and those bidder firms that diversified out of the industrial sector.
4.5.5 Impact of M&A Type on Post M&A Long-Run BHAR for Bidder Firms in the Communications Sector Table 9 shows the results for the impact of the M&A type on the post M&A long-run BHAR of bidders in the Communications industry over the period 1999-2008. The results reveal that the all bidder firms, regardless of their choice to specialise or diversify, underperformed the control portfolio in the long-run post M&A period. The bidder firms that chose to specialise in this industry suffered significant negative BHAR of -20.58%, -19.98% and -26.20% in the 0-12 month, 0-24 month and 0-36 month periods, respectively. Similarly, the bidder firms that chose to diversify out of this industry suffered large significant negative BHAR of -13.17%, -19.47% and -29.14% in the 0-12 month, 0-24 month and 0-36 month periods, respectively.
Table 9. Post M&A long-run BHAR for bidder firms in the communications sector grouped by M&A type
Industry Time Period (Event Window) Buy And Hold Abnormal Return
Specialization Diversification Difference Communications Sector 0 - 12 Months -20.58*** -13.17*** -7.40***
0 - 24 Months -19.98*** -19.47*** -0.50 (ns = 35)
0 - 36 Months -26.20*** -29.14*** 2.94** (nd = 7)
Notes. The monthly abnormal returns (AR) that are used to obtain the BHAR for this study are calculated using French (2012) data library expected returns for the U.S firms over the period 1999-2008. The *, ** and *** are used to show BHAR statistical significance at 10%, 5% and 1% level, respectively. ns/nd is the number of firms that specialized/diversified in the communication sector.
These findings are similar to those observed for the non-specific sector analysis, where significant negative BHAR are found for both bidders that chose to specialise or diversify. When comparing the performance between bidders that chose to specialise in and those that chose to diversify out of the communications sector, contrasting results are reported. In particular, those bidders that specialised outperformed those that diversified by 2.94% in the 0-36 month period, and underperformed those that diversified away by 7.40% in the 0-12 month period. This is mainly attributed to the fact that the communication sector requires highly specialised skills that are not transferable to other industrial sectors and thus these firms would not perform well outside their industry. 4.5.6 Impact of M&A Type on Post M&A Long-Run BHAR for Bidder Firms in the Technology Sector
Table 10 shows the results of the analysis on the selected event windows on the impact of the M&A type on the post M&A long term BHAR of bidders in the Technology industry over the period 1999-2008.
Table 10. Post M&A long-run BHAR for bidder firms in the technology sector grouped by M&A type
Industry Time Period (Event Window) Buy And Hold Abnormal Return Specialization Diversification Difference Technology Sector 0 - 12 Months 0.31 -13.33*** 13.64***
0 - 24 Months -2.32*** -21.77*** 19.45*** (ns = 39)
0 - 36 Months 1.56*** -32.89*** 34.46*** (nd = 16)
Notes. The monthly abnormal returns (AR) that are used to obtain the BHAR for this study are calculated using French (2012) data library expected returns for the U.S firms over the period 1999-2008. The *, ** and *** are used to show BHAR statistical significance at 10%, 5% and 1% level, respectively. ns/nd is the number of firms that specialized/diversified in the technology sector.
The results suggest that the specialist bidder firms in the technology sector earned significant positive BHAR of 1.56% in the 0-36 month period despite suffering significant negative BHAR of -2.32% during the 0-24 month period. The bidder firms that chose to diversify consistently suffered significant negative BHAR across all event windows with a BHAR of -32.89% during the 0-36 month period.
A comparison of the performance of the bidder firms that chose to specialise in the technology sector and those that chose to diversify revealed that those that chose to specialise significantly outperformed those that chose to diversify by 13.64%, 19.45% and 34.46% in the 0-12 month, 0-24 month and 0-36 month periods, respectively. Finally, it can be observed that the bidder firms in the technology sector perform similarly to bidder firms in the non-specific sector sample (see Section 4.5.7 and Table 4 for more details).
Overall the sector specific analysis (with the exception of the financial and communication sectors), similarly to the non-specific sector analysis, provides evidence in support of our fourth hypothesis.
4.6 Summary of the Results
The results of this study suggest that the choices the bidder firms make during their M&A process such as the nature of the bid, the method of payment and the type of M&A affect their long term returns.
Table 11. Findings for the non-specific sector analysis of the impact of the three factors on the long-run BAHR performance of bidder firms
Factors affecting bidder shareholders’ return
Performance of each of the two underlying categories of each factor
Performance comparison of the two underlying categories of each factor
Nature of the Bid Friendly Underperform *** Hostile bids outperform Friendly bids***
Hostile Outperform ***
Method of Payment
Cash Underperform *** Cash bids outperform
Stock bids***
Stock Underperform ***
Type of Merger Specialisation Underperform *** Specialising firms outperform Diversifying firms***
Diversification Underperform ***
Notes. The *, ** and *** are used to show BHAR statistical significance at 10%, 5% and 1% level, respectively
Table 11 provides a breakdown of the findings of this study. It summarises the non-specific sector analysis results of the impact of the nature of the bid, method of payment and the type of M&A on the firm’s performance during the 0 – 36 months window post the M&A announcement.
In the three year period after the M&A, all bidder firms, with the exception of those in hostile M&As, underperform the control portfolio, and these results are consistent with those reported by Rau and Vermaelen (1998). More specifically this study reports that hostile bidders generate significant positive abnormal returns in the long run and they outperform the friendly bidders. These findings are confirmed by Franks et al. (1991) and support our second hypothesis.
The findings of this study also suggest that both cash and stock bidders underperform the control portfolio in the long run. In addition cash bidders outperform the stock bidders. These findings are consistent with the predictions of our third hypothesis. In addition these results are consistent with the findings of Loughran and Vijh (1997) and Sudarsanam and Mahate (2003).
The results of this study’s investigation on the effects of the M&A type on the performance of the bidder firms suggest underperformance for all bidder firms regardless of the M&A type. This study further finds that firms that specialised outperformed those that diversified which is consistent with the predictions of our fourth hypothesis. These findings contradict Eckbo’s (1986) findings. In particular Eckbo did not report significant difference in performance between those bidder firms that specialised and those that diversified.
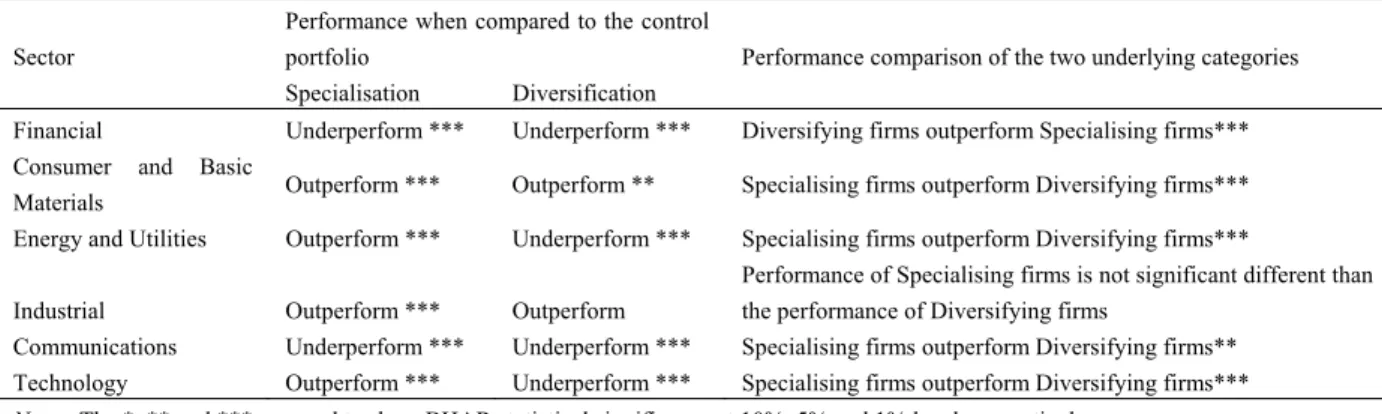
Lastly, this study took an in-depth look at the effect of the M&A type on the performance of bidder firms in different sectors: financial, consumer and basic materials, energy and utilities, industrial, communications and technology. Table 12 provides a clear breakdown of the extended findings of this study. It summarises the results for the sector specific impact of the M&A type on the firm’s performance during the 0 – 36 months window. Table 12. Findings for the sector specific analysis about the impact of M&A type on the long-run BHAR performance of bidder firms
Sector
Performance when compared to the control
portfolio Performance comparison of the two underlying categories Specialisation Diversification
Financial Underperform *** Underperform *** Diversifying firms outperform Specialising firms*** Consumer and Basic
Materials Outperform *** Outperform ** Specialising firms outperform Diversifying firms*** Energy and Utilities Outperform *** Underperform *** Specialising firms outperform Diversifying firms***
Industrial Outperform *** Outperform
Performance of Specialising firms is not significant different than the performance of Diversifying firms
Communications Underperform *** Underperform *** Specialising firms outperform Diversifying firms** Technology Outperform *** Underperform *** Specialising firms outperform Diversifying firms***
Notes. The *, ** and *** are used to show BHAR statistical significance at 10%, 5% and 1% level, respectively.
The sector specific results reveal variations in bidders’ performance across different sectors. The non- specific sector analysis, presented in Table 11, indicates that the specialised bidders underperformed their control portfolio. This is true only for those bidders that chose to specialise in the financial and communications sectors. Other bidders that chose to specialise in the other sectors outperform their control portfolio. Again these findings provide evidence in support of our fourth hypothesis.
Table 12 identifies that in four out of six sectors analysed, diversified bidder firms underperformed their control portfolios. In particular bidders that chose to diversify out of the technology, communications, financial, and energy and utilities sectors underperformed their control portfolios. Furthermore, the sector specific analysis suggests that specialised bidders outperformed the diversified bidders in four out of six sectors, which is similar to the non-specific sector analysis findings. In particular, specialised bidders outperformed diversified bidders in consumer & basic materials, energy & utilities, communications and technology sectors. On the contrary, the specialised bidders in the financial sector were outperformed by the diversified bidders while those specialised bidders in the Industrial sector had no significant difference in performance from the diversified bidders.
5. Conclusion
The main objective of this study is to investigate how shareholder returns of bidding firms are affected by M&As. This is achieved by examining the impact that bid type, method of payment and the M&A type (specialisation or diversification) may have on the long-run returns of bidder firms in the three year period after the M&A is announced. Within this analysis, the study also provides industry specific analysis about the impact of M&A type
on the long-run returns of the bidder firms in six specific industries.
The findings of this study are consistent with those of prior studies, and suggest that in the long-run (3 years) post the M&A, the shareholders of bidding firms lose value (-5.04%). The relationship between the nature of the bid and the bidder firms’ performance suggests that over the three year period after an M&A, bidder firms in hostile bids significantly outperform bidder firms in friendly bids by up to 26.03%. In addition, while hostile bidders earn significant positive BHAR’s in the long-run (20.36%), friendly bidders suffer significant negative BHARs (-5.67%).
Regardless of the method of payment used, bidder firms generate significant negative BHAR’s over a three year period after the M&A. During the same period, the cash bidders suffer BHAR’s of -3.37% whilst the stock bidders suffer BHARs of -7.93%.
In terms of the relationship between bidder firm performance and the type of M&A, our results indicate that bidder firms that choose industry specialisation outperform bidder firms that choose industrial diversification in the long run by 6.31%, though both types of bidders generate significant negative BHARs.
The in-depth analysis of the industry specific relationships between the performance of bidders and the M&A type confirms the outperformance of specialised bidders over diversified bidders in four out of the six sectors analysed: consumer & basic materials, energy & utilities, communications and technology. However, bidder firms in the financial industry perform better when diversifying into other sectors, whilst the performance of bidder firms in the industrial sector is unaffected by either specialisation or diversification.
In terms of its limitations, this study is hampered by the inherent inaccuracies associated with any long-run event study. For instance, it is difficult to identify the actual impact of mergers and acquisitions over the long-run especially as firms participate in other strategic and operational decisions (Martynova and Renneboog, 2008). Finally, as the sector specific analysis results reveal variations in bidder performance across sectors, future research could further investigate this issue. In particular, it may be worthwhile to investigate: a) whether diversification into specific sectors yields different returns for bidder firms and b) identify the target sectors that may yield the most favourable diversification benefits for the specific(s) bidders’ industry.
It would be interesting to investigate these issues further given that there appears to be a tendency for bidders from certain industries to diversify into specific sectors. This raises the question whether this strategy yields the most favourable diversification benefits for bidders. In particular, evidence from our data suggests that 71% of the firms that diversified out of the technology sector chose to enter the communications sector. In contrast, we also observed that 57% of the firms that diversified out of the communications sector chose to enter the technology sector. These observations suggest that bidder firms in the technology sector prefer to diversify into the communications sector, instead of other sectors, and vice versa. Is this strategy adopted because these firms assume that they will receive the most favourable diversification benefits from such a move? Future research may give us the answer to this question and ascertain whether the firms’ original assumptions were correct. References
Agrawal, A., Jaffe, J. F., & Mandelker, G. N. (1992). The Post Merger Performance of Acquiring Firms: A Re-examination of an Anomaly. The Journal of Finance, 47(4), 1605-1621. https://doi.org/10.1111/j.1540-6261.1992.tb04674.x
Amihud, Y., & Lev, B. (1981). Risk Reduction as a Managerial Motive for Conglomerate Mergers. The Bell Journal of Economics, 12(2), 605-617. https://doi.org/10.2307/3003575
Ayodele, A. (2007). The Post Merger Share Price Performance of acquiring firms. Kingston Business School, London.
Beitel, P., Scheireik, D., & Warrensburg, M. (2007). Explaining the M&A success in European bank mergers and acquisitions. Retrieved from http://www.finance.uni-frankfurt.de//wp/353.pdf
Berenson, M. L., Levine, D. M., & Krehbiel, T. C. (2012). Basic Business Statistics: Concepts and Applications
(12th ed.). Pearson, Harlow.
Berk, J., & DeMarzo, P. (2011). Corporate Finance: Global Edition (2nd ed.). Pearson, London.
Cosh, A., & Guest, P. (2001). The Long-Run Performance of Hostile Takeovers: UK Evidence. ESRC Centre for Business Research - Working Paperswp215, ESRC Centre for Business Research.
Dos Santos, M., B., Errunza, V. R., & Miller, D. P. (2008). Does corporate international diversification destroy value? Evidence from cross-border mergers and acquisitions. Journal of Banking & Finance, 32(12),
2716-2724. https://doi.org/10.1016/j.jbankfin.2008.07.010
Dube, S., Glascock, J., & Romero, R. (2007). Does it pay for acquirers to be friendly?’ Corporate Ownership and Control,5(2), 327-342. Retrieved from http://ssrn.com/abstract=999143
Dutta, S., & Jog, V. (2009). The Long Term Performance of Acquiring Firms: A Re-examination of an Anomaly.
Journal of Banking and Finance, 33(8), 1400-1412. https://doi.org/10.1016/j.jbankfin.2009.02.004
Eckbo, B. E. (1983). Horizontal Mergers, Collusion, and Stockholder Wealth. Journal of Financial Economics, 11(1-4), 241-274. https://doi.org/10.1016/0304-405X(83)90013-2
Eckbo, B. E. (1986). Mergers and the Market for Corporate Control: The Canadian Evidence. The Canadian Journal of Economics, 19(2), 236-260. https://doi.org/10.2307/135282
Eckbo, B. E., & Langohr, H. (1989). Information Disclosure, Method of Payment, And Takeover Premiums: Public And Private Tender Offers In France. Journal of Financial Economics, 24(2), 363. https://doi.org/10.1016/0304-405X(89)90052-4
Fama, E. F. (1993). Common Risk Factors in the Returns on Stocks And Bonds. Journal of Financial Economics,
33(1), 3-56. https://doi.org/10.1016/0304-405X(93)90023-5
Fama, E. F. (1998). Market Efficiency, Long-term Returns and Behavioral Finance. Journal of Financial Economics, 49(3), 283-306. https://doi.org/10.1016/S0304-405X(98)00026-9
Fama, E. F., & French, K. R. (1992). The cross-section of expected stock returns. Journal of Finance, 47(2), 427-465. https://doi.org/10.1111/j.1540-6261.1992.tb04398.x
Floegel, V., Johanning, L., & Gebken, T. (2005). The Dynamics within Merger Waves - Evidence from Industry Merger Waves of the 1990s. https://doi.org/10.2139/ssrn.669525
Franks, J. R., Harris, R. S., & Titman, S. (1991). The Post-Merger Share-Price Performance of Acquiring Firms’,
Journal of Financial Economics, 29, 81-96. https://doi.org/10.1016/0304-405X(91)90014-B
French, K. R. (2012). Kenneth R. French–Data Library. Retrieved from http://mba.tuck.dartmouth.edu/pages/faculty/ken.french/data_library.html
Ghauri, P., & Gronhaug, K. (2005). Research Methods in Business Statistics (3rd ed.). Harlow: Financial Times Prentice Hall.
Haugen, R. A., & Udell, J. G. (1972). Rates of return to stockholders of acquiring companies. Journal of Financial and Quantitative Analysis, 7(1), 1387-1398. https://doi.org/10.2307/2330070
Ikenberry, D., Lakonishok, J., & Vermaelen, T. (1995). Market underreaction to open market Share Repurchases.
Journal of Financial Economics, 39(2), 181-208. https://doi.org/10.1016/0304-405X(95)00826-Z
Jensen, M. C., & Ruback, R. S. (1983). The Market For Corporate Control: The Scientific Evidence’, Journal of Financial Economics,11(1), 5-50. https://doi.org/10.1016/0304-405X(83)90004-1
Kuwad, V. S. (2010). Impact of Mergers and Acquisitions on Shareholder Wealth of Acquirers in the Global Banking Sector. Unpublished MBA Dissertation, Kingston University.
Lamonta, O. A., & Polk, C. (2002). Does diversification destroy value? Evidence from the industry shocks.
Journal of Financial Economics, 63(1), 51-77. https://doi.org/10.1016/S0304-405X(01)00089-7
Langetieg, T. C. (1978). An application of a three-factor performance index to measure Stockholder gains from merger. Journal of Financial Economics, 6(3), 365-383. https://doi.org/10.1016/0304-405X(78)90010-7 Loderer, C., & Martin, K. (1992). Post acquisition performance of acquiring Firms. Financial Management,
21(3), 69-79. https://doi.org/10.2307/3666020
Loughran, T., & Vijh, A. M. (1997). Do Long Term Shareholders Benefit From Corporate Acquisitions? The Journal of Finance, 52(5), 1765-1790. https://doi.org/10.1111/j.1540-6261.1997.tb02741.x
Martynova, M., & Renneboog, L. (2008). A Century Of Corporate Takeovers: What Have We Learned and Where Do We Stand? Journal of Banking and Finance, 32(10), 2148-2177. https://doi.org/10.1016/j.jbankfin.2007.12.038
Megginso, W., Smart, S., & Lucey, B. (2008). Introduction to corporate finance. London, South-Western Cengage Learning
Rau, P. R., & Vermaelen, T. (1998). Glamour, Value and the Post-acquisition Performance of Acquiring Firms.
Roll, R. (1986). The Hubris Hypothesis of Corporate Takeovers. The Journal of Business, 59(2), 197-216. https://doi.org/10.1086/296325
Strong, N. (1992). Modelling abnormal returns: A review article. Journal of Business, Finance and Accounting,
19(1). https://doi.org/10.1111/j.1468-5957.1992.tb00643.x
Sudarsanam, P. S. (2003). Creating Value from Mergers and Acquisitions: The Challenges, An Integrated and International Perspective. FT Prentice Hall, Harlow.
Sudarsanam, S., & Mahate, A. A. (2003). Glamour acquirers, method of payment and post-acquisition performance: The UK evidence. Journal of Business Finance and Accounting, 30, 299-341. https://doi.org/10.1111/1468-5957.00494
Copyrights
Copyright for this article is retained by the author(s), with first publication rights granted to the journal.
This is an open-access article distributed under the terms and conditions of the Creative Commons Attribution license (http://creativecommons.org/licenses/by/4.0/).