Exploring Collaborative Software Visualization
with Multi-touch Tabletop Displays
Craig Anslow, Stuart Marshall, James Noble, and Robert Biddle∗ School of Engineering and Computer Science
Victoria University of Wellington, New Zealand Department of Computer Science
Carleton University, Canada∗
{craig,stuart,kjx}@ecs.vuw.ac.nz [email protected]
Abstract. Most software development applications are designed from a single-user perspective and are bound to the desktop and Integrated Development Environments (IDEs). These applications make it hard for developers to collaboratively work together in the same environment. We present a preliminary user study with SourceVis which is a multi-user col-laborative software visualization application for use on large multi-touch tables. The findings from the study showed that the multi-touch table helped with team work, allowed multiple users to interact at once, en-couraged communication, and made it easy for participants to coordinate between interacting. We observed multiple group coupling strategies and the key finding is that collaborative visualization systems should support a flexible variety of coupling styles.
Keywords: Collaborative Software Visualization, Multi-touch Tables
1
Introduction
Understanding software for maintenance is often a social activity and involves pairs of developers working within co-located environments (same room and time). Developers typically work in pairs within a larger team to carry out tasks including: programming, code reviews, refactoring, and visualization of work flow. Most software development applications and tools that support these tasks often involve analysis and visualization features.
We want to explore how multi-user applications can support collaborative software development activities in co-located environments. SourceVis [1] is a collaborative software visualization application for use on a large multi-touch table (see Figure 1). The aim of SourceVis is to help developers working in co-located teams to explore how a system has been structured by viewing metric visualizations and evolution visualizations. These steps can help identify what parts of a system are large and likely need to be refactored. SourceVis is designed for multiple users to interact synchronously or asynchronously and supports multiple visualization techniques. Visualizations can be displayed at full screen,
within scalable windows, or at any orientation on the horizontal plane. Multiple visualizations can also be displayed at once.
In this paper we present a preliminary user study conducted with SourceVis and six computer science students working in pairs. The aim of the user study was to find out how the multi-touch table helped with team collaboration and to observe what collaborative group coupling styles pairs utilized.
(a) Class Blueprint View (CB). (b) System Hotspots View (SHV).
(c) System Dependency View (SDV). (d) System Evolution Visualization (SEV).
Fig. 1. SourceVis - multi-user collaborative software visualization application, illus-trating some example visualizations [1].
2
Preliminary User Study
We conducted a preliminary user study with pairs of computer science students using SourceVis on a large multi-touch table. We wanted to find out how the multi-touch table helped with team collaboration and how pairs of computer science students would interact with the visualizations by observing their group coupling style [5].
2.1 Participants
There were six participants in this user study. Table 1 lists the demographics of participants in our user study. All were male and between 18–34 years of age. Five of the participants were between 177–183cm tall except for one participant who was a lot shorter at 162cm. All participants had a degree in computer science: one a diploma, three with an honours degree, one masters degree, and one a PhD. The first four participants were currently studying towards a post-graduate degree, while the last pair were working as a research assistant and a research fellow. All had professional development experience, mostly gained through summer internships. None of the participants had used software visualization tools before, but three participants had used some tools that give outlines and overviews of software systems. Four of the participants had touch mobile phones, while one of these also had an iPad. Two of the participants had regularly used touch screens for work purposes before. The participants conducted the user study in pairs. The pairs comprised of participant 1 and 2 as one pair, 3 and 4 as the second pair, and 5 and 6 as the third pair. All the pairs chose their fellow participant before the user study. The first pair had known each other for four years, second pair 10 years, and third pair two years.
When working on previous development projects four of the participants regularly programmed with other developers daily, weekly, or monthly. All par-ticipants except one claimed that they did regular code reviews by developers either daily or weekly. The participants used a range of tools for code reviews in-cluding: source control revision tools, unit tests, project management tools, bug tracking tools, and IDEs. The other two participants who did not program reg-ularly with others mainly worked on solo projects, hence didn’t do code reviews with others or only did a review when merging with revision tools.
2.2 Procedure
Participants were welcomed and given an information sheet, consent form, and a pre-study questionnaire to complete. The questionnaire asked participants about their demographics and background experience. Following the pre-study ques-tionnaire, participants were given a warm up exercise by experimenting with some example entertainment based applications for 10 minutes. Participants were then given a demonstration of SourceVis with a sample system by the ses-sion instructor. The participants were also given time to explore SourceVis using training systems.
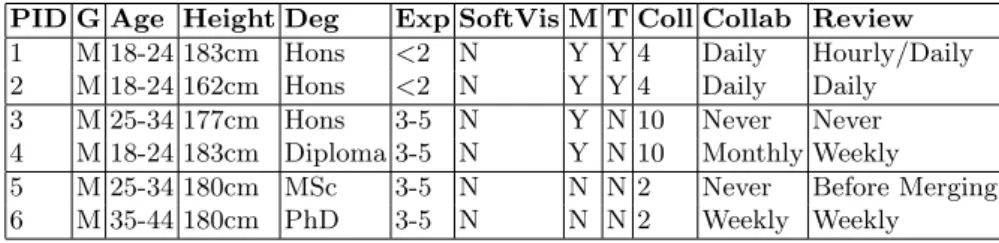
Table 1.Preliminary User Study - Participant Demographics. Participant ID (PID), gender, age range, height, degree acquired (Deg), software development expertise (Exp), software visualization experience in years (SoftVis), smart mobile phones and touch tablets (M), touch screens and touch tables (T), number of years the participant has known their colleague (Coll), how often they program with others at the same time (Collab), and how often they conduct code reviews with other developers (Review).
PID G Age Height Deg Exp SoftVis M T Coll Collab Review
1 M 18-24 183cm Hons <2 N Y Y 4 Daily Hourly/Daily 2 M 18-24 162cm Hons <2 N Y Y 4 Daily Daily 3 M 25-34 177cm Hons 3-5 N Y N 10 Never Never 4 M 18-24 183cm Diploma 3-5 N Y N 10 Monthly Weekly 5 M 25-34 180cm MSc 3-5 N N N 2 Never Before Merging 6 M 35-44 180cm PhD 3-5 N N N 2 Weekly Weekly
The study involved the participants completing user tasks which involved answering 16 questions (see Figure 2) similar to the types of questions software developers ask within industry [4]. The questions asked participants to identify, count, and find information using 11 of the visualization techniques. The sys-tems used in the study were JUnit (including 21 versions) and JHotDraw (6 versions). Each pair of participants completed all the tasks using the same set of visualizations. The participants recorded their answers to the questions on a sheet provided. We recorded the time it took participants to complete the user tasks. Participants were allowed up to 60 minutes to complete the whole user study. We used a custom made multi-touch table which is 48 inches and 1280x800 resolution. With each participant’s consent we video recorded their actions and asked them to think aloud. Participants completed a post-study questionnaire which asked for their opinion on the effectiveness of SourceVis.
3
Findings
3.1 Team Collaboration
We asked participants how the multi-touch table helped with team collaboration. There were many positive aspects including: team work, multi-touch interaction, communication, and coordination between participants.
The size of the table allowed participants to work as a team to see lots of data at the same time, share visualizations, and learn from each other.
“The table allowed for multiple users to work on the same thing at once and collaborate without having to try and explain as much.” PID 4. “It was easy to show things to others.” PID 5.
The multi-touch interaction and the large table removed the barriers from a single person being in control of the user interface such as in Pair Programming
1. (SEV) In JHotDraw version 7.5.1, how many classes are in package org.jhotdraw.geom?
2. (MEV) What is the largest package in JHotDraw version 6.0.1 (total metrics)? 3. (MEV) How many interfaces does this package contain?
4. (MEV) What is the largest class in this package?
5. (TC) In JHotDraw version 7.5.1 how many classes have a toxicity score greater than 5.0 for the metric value “File Length”?
6. (VO) In JHotDraw version 7.5.1 what are the four largest words used in class names?
7. (VO) In JHotDraw version 7.5.1 what are the two largest classes? 8. (SHV) In JHotDraw version 7.5.1 what is the largest package?
9. (SHV) In JHotDraw version 7.5.1 in the largest package, what is the largest class? 10. (CB) In JHotDraw version 7.5.1 in the largest package and then largest class, how
many acccessor methods are called by the public method repaintHandles()? 11. (CB) In JHotDraw version 7.5.1 in the largest package and then largest, how many
interfaces does this class depend on?
12. (CEV) In JHotDraw version 7.5.1 in the largest package and then largest class, how many versions does this class appear in?
13. (SDV) In JUnit 4.8.2 how many classes have no dependencies?
14. (SEV) In JUnit what major version contains the most amount of classes? 15. (SCEV) In JUnit how many versions contain class junit.swingui.TestRunner? 16. (SCEV) In JUnit how many versions contain annotation classes?
Fig. 2.User study questions, with visualization technique abbreviated in parentheses.
where there is only one keyboard and mouse for input which is controlled by the driver [2, 7]. This allowed for all team members to contribute to the task at hand.
“Having a large screen that removes the need for a singular keyboard and mouse allows all team members to contribute to the task at hand. It felt quite good.” PID 3.
The table encouraged participants to communicate with each other as they were working as a group.
“I was constantly communicating with my partner and we were always assisting each other.” PID 2.
Because of the inaccuracy at times of the detection of touch points some participants were cautious when they touched the table while their colleague was also touching the table. This led one pair of participants to coordinate taking turns when interacting with the table. When others needed to coordinate manipulating the interface for example some participants asked their colleague to select a control on the side of the table they were at as they could not reach the controls. Other researchers have considered reach when making tabletop interfaces [6].
“I would have liked to manipulate the interface at the same time as my partner, but didn’t due to accuracy issues with the table. It was easy, however, to take turns manipulating the interface.” PID 2.
“Can not not reach all the buttons.” PID 6.
3.2 Group Coupling Style
We video recorded participants interacting with the table and observed what coupling style they used for the tasks. We used a subset of codes from the group collaborative coupling style for tabletop displays [3, 5]. Descriptions of the group coupling styles we used are listed in Table 2. We manually analysed the video recordings and coded what group coupling style the participants performed. Each video took up to four hours to examine. We only used a subset of the closely coupled styles as at all times participants were working as groups at the same time on the table.
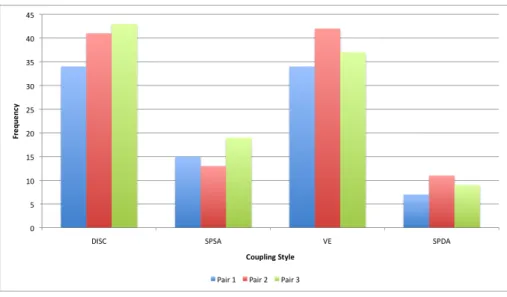
Figure 3 shows the different coupling styles we observed participants per-forming. The frequency is measured by how many times we observed a pair using a style. We observed the pairs using very similar group coupling styles during the study. Most of the time pairs were either discussing the task and not interacting with the table (DISC 39%), or one participant actively interacting with SourceVis while the other participant was viewing (VE 37%). Sometimes participants would both interact with the table at the same time in the same location (SPSA 15%). Less frequently participants would interact with the table at the same time in different areas (SPDA 9%).
The key finding is that collaborative software visualization systems should support a flexible variety of coupling styles. This reinforces the findings from Tang et al. [5] as applied to collaborative software visualization.
Due to time constraints we only analysed the frequency of the coupling styles performed by the participants. We would like to analyse how much time pairs spent in the different coupling styles, and the temporal sequence of coupling styles. In this study we only looked at closely coupled styles. We would look like to explore both closely and loosely coupled styles.
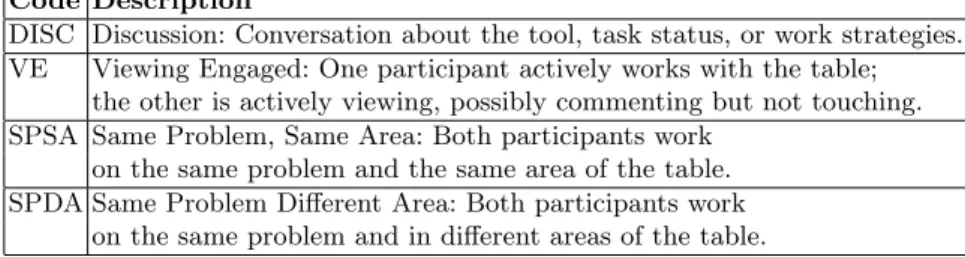
Table 2.Subset of Group Coupling Styles [3, 5].
Code Description
DISC Discussion: Conversation about the tool, task status, or work strategies. VE Viewing Engaged: One participant actively works with the table;
the other is actively viewing, possibly commenting but not touching. SPSA Same Problem, Same Area: Both participants work
on the same problem and the same area of the table. SPDA Same Problem Different Area: Both participants work
Fig. 3.Preliminary User Study - Observed Group Coupling Styles.
4
Conclusions
Most software development applications are designed from a single-user perspec-tive and are bound to the desktop and Integrated Development Environments (IDEs). These applications make it hard for developers to collaboratively work together in the same environment. SourceVis is a multi-user collaborative soft-ware visualization application for use on large multi-touch tables which aims to address this problem [1].
In this paper we presented a small preliminary user study which involved pairs of computer science graduate students using SourceVis on a large multi-touch table. We wanted to find out how the multi-multi-touch table helped with team collaboration and what group coupling strategies pairs utilized.
The findings of the study showed that the multi-touch table helped with team work, allowed multiple users to interact at once, encouraged communica-tion, and made it easy for participants to coordinate between interacting. We observed multiple group coupling strategies and the key finding is that collabo-rative visualization systems should support a flexible variety of coupling styles. In the future we plan to conduct a much larger user study involving professional software developers fro the same team and organisation.
Acknowledgments. This work is supported by the New Zealand Ministry
of Science and Innovation, TelstraClear, Victoria University PhD Completion Scholarship, and the Canadian NSerc SurfNet network.
References
1. Craig Anslow, Stuart Marshall, James Noble, and Robert Biddle. Sourcevis: Col-laborative software visualization for co-located environments. InProceedings of the International Working Conference on Software Visualization (VISSOFT). IEEE, 2013.
2. Kent Beck. Extreme Programming Explained: Embrace Change. Addison Wesley, 1999.
3. Petra Isenberg. Collaborative Information Visualization in Co-located Environ-ments. PhD thesis, University of Calgary, 2009.
4. Jonathan Sillito, Gail C. Murphy, and Kris De Volder. Questions programmers ask during software evolution tasks. InProceedings of the ACM International Conference on Foundations of Software Engineering (FSE). ACM, 2006.
5. Anthony Tang, Melanie Tory, Barry Po, Petra Neumann, and Sheelagh Carpen-dale. Collaborative coupling over tabletop displays. In Proceedings of the ACM International Conference on Human Factors in Computing Systems (CHI), pages 1181–1190. ACM, 2006.
6. Aaron Toney and Bruce H. Thomas. Considering reach in tangible and table top de-sign. InProceedings of the IEEE International Workshop on Horizontal Interactive Human Computer Systems (TABLETOP), pages 57–58. IEEE, 2006.
7. Laurie Williams and Robert Kessler.Pair Programming Illuminated. Addison Wes-ley, 2002.
![Fig. 1. SourceVis - multi-user collaborative software visualization application, illus- illus-trating some example visualizations [1].](https://thumb-us.123doks.com/thumbv2/123dok_us/9408029.2422457/2.892.206.720.323.916/sourcevis-collaborative-software-visualization-application-trating-example-visualizations.webp)