UNIVERSITY OF TARTU
Institute of Computer Science
Software Engineering Curriculum
Kateryna Lytvyniuk
Predicting Information Diffusion on Social Media
Master’s Thesis (30 ECTS)
Supervisors: Rajesh Sharma
Anna Jurek
2
Predicting Information Diffusion on Social Media
Abstract:Social media has become a part of the everyday life of modern society. A lot of information is created and shared with the world continuously. Predicting information has been studied in the past by many researchers since it has its applications in various domains such as viral marketing, news propagation etc.
Some information spreads faster compared to others depending on what interests people. In this thesis, by using supervised machine learning algorithms, we studied information diffu-sion in a social network and predicted content popularity. Three datasets from Twitter are collected and analysed for building and testing various models based on different machine learning algorithms.
We defined tweet popularity as number of retweets any original message received and stated our research problems as binary and multiclass prediction tasks. We investigated how initial retweeting behaviour of a message affects the predictive power of a model. We also ana-lysed if a recent one-hour retweeting behaviour can help to predict a tweet popularity of the following hour. Besides that, main focus is made on finding features important for the pre-diction.
For binary prediction, the models showed performance of AUC up to 95% and F1 up to 87%. For multiclass prediction, the models were able to predict up to 60% of overall accu-racy and 67% of F1, with more accurate performance of classes with messages with very low and high retweet counts comparing to others. We created our models using one dataset and tested our approach on the other two datasets, which showed that the models are robust enough to deal with multiple topics.
Keywords: Information diffusion, social media, prediction, model, classifier, tweet
3
Sotsiaalmeedias informatsiooni hajumise ennustamine
Lühikokkuvõte:Sotsiaalmeedia on saanud moodsa elu osaks. Pidevalt tekib juurde informatsiooni, mida maailmaga jagatakse. Informatsiooni hajumist on varasemalt uuritud paljude teadlaste poolt, kuna sel on rakendusi erinevates valdkondades, nagu näiteks sotsiaalmeediaturundamine ja uudiste levimise uurimine. Informatsiooni leviku kiirust mõjutab selle olulisus inimestele. Käesolevas töös uuritakse info hajumist sotsiaalvõrgustikus ja ennustatakse sisu populaar-sust kasutades juhendatud masinõppe algoritme. Kolme Twitterist pärit andmestikku ana-lüüsitakse ja kasutatakse erinevate masinõppe mudelite konstrueerimiseks.
Defineerisime säutsu populaarsuse kui taaspostituste arvu, mida iga originaalsäuts sai, ning püstitasime uurimisprobleemid binaarsete ja mitmeklassiliste ennustusülesannetena. Uuri-sime, kuidas esialgne säutsude taaspostitamise käitumine mõjutab mudelite ennustusvõi-mekust. Lisaks analüüsisime, kas viimase tunni taaspostituskäitumine aitab ennustada taas-postituskäitumist järgneva tunni jooksul. Täiendav tähelepanu oli suunatud ka ennustuseks tähtsate tunnuste leidmiseks.
Binaarse ennustuse puhul näitasid mudelid tulemusi AUC (area under curve) kuni 95% ning F1-skoori kuni 87%. Mitmeklassiliste ennustuste puhul suutsid mudelid saavutada kuni 60% üldise täpsuse ning F1-skoori kuni 67%. Paremad ennustustäpsused saavutati siis, kui pos-titustel olid väga madalad või väga kõrged taaspostituste arvud. Me genereerisime mudelid kasutades üht andmestikku ning testisime neid ülejäänud kahe peal. See näitas, et mudelid on piisavalt robustsed, et tegeleda erinevate teemadega.
Võtmesõnad: Info hajumine, sotsiaalmeedia, ennustamine, mudel, klassifikaator, säuts
4
Table of Contents
1 Introduction ... 5
1.1 Scope and motivation ... 5
1.2 Research problem ... 5
1.3 Summary of contribution and structure description ... 6
2 Related work ... 7
2.1 Different approaches ... 7
2.2 Application of the research ... 9
2.3 Summary ... 9 3 Data ... 11 3.1 Data collection ... 11 3.2 Structure of tweet ... 12 3.3 Data preprocessing ... 13 4 Background ... 15 5 Evaluation metrics ... 16 6 Methodology ... 18
6.1 Experimental and research design ... 18
6.2 Class labelling ... 19
6.3 Feature extraction ... 20
6.3.1 User features ... 20
6.3.2 Content features ... 20
6.3.3 Sentiment features ... 21
6.3.4 Initial behaviour features ... 22
6.4 Splitting and cross-validation ... 23
7 Description of models and results evaluation ... 24
7.1 Binary classifier ... 24
7.2 Multiclass classifier ... 28
7.3 Predicting tweet popularity using initial retweet behaviour features ... 31
7.4 Predicting tweet popularity in the next hour based on previous hour ... 35
8 Conclusions and future work ... 36
9 References ... 38
Appendix ... 40
I. Hyperparameters used for the models ... 40
5
1
Introduction
Social media platforms allow Internet users to create and consume content in a very con-venient and quick way. The influence of such online networks is very high as the Internet has become the first source of receiving new information in present society. Understanding the information processes of these networks may help in better solving many real world events and further analysing them different objectives. Examples of various objectives could be preventing and investigating of terrorism, observing the trends of elections results, opti-mizing marketing campaigns for businesses, correlating events between social media plat-forms such as Twitter and stock market.
1.1 Scope and motivation
The most popular social platforms where new content appears and spreads continuously are Twitter, Facebook, Instagram. In this thesis, we focus on Twitter as the social platform for analysing information diffusion in this thesis as it is one of the most prominent social plat-forms used by the public. According to recent updates (2nd quarter 2018) there are 335 million active users on Twitter1. New messages appear every day and they have a certain level of interest for the audience. Each message can be forwarded by another user so the tweet goes further through the network, which is called retweeting. If user considers the message interesting for sharing with others he can retweet it, like or comment.
Twitter in particular generates immense amount of data (around 500 million tweets per day according to Twitter 2). In addition, it offers very easy mechanism (APIs) for downloading and collecting the data, which we can use to find out why certain messages are more popular than others and what information or what topic is more interesting for users. Over the recent years, there are various methods and algorithms created by researchers, that aimed to ana-lyse information diffusion online.
1.2 Research problem
People express their opinions about specific topic or events that happen in real time. This data can be analysed to understand what is the most important for messages spreading and to predict information behaviour in future. There are different approaches described and studied in the literature. However, it would be interesting to analyse some of them in depth. In particular, we want to analyse tweet popularity as a number retweets a message receives. Considering the above, we defined several research questions:
RQ1: How can information diffusion be modelled?
RQ2: What features influence the prediction?
RQ3: How well a message will diffuse using the identified features?
RQ4: How initial retweet activity can help to predict tweet popularity?
RQ5: Is it possible to predict tweet popularity in the next time period (for example hour) based on tweet behaviour in previous time period?
The first three research questions have been extensively studied in the past, however, ques-tions RQ4 and RQ5 have not got much attention from the research community.
1 Statista - https://www.statista.com/statistics/282087/number-of-monthly-active-twitter-users/ 2 Twitter statistics - http://www.internetlivestats.com/twitter-statistics
6
1.3 Summary of contribution and structure description
Different methods and algorithms were applied to get the most effective result. It was stud-ied how different groups of features influence the performance of models. Three datasets on different topics were collected and analysed. We applied similar techniques to previous work and tried to outperform them. We extracted basic features such as user profile features and tweet text characteristics and introduced new behaviour features depending on a specific time frame. We showed the most important features for prediction, such as followers count, account age, friends count. It was concluded that it is difficult to predict tweet popularity very accurately but possible to some extent with classification methods we present in this thesis. Using our methodology, we were able to predict with AUC up to 95% and F1 up to 87% for binary task and up to 60% of overall accuracy and 67% of F1 for multiclass task. In addition, we discovered an increasing performance of a model using initial behaviour features.
The thesis is structured as follows:
Chapter 2 contains the related work done in prediction of information diffusion. Chapter 3 presents data used for experiments, its structure, process of collection.
Chapter 4 describes theoretical background of algorithms used to build prediction models. Chapter 5 contains evaluation metrics description.
Chapter 6 discusses the experimental and research design, data preparation and feature ex-traction.
Chapter 7 describes the created models and evaluation of the results.
7
2
Related work
2.1 Different approaches
The question of the way how information spreads within social media has been discussed from different perspectives in the literature. Various descriptive and prediction techniques are used by existing research. To understand all peculiarities and problematic aspects, rele-vant literature was studied. Information diffusion on social media is a broad topic for re-search, so the aim of the overview of related works is to understand which aspect to focus on.
There are many previous studies available within this topic and papers that are most repre-sentative of different approaches are described in this section.
A lot of previous work is focused on popularity prediction problem using the number of future retweet as a measure of the popularity. In [1] the authors tried to find out what differ-ent factors influence information propagation on Twitter. They focused on considering a set of features taken from the content of the tweets. In addition, they determined an average profile of a user who is likely to share tweets and structural properties of the users’ social graph. Two classification problems were defined and two classifiers were trained respec-tively. The first is a binary classifier with positive and negative examples of messages. The second one is a multi-class classifier also which allowed predicting the volume range of future retweets for a new message. It appeared difficult to predict the number of retweets a given message would receive. The reason was that the maximum number of retweets in the test set may have been much higher than its training set counterpart. For simplifying the prediction problem, they defined classes to represent different volumes of messages because it is more difficult to predict the integer number of possible retweets. It was discovered that users mostly see messages from their first-level friends, therefore the probability of some-thing being retweeted depends on the number of followers a user has. It was explained that popular messages have a lot of attention and they are retweeted often, while normal mes-sages are not very interesting to the big audience and they do not spread far.
In [2] researchers investigated the concept of message being interesting (which they called interestingness) more deeply as a way of determining popularity and likelihood of retweet. Similar to previous research, the tweet content characteristics were analysed and used to build and train a prediction model. They tried to predict the probability of retweet based on these features and used the most influential features for this purpose. To find out what are influential features, researchers focused on the content of a tweet, including URLS, hashtags, usernames, emoji’s, question-marks and exclamation-marks etc. Furthermore, it was discovered that there is not so strong correlation between number of followers of a user (as well as other social aspects) and retweet count. It was concluded that messages were more likely to be retweeted if they were about a general popular topic when a specific per-sonal topic is less likely to be retweeted.
Except retweet count, other measures such a speed, scale, and range of information propa-gation on Twitter were studied in the past. In [3] it was described why some features of tweets predict greater information propagation than others. In contrast with other studies, it was found that the practice of mentioning to another user in a tweet via the @username convention could be also analysed. It has a bit different influence on retweet prediction comparing to only following the tweet as it indicates active user interaction. The main goal of the research was to investigate how topics spread through network structures. They built models for three main characteristics of diffusion: speed, i.e. whether and when the first diffusion instance will take place, scale, the number of affected instances at the first-degree,
8
and range, how far the diffusion chain can continue in depth. It was concluded that a topic might have a different propagation efficiency at different time stages of its lifecycle. Diffusion patterns for Twitter messages were introduced by researchers as another way to analyse information propagation. In [4] authors used each tweet’s linguistic features and a profile of initial creator of the tweet to make a prediction. Authors used a methodology for building a prediction model which they called Tree-Patterns. After collecting data of tweets and user activity, Tweet-Trees are created. They represent tweet propagation in the network. Nodes of the tree are followers of the initial user that has retweeted the initial message. Furthermore, these Tweet-Trees can be represented as strings for making basic tree patterns. Linguistic and sentiments of each tweet as well as social media characteristics are repre-sented as vector to use it for classification algorithm and prediction model. Eventually, there were 4 basic tweet patterns identified and 86 characteristics in a vector were created. The results of prediction showed high value of accuracy. In addition, authors defined the most influential groups in Twitter and different Tree-Patterns they belong to.
In [5] similar approach was presented. Authors described methodology and results of studies of how the information spreads in real time. This research aimed to study online data in contrast with majority of other researches on information propagation. This analysis is per-formed using information cascades. Information cascades are models of information propa-gation from one user to another from the stream of tweets and the social graph. The proposed method can be used as a general model of inferring paths of influence, not only limited to retweets, but also of any type of information that diffuses over a social network, e.g. links or hashtags. In addition, it was suggested how to deal with missing data, with regards to constructing the information cascades. To deal with of events that we do not know about before they happen, the Twitter randomly sampled subset of full stream was observed. Rel-evant information cascades that showed a bursty behaviour in beginning of them without knowing the topic of them were detected. Within this method, different features were used. For example, in [6] using information cascades modelling, authors emphasized on most im-portant features they used such as flow of the cascade and PageRank, which indicates user influence on prediction. The authors main goal was to predict the size of a cascade. In an-other research [7], a cascade size of Twitter was also studied with cascade graph features such as edge growth rate, diameter, degree distribution.
In [8] tweet content, user interests, the similarity between the tweet content and user inter-ests, user profile and author information were combined to use for retweet prediction. It was proposed to analyse retweet behaviour using neural networks and deep learning methods in particular. They have been used in the industry and for research purposes for their ability to find and learn optimal features automatically and showed good performance.
Importance of any specific set of features was studied extensively. In [9] user behaviour was analysed and influential users called opinion leaders were identified. Different user types affect on message spreading differently, which can be investigated with metrics of influence, such as indegree, retweets, and mentions, presented in [10]. Using these metrics, it was dis-covered, that a user can have significant influence on some number of topics and the process of obtaining the influence is limited to these topics,
Influence of sentiments and emotions on information diffusion was also studied in the past. In [11] authors calculated sentiments scores of tweets and discovered the correlation be-tween sentiments of original messages and retweets. They concluded that different types of users have different sentiment scores in their messages. It was discovered that negative emo-tions are likely to be propagated comparing to positive [12]. In general, more emotional content is likely to spread quicker or receive more retweets than neutral ones [13].
9 2.2 Application of the research
Using prediction models it is possible to get knowledge about future events based on previ-ous past information. These models can be applied in variprevi-ous fields. In general, prediction of information diffusion is very useful for people who want to reach bigger audience so they know how to construct their message to achieve it.
Prediction of tweet popularity is related to breaking news analysis, which was studied in [14]. Similarly to general information diffusion prediction, it is important to know what are the main characteristics of a short text containing news to become interesting for a public. In the article, it was discussed how to predict news popularity on Twitter and significant features of news spreading were discovered. The authors studied news propagation of news agencies and highlighted that retweets of the news burst almost instantly, while ordinary retweets are made in a relatively long time.
Viral marketing is another field that requires knowledge about how information spreads in social media platforms. Okubo [15] studied advertising campaign strategy based on infor-mation cascades in Twitter. Cheung [16] used an approach that involved timing ofreaching information popularity in the opposite to just finding the popularity (like retweet number) of certain content. They measured social cascades of viral messages from Twitter and Digg networks to find correlations between timing and cascade dynamics. Mazloom [17] studied brand popularity prediction in social networks. They introduced engagement parameters of a post and discovered that it gave more accurate result than predicting popularity only from visual and textual characteristics.
J.Bollen [18] studied the influence of twitter messages emotions on stock market indicators and prediction of stock prices. Their research focused on predicting changes of values of Dow Jones Industrial Average and confirmed that specific public mood dimensions affect these changes.
A lot of researches are related to identifying events happening in real time using microblog-ging platforms. For example, it can be extremely important to detect such events like terror-ist attacks or nature disasters or crises and even predict them. M. Hasan [19] presented a survey about various detection methods of events based on real-time data from Twitter streaming API. More detailed, event detection and popularity prediction was studied in [20]. The authors emphasized on importance of events popularity prediction in microblogging platforms and not only detecting of events. They stated that it is practically useful to track appearing events in social networks and predict if they could become interesting and im-portant for people. Furthermore, propagation of information about events can strongly in-fluence the public opinion. Sakaki [21] proposed a method of prediction of location of an earthquake using machine learning algorithms. They considered each Twitter user as a so-cial sensor which helps to identify the place of natural disaster. Their algorithm is based on processing Twitter real time data and it showed high probability (96%) of detecting earth-quakes. Based on identification of initial characteristics of approaching disaster it becomes feasible predict the catastrophe and to take measures as early as possible.
2.3 Summary
Summarizing the related works, it can be noticed that different approaches to measure in-formation diffusion are used. In this thesis, main focus is made on retweet number as a measure of the message diffusion and also on feature selection for achieving the best possi-ble results.
10
Studies [1], [2], [11] are the most relevant to the research in this thesis and we use their approach to build prediction models and try to outperform the results. Similar to past re-searches, we use basic sets of features and introduce new ones to make the research more interesting. The prediction models of information diffusion can be applied in different do-mains, so we can choose any of them to make experiments.
11
3
Data
3.1 Data collection
The data from Twitter was extracted using Twitter Streaming API. The process of collecting tweets has limitations due to Twitter Standard API policy: not 100% tweets that contain given keywords were gathered. Number of allowed filters are 400 keywords, 5000 user ids and 25 location boxes3. One filter rule is applied on one allowed connection, therefore some part of messages was not recorded. However, there are different paid plans for Developer tools and APIs for premium and Enterprise options that have much more functionality and access.
Twitter Streaming API allows collecting tweets in real-time containing predefined criteria like usernames, locations, hashtags etc. Python script was used to collect messages by key-words.
Three datasets were used for this research. The idea in working with several datasets is to see the effectiveness of created approaches and models in different domains. We used one dataset on Cryptocurrency to build the prediction models and other two smaller datasets for evaluation. This way it could be interesting to compare the results. Description of the col-lected data is given in the table.
Table 1. Collected datasets
Dataset Number of tweets Number of origi-nal tweets Description Cryptocur-rency
3 110 500 1 606 696 Tweets about cryptocurrency trends or news. Collected using the keywords: ‘cryptocurrency’, ‘bitcoin’, ‘blockchain’, ‘etherium’ during January – February 2018. Used for training models and test-ing.
Smartphone brands
601 380 340 504 Tweets about some of most popu-lar smartphones brands. Collected using the keywords: 'Samsung', 'Huawei', 'Xiaomi', 'iPhone', 'Lenovo', ‘Nokia’, 'LG', 'smartphone' in April 2018. Used as testing set.
Football 192 593 103 755 Tweets about football and in
par-ticular 2018 FIFA World Cup. Collected using the keywords: ‘football’, ‘World Cup’ in June 2018. Used as testing set.
12 3.2 Structure of tweet
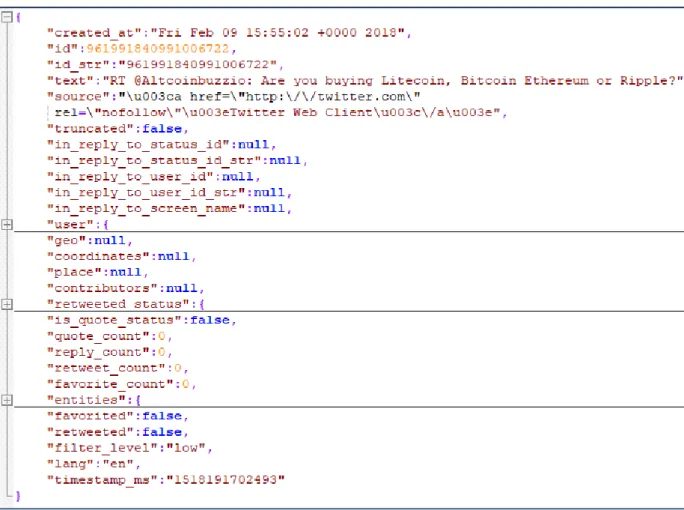
Each Twitter message is represented in JSON format and consist of many attributes. Besides the text of message, metadata of tweet is extracted as well. This data includes user profile, location, statuses, counts of entities (such as special symbols, links), language. Some of them have complex structure and they contain more attributes inside them. The overview of tweet structure is given below.
Figure 1. Tweet structure example
The fields ‘user’, ‘entities’, ‘retweeted_status’ are compound so they have more attributes inside them. User data consists of user profile characteristics. The most relevant for our research are number of followers, friends, date of account creation. Retweeted status has fields with original tweet metadata including its author profile data. Entities of a tweet con-tain some additional information about a message, such as lists of hashtags, urls, user men-tions, symbols. These characteristics can also have an impact in the research.
Retweet is a repost of another message of user of Twitter on your own profile for your own followers. It other words, it is the way of sharing information in Twitter network. Having retweet information, it becomes possible to see how users interact and which information they want to share and identify features of this information.
There are several ways how a user can retweet a message.
- Using “Retweet” button. Twitter provides interactive button to quickly share
13
- RT @username: manual way of retweeting – user just adds RT and username of
another person and copies the original message. This option is the oldest one used on Twitter but is still popular.
- User’s comment + RT @username: user, who wants to retweet someone’s
mes-sage, can add his own opinion about it or reply.
The way to see if a certain message is a retweet from another user is using ‘retweeted_status’ attribute, which contains all information about original tweet with all fields described above. The analysis of retweets with users’ comments and modified tweets is more complicated. However, it can have importance in other researches, for instance, to studying of user influ-ence in social network or sentiments of user comment which is not covered in this thesis. 3.3 Data preprocessing
Cleaning
The process of cleaning the data consists of the next steps:
- Clean tweet text: decode special characters (as ‘&’,’"’, etc.) so that the text is prepared for further usage. This step is important as it influences on new tweet features like ‘length of tweet’ and sentiment features we will create.
- Removing @’mentions. This step was done before creating sentiment features as we first needed to calculate number of user mentions as a separate tweet feature. - Convert time. All important columns, containing time values are converted to the
same format. The most suitable for calculations is Unix timestamp in seconds. Ex-ample of attribute that needed this conversion is column ‘user.created_at’ is a string in format "weekday month day hour minute second zone year".
- Handle missing entries. Observations that have most of their attributes empty were removed from the dataset. In other cases, if there was no information about one or few numeric features, zeros were inserted instead. For instance, user simply may not have any friends or followers so those fields remain empty.
- Remove non-English tweets. It affects on Content and Sentiment features that we introduce in section 6.3.
Imbalanced dataset
The problem of imbalanced data is very common in different domains. In case of Twitter, there are many messages that did not receive any interest from anyone and they have zero retweets.
As expected, the collected datasets are very imbalanced, as there are a lot of messages that have zero retweets. In order to help prevent overfitting, it was decided to downsample the majority class to make the same number of observations in each class.
14
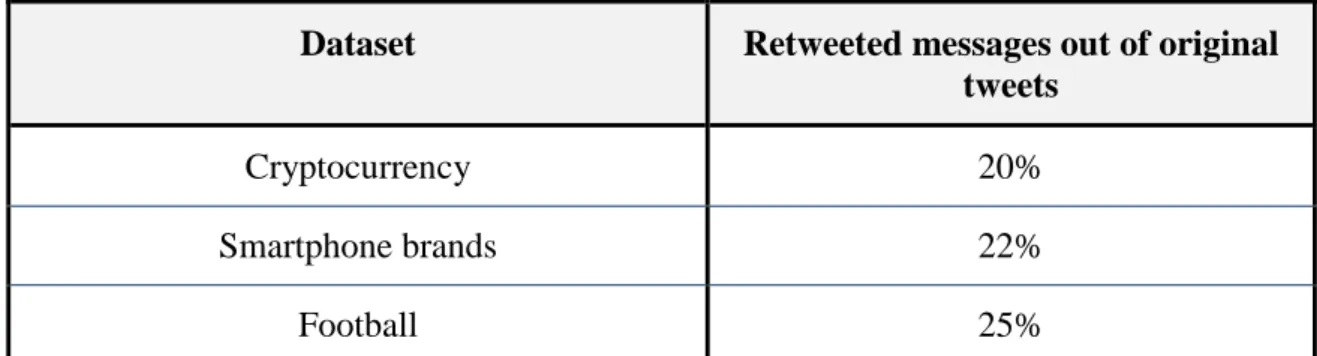
Table 2. Percentage of retweeted messages in the datasets
Dataset Retweeted messages out of original
tweets
Cryptocurrency 20%
Smartphone brands 22%
Football 25%
The imbalanced nature of data causes another problem that there might be not enough data to build a good prediction model of an actual retweet number and even for multiclass task with many classes. The reason is that the number of examples that represent extremely pop-ular tweets is lower comparing to ‘ordinary’ messages, in our Cryptocurrency dataset espe-cially.
15
4
Background
This chapter shortly describes the algorithms used in the experiments. The choice was made by trying different classification algorithms on the collected data and also influenced by related literature.
Logistic regression [22]is a statistical model of predicting the probability of a categorical dependent variable, represented with two classes.
Other chosen methods are ensemble methods that group the weak learners together to form a strong learner. Bagging (bootstrap aggregating) [23] is an ensemble method in which we build many independent models and combine them using some averaging techniques. It re-duces variance well. Boosting [24] is an ensemble technique in which the predictors are made sequentially. Boosting learns to fix the prediction errors of a previous model in the sequence.
Random Forest [25] is an ensemble algorithm which combines multiple decision trees from randomly selected subset of training set. It takes the random selection of features to grow trees. It then aggregates the votes from all decision trees to decide the final class of the target variable. It uses bagging technique which reduces the variance.
Treebag (bagged trees) is also decision tree based algorithm but it does not have the param-eter of how many features to search over to find the best feature, like Random Forest. Tree-bag takes all the features to grow trees.
Adaboost (Adaptive Boosting) [26] is an algorithm represented as a weighted set of weak classifiers. It retrains the model iteratively by choosing the training set based on previous training accuracy. Examples classified incorrectly are assigned higher weight so that it ap-pears in the training subset of next classifier with higher probability. Than the weight is assigned to each classifier the classifier with higher weight has more impact in final result.
Gbm (Gradient Boosting Machine) [27] is a boosting algorithm in which each new model gradually minimizes the loss function (classification may use logarithmic loss). It constructs the new learners so that they are maximally correlated with the negative gradient of the loss function.
Xgboost [28] is an advanced implementation of gradient boosting algorithm. Xgboost uses a regularization that penalizes various parts of the algorithm to prevent overfitting.
16
5
Evaluation metrics
One of the important steps in working with predictive algorithms is the way how to measure and compare obtained results. Evaluation metrics depend on the type of prediction task and data. Some metrics alone can be misleading so it is important to use other few to see the whole picture.
The purpose of evaluation metrics is to give an explanation which classifier works the best and if it works good in general. For binary and multiclass tasks different metrics can be used. For every model it is important to have several metrics to have a possibility to analyse all models from different performance aspects equally. The metrics, used in this work to evaluate the performance of created models, are presented below.
Confusion matrix
Confusion matrix is a table that visualises the performance of a classification task. Rows of the table represent the instances in a predicted class while columns represent the instances in an actual class.
Table 3. Confusion matrix for classifier evaluation
Actual class (Reference)
Pr
ed
ict
ed
class
True Positives (TP) False Positives (FP)
False Negatives (FN) True Negatives (TN)
True Positives (TP) - correctly classified as positives. True Negatives (TN) - correctly classified as negatives. False Positives (FP) - wrongly classified as positives. False Negatives (FN) - wrongly classified as negatives.
In case of classification with more than two classes confusion matrix contains values of results for each class. All correctly predicted values are located in the diagonal of the matrix, so it is easy to visually interpret the table for prediction errors, which can be obtained from values outside the diagonal.
Accuracy
Accuracy tells how often classifier is correct. Accuracy is calculated as division of number of correct predictions by total number of predictions.
𝐴𝑐𝑐𝑢𝑟𝑎𝑐𝑦 = 𝑇𝑃 + 𝑇𝑁 𝑇𝑃 + 𝑇𝑁 + 𝐹𝑃 + 𝐹𝑁
Sensitivity (Recall, True positive rate)
Sensitivity is the rate of a number of actual class of positives that are correctly predicted as such
𝑆𝑒𝑛𝑠𝑖𝑡𝑖𝑣𝑖𝑡𝑦 = 𝑇𝑃 𝑇𝑃 + 𝐹𝑁
17
Specificity is the rate of a number of actual class of negatives that are correctly predicted
as such
𝑆𝑝𝑒𝑐𝑖𝑓𝑖𝑐𝑖𝑡𝑦 = 𝑇𝑁 𝑇𝑃 + 𝐹𝑃
F1-measure
F1-measure is a harmonic mean of the Specificity and Sensitivity. 𝐹1 = 𝑆𝑝𝑒𝑐𝑖𝑓𝑖𝑐𝑖𝑡𝑦 ⋅ 𝑆𝑒𝑛𝑠𝑖𝑡𝑖𝑣𝑖𝑡𝑦
𝑆𝑝𝑒𝑐𝑖𝑓𝑖𝑐𝑖𝑡𝑦 + 𝑆𝑒𝑛𝑠𝑖𝑡𝑖𝑣𝑖𝑡𝑦
ROC
ROC- curve (Receiver Operating Characteristic) curve displays the effectiveness of a binary classifier. It is represented by plot of the true positive rate against the false positive rate with a probability threshold (0.5 by default which was used in this work). The more true positives and the less true negatives are, the better. ROC is closer to optimal point (FPR=0, TPR=1).
AUC
AUC or more specifically AUROC (Area under the ROC Curve) is a value calculated as an area under the ROC in a range from 0 to 1. The ideal classifier has AUC equal to 1.
18
6
Methodology
6.1 Experimental and research design
Based on the relevant literature, a number of different approaches to predicting information diffusion can be identified. The number of retweets is the most important and indicative measure of information diffusion, thus, we use it as a target variable in our prediction mod-els. We performed classification tasks compared to regression as it showed poor results for our dataset. The description of features and created models is presented in details in section 6.3.
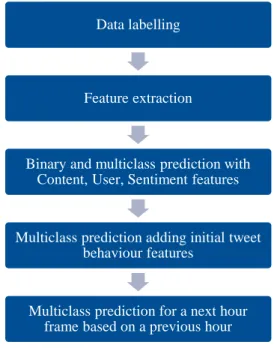
The steps of experiments are shown in Fig.2.
Figure 2. Flowchart of the experiments The detailed explanation of the process is given below:
1) Label the data based on retweet count so that we have classes. 2) Extract User, Content and Sentiment features from tweets.
3) Perform binary and multiclass prediction using different groups of features and com-pare results of different algorithms. We use User, Content and Sentiment features and label the target variable (retweet count) for classification.
4) Analyse of initial tweet behaviour and its influence on prediction power of the model. We added Behaviour features to feature set from previous multiclass task and defined initial time ranges.
5) Predict popularity of tweet in the next hour based on previous hour. We extracted Behaviour features from one-hour frames of a message lifespan and used them in prediction task to predict retweets.
In addition, for analysis, we normalized this data so that we predict the retweet number after the same period of time for each original message. In this case, period of time is time range since each message had appeared till some time point in the future. The time period of 7 days was chosen for further analysis. It will eliminate such situations when one message has less retweets only because it was written later in the process of data collection.
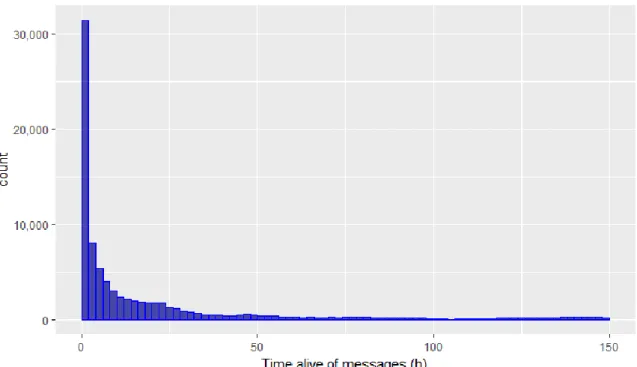
Each message has different time of being popular and at some point it stops being retweeted. To illustrate what values tweet lifespan has the following distributions are given.
Data labelling
Feature extraction
Binary and multiclass prediction with Content, User, Sentiment features
Multiclass prediction adding initial tweet behaviour features
Multiclass prediction for a next hour frame based on a previous hour
19
Figure 3. Distribution of time message is alive (being retweeted) in Cryptocurrency dataset Tweets that were not retweeted do not have such time metrics of their behaviour so they are not included in the Fig.3.
We can conclude, that the bigger part of tweets is concentrated below 50 hours duration which is around two days.
6.2 Class labelling
In order to apply any of the supervised machine learning models, depending on the type of classification, we need to label the data appropriately or in other words, make classes from our numerical target variable. We created two classes: “retweeted” and “no retweet” for binary classification task, and 4 classes for multiclass task. The process of labelling was performed as follows:
- Select unique original messages from dataset.
- Calculate the number of retweets for each message. This attribute is also present in the tweet metadata but it is not useful for our purpose as tweets were collected using Streaming API in real time. In our case, we calculated this number as number of tweets that have same original message id and text attributes. Tweets that have empty values in their original message attributes received 0 retweets.
- Using this number of retweets, create Class column according to classification task as described below.
Names of classes for binary classification: retweeted (retweet number > 0), no retweet (retweet number = 0).
Names of classes for multiclass classification: Very Low, Low, Medium, High (number of retweets). The classes correspond to the following number of retweets: Very Low – 0 to 10, Low – 11 to 90, Medium – 91 to 170, High – 170 and more. The ranges of classes are explained by nature of data – there are more samples with less retweets and few samples with high values of retweet count which are more difficult to predict. To study these outliers and their popularity prediction it is needed to collect more data, specifically collecting very
20
popular tweets. The dataset on Cryptocurrency does not have so large range of values in the opposite to the datasets in related works [1] and also we consider the fact that we limit our prediction horizon in one week period. Therefore, the retweet count ranges are lower than in [1].
6.3 Feature extraction 6.3.1 User features
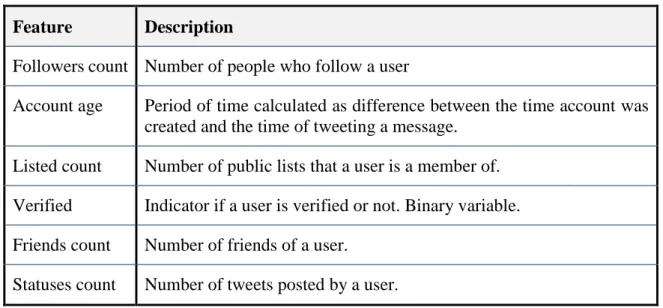
User profile information is very likely to be influential on how many times the message of a user will be retweeted. This data is provided in the structure of a tweet object and necessary attributes can be easily used without any pre-processing. The most intuitive features were taken and some of them are created based on existing simple features.
Table 4. User features description
Feature Description
Followers count Number of people who follow a user
Account age Period of time calculated as difference between the time account was created and the time of tweeting a message.
Listed count Number of public lists that a user is a member of. Verified Indicator if a user is verified or not. Binary variable. Friends count Number of friends of a user.
Statuses count Number of tweets posted by a user. 6.3.2 Content features
There are many features that can be extracted from text of tweet and they can potentially have a great impact on building a good model. Some of them such as number of user men-tions, hashtags and URLs lists are given in a tweet object metadata. Based on this, the num-ber of each entity occurred in a text can be calculated and some additional features can be extracted. The list of them is given below.
Table 5. Content features description
Feature Description
Tweet length Number of symbols in a tweet, including spaces User mentions Number of user mentions with @ notation Hashtags Number of hashtags
URLs Number of URLs Exclamation and
question marks
21 6.3.3 Sentiment features
Sentiment analysis identifies positive and negative opinions, emotions and evaluations. Thus, it is interesting to find messages with what kind of emotions are more popular for diffusion. For this purpose, nine different emotions and sentiments were defined and it was analysed if they are present in each tweet. Sentiment extraction was done using Syuzhet package4 which has four sentiment dictionaries and developed in the NLP group at Stanford. The list of the sentiment (and emotions) features is given below.
Sentiment features list: - Negative - Positive - Trust - Joy - Anger - Disgust - Sadness - Fear - Anticipation - Surprise 4 https://cran.r-project.org/web/packages/syuzhet/vignettes/syuzhet-vignette.html
22 6.3.4 Initial behaviour features
Another approach is predicting behaviour of certain message using information extracted in first few minutes after a new tweet appeared. We called it ‘initial time period’ and tried to build several models using 1, 2, 3, 4, 5, 10, 30, 60 first minutes. There is small amount of previous works that analysed information propagation from this perspective. The following method aims to combine tweet initial behaviour with other features and compare the results. Assuming that initial behaviour of tweet has an influence on the following tweet propaga-tion, it can be used in this prediction task. To find out how it can improve the model, new attributes namely initial behaviour features are created and included in the model. These features are characteristics of retweet behaviour after new tweet appeared. The following table contains created features:
Table 6. Initial behaviour features description
Feature Description
Current retweet count Number of retweets of the message happened in the given initial time period
Time alive of message Period of time since the original message appeared till the last retweet in the given initial time period
Tweet rate Number of retweets in the time frame of one hour divided
by time alive of message in the given initial time period
Mean difference between retweets
Mean difference between retweets in the given initial time period
Max difference between re-tweets
Max difference between retweets in the given initial time period
In addition, network of user followers and friends can contribute much to improvement of the model. It was considered that this information cannot be used for making a prediction model for newly created tweet as we cannot ‘look in the future’. Therefore, the following features were added using only available information from respective initial time period. We added these features using information of each user who had retweeted a message and added these features to an original tweet data. The features are described in the table:
Table 7. Initial behaviour features (from user network) description
Feature Description
Subfollowers Number of people who follow users who retweeted an original tweet in the given initial time period
Subfriends Number of people who follow users who retweeted an original tweet in the given initial time period
23 6.4 Splitting and cross-validation
As for any prediction task in machine learning, the data has to be split in training and testing sets. The basic approach is to set 80% for training data and 20% for testing randomly. To reproduce same samples and then obtain comparable results for all created models, random seed was set before partitioning. Considering that the information propagation diffusion pre-diction task is oriented on future popularity of a message it seems more reasonable to split by time when tweets appeared. However, it was studied in [29] that there is no significant difference between random and chronological splitting methods for this particular predic-tion task. In addipredic-tion, the first method allows to perform k-fold cross-validapredic-tion which makes prediction model more resistant and effective. Cross-validation [30] is a technique that reserves a part of data on which a model is not trained. K-fold cross-validation randomly creates k samples of data, and trains model multiple times so that each k-th fold serves as a test set.
K-fold cross-validation was used as the most suitable method to improve model perfor-mance. The choice of k value is important and should be not too low and not too high. Lower value can lead to missing some significant patterns in dataset but higher value can be mis-leading because of huge influence of small folds (or even single data points) that might be outliers. Number of k closer to number of observations leads to Leave one out cross valition (LOOCV) which is extremely time-consuming for large datasets. For our training da-taset with quite big number of observations, the most popular value of k =10 was used. In addition, experiments were done using repeated cross validation n=5 number of repeats. The last method performs the same k-fold validation and repeats it with differently split folds.
24
7
Description of models and results evaluation
In this chapter the models built for the given prediction task are described and the perfor-mance results are analysed. The question if a message is retweeted or not is studied using binary and multiclass prediction tasks.
7.1 Binary classifier
The most basic approach to predict tweet popularity is binary classification task which shows if the message is retweeted or not. Binary classification is a supervised learning task of classifying a data record into one of two predefined groups. The labels of classes are de-fined as explained in the section 6.2. Four popular machine learning algorithms were used for this task: Random Forest, Logistic Regression, Gradient Boosting Machine and Ada-boost. the choice of two of them (Random Forest, Logistic Regression) is based on previous studies and two boosting algorithms are added on top.
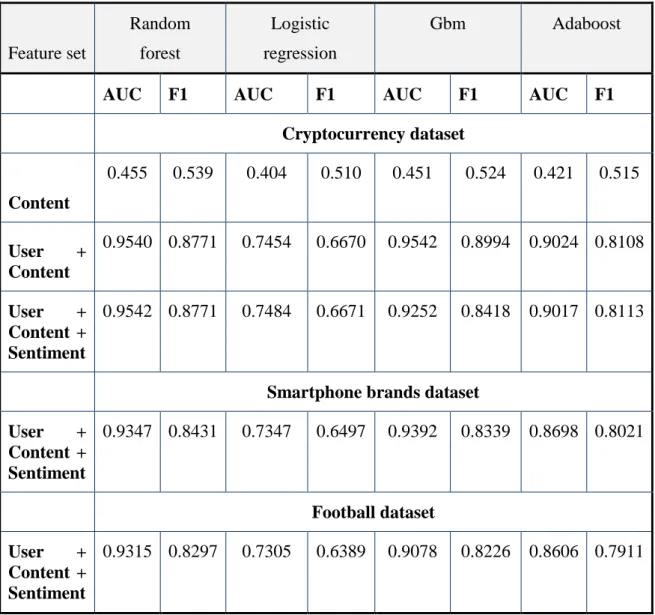
First, we tried to see is it possible to use only content of a message to predict if a tweet is retweeted. Then, we took User and Content features (basic tweet features). Sentiment fea-tures were added in the next round of experiments. The following table shows the evaluation summary of results.
Table 8. Performance results of binary classification
Feature set Random forest Logistic regression Gbm Adaboost
AUC F1 AUC F1 AUC F1 AUC F1
Cryptocurrency dataset Content 0.455 0.539 0.404 0.510 0.451 0.524 0.421 0.515 User + Content 0.9540 0.8771 0.7454 0.6670 0.9542 0.8994 0.9024 0.8108 User + Content + Sentiment 0.9542 0.8771 0.7484 0.6671 0.9252 0.8418 0.9017 0.8113
Smartphone brands dataset
User + Content + Sentiment 0.9347 0.8431 0.7347 0.6497 0.9392 0.8339 0.8698 0.8021 Football dataset User + Content + Sentiment 0.9315 0.8297 0.7305 0.6389 0.9078 0.8226 0.8606 0.7911
25
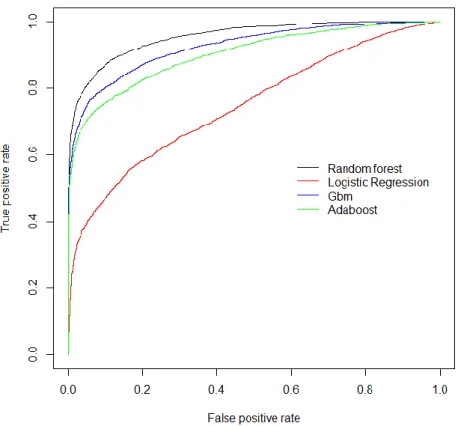
Content features alone did not show good results so we can conclude that we definitely need other feature sets to have an effective prediction model. Therefore, we will not use this sep-arate feature set in our next experiments. We can compare results with and without senti-ment features in binary classification. The graphical representation AUC values is shown as a ROC-curves comparing results from the all algorithms in Cryptocurrency dataset.
26
Figure 5. ROC-curves of the models with User + Content + Sentiment feature set Generally, the models showed high results in evaluation of AUC values. However, there is almost no difference in results between two feature sets, so adding sentiment features did not contribute much to prediction models. Considering the fact that the produced values are almost the same, four decimal places are set to see the difference. The obtained AUC and F1 values are worse with complete feature set for gradient boosting model and AUC value is slightly lower in Adaboost model. The reason could be that boosting algorithm behave worse in this case in the opposite to, for example, bagging algorithms like Random Forest which showed the best results for both AUC and F1. These results are surprisingly better than in the previous research [1] (we can compare by F1 measure) that can be also caused by the nature of the dataset as well as the model parameters and used features.
Feature importance
Each algorithm chooses informative features differently. Below, the plot shows importance of the model with the best performance (from AUC value) – Random Forest.
Variable importance is calculated using the mean decrease in Gini index, and expressed relative to the maximum.
27
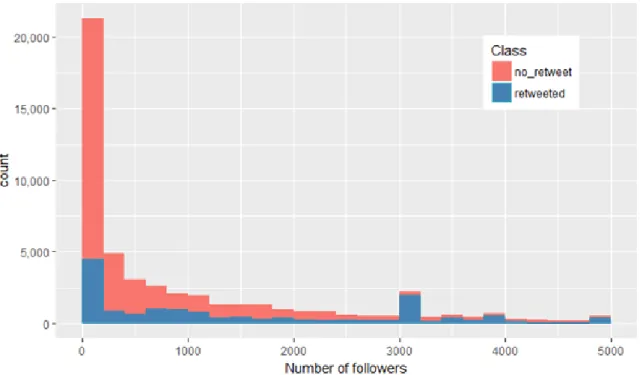
Figure 6. Feature importance Random Forest (top 10)
The most important feature as expected is Followers count. From the following plot, it is obvious that bigger part of messages of people with number of followers close to zero are not retweeted.
28 7.2 Multiclass classifier
Instead of predicting the exact value of retweeets, we divided the messages into four classes as described in section 6.2. We used the same Random Forest and Gbm algorithms and other new algorithms Xgboost and Treebag for this purpose. After evaluating the first dataset on Cryptocurrency, we used complete feature set for the two others. The following table shows the summary of results of multiclass prediction task.
Table 9. Performance results of multiclass prediction
Fea-ture
set
Random Forest Gbm Xgboost Treebag
Acc F1 Acc F1 Acc F1 Acc F1
Cryptocurrency dataset User + Content 0.6024 0.6741 0.4820 0.5830 0.5013 0.5991 0.5879 0.6816 User + Content + Senti-ment 0.6037 0.6898 0.4822 0.5924 0.5110 0.6638 0.5907 0.6682
Smartphone brands dataset
User + Content + Senti-ment 0.6011 0.6823 0.4696 0.581 0.5014 0.6532 0.5827 0.6777 Football dataset User + Content + Senti-ment 0.5799 0.6645 0.4683 0.5745 0.5010 0.6612 0.5789 0.6725
From the summary table above we can conclude that Random Forest and Treebag algorithms performed better than Xgboost and Gbm. Random Forest showed the best both performance metrics. However, it is important to look on the performance of each single class. Confusion tables are good visualisation for this purpose as we can spot prediction errors easily. The better is a classifier, the darker colour is in the diagonal of the tables. Confusion matrices of two best models are shown below.
29
Random Forest Treebag
F
Figure 8. Confusion matrix of multiclass classification (User + Content features) Bagging algorithms confirmed their good performance by each class as well. Other algo-rithms showed worse performance overall (as seen from the table 9 above) and by each class. However, the edge classes (High and Very low) are predicted quite good in all algo-rithms – up to 72% of accuracy of one class.
Random Forest Treebag
Figure 9. Confusion matrix (User + Content + Sentiment features)
Since there are many performance metrics that can be obtained from confusion matrix we focus more on ones selected for this prediction task. The following visualization shows F-measure for each class and model, which confirms Random Forest to be the best algorithm.
30
Figure 10. Comparison of models F-measure among all classes (User + Content + Senti-ment features)
Sentiment features contributed to slightly better overall performance in multiclass predic-tion comparing to binary. However, looking at each class separately, we can conclude that they didn’t bring a significant improvement. They could make a model more stable so we need to see the feature importance values.
Feature importance
The following graph shows ordered importance of the best model of used features. Random Forest showed the best results in multiclass prediction task, too. Other algorithms have their own order of important features that is not presented here but it is worth to note that first 5-7 features are the same across all the models.
31
Figure 11. Feature importance of Random Forest with User + Content + Sentiment features (top 20)
Group of first 8 features have relatively high level of significance comparing to others. These are 5 User features and 3 three Content features. Positive sentiment is the most im-portant from Sentiment feature set for the prediction.
7.3 Predicting tweet popularity using initial retweet behaviour features This part of analysis requires usage of time features introduced in section 6.3. These features are irrelevant for binary classification and they were not used for that purpose. However, these features most likely boost the performance for multiclass prediction as they could give more accurate result for each class of target variable. Moreover, it was studied how perfor-mance changes with increasing of this initial time range. Analysing this, we obtained the point of time range after which there is no significant change in performance of prediction model. We defined the following thresholds for the analysis: 1, 2, 3, 4, 5, 10, 30, 60 minutes. Since the Random Forest algorithm showed the best performance and this type of analysis is more complex than previous one, we decided to compare output for our datasets using just Random Forest.
Importance excl.mark_number disgust retweeted_status.user.verifiedTrue sadness anger surprise fear joy negative anticipation trust mention_number positive url_number hashtag_number words_number text_length user.statuses_count from_user_listed user.friends_count account_age user.followers_count 0 20 40 60 80 100
32
Table 10. Performance results of multiclass prediction with initial behaviour features
Dataset Cryptocurrency Smartphone brands Football
Initial be-haviour time range
Acc F1 Acc F1 Acc F1
1 min 0.626 0.726 0.611 0.685 0.579 0.680 2 min 0.643 0.728 0.631 0.692 0.587 0.685 3 min 0.651 0.729 0.646 0.696 0.594 0.689 4 min 0.655 0.746 0.653 0.710 0.602 0.697 5 min 0.656 0.747 0.655 0.717 0.606 0.702 10 min 0.656 0.748 0.658 0.724 0.611 0.709 30 min 0.659 0.752 0.661 0.729 0.614 0.713 60 min 0.674 0.764 0.667 0.738 0.622 0.722
As expected, the performance increases with increasing the initial time range. Comparing 1min and 60 min period, accuracy increased by 4.8% and F-measure by 3.8% in Cryptocur-rency testing set. In addition, we can see that even 1 min initial behaviour features improve 2% the accuracy of model from multiclass prediction in section 6.2. Smartphone brands and football datasets worse performance but we still can observe similar improvement trend. Certainly, different datasets have different retweet activity. From the following confusion matrixes, we can see the improvement of prediction by each class. It is clearly seen that the initial time features strongly affect the result, especially detecting well Low and Medium classes that are more difficult to distinguish for an algorithm.
1 min initial behaviour features 60 min initial behaviour features
Figure 12. Confusion matrixes of predictions using different range initial behaviour fea-tures in Cryptocurrency dataset
33
Feature importance
From the previous experiments we found out several most significant features for prediction. Considering the fact that initial time features improved the results we can see how the order of importance changes. The following visualisations show Feature importance of 1min and 60 min initial time feature set. Twenty biggest values out of 27 are displayed.
34
Figure 14. Feature importance (60 min initial behaviour features)
Obviously, current number of retweets gets the first place with increasing of the initial time range. Most of the content and user features like number of followers, number of friends, account age, if user listed or not remain important. Some initial behaviour time features in addition to current count of retweets ranked higher positions in 60 min time interval. They are number of subfollowers and subfriends.
35
7.4 Predicting tweet popularity in the next hour based on previous hour Another approach is predicting behaviour of certain message in the next period of time in the future. For this task it was decided to use one-hour time frame. The process is the fol-lowing: the dataset was reorganized so that the data was divided into one-hour time frames for each unique tweet. Target variable (retweet number) was taken using information of the next hour. The goal is to predict what would happen in the next hour based on the infor-mation about retweet activity from the previous hour.
For this purpose, the same features were used as in previous section 7.3 but they were cre-ated from reorganized one-hour-frame data. Concerning Initial Behaviour features, they were created using whole one-hour time frame data for each original tweet. Therefore, they were used as retweet behaviour characteristics of previous hour. Training and testing sets were adjusted according to this task – observations that already belong to class High in previous hour were removed. Therefore, we could see if observations of Very Low, Low or Medium class can move to High class. Due to additional preprocessing of the data for this task we have less data to train the models than in previous tasks.
The following table gives an overview of the results.
Table 11. Performance results of multiclass prediction of next hour based on previous hour
Dataset Random Forest Gbm Xgboost Treebag
Acc F1 Acc F1 Acc F1 Acc F1
Cryptocur-rency 0.571 0.678 0.513 0.567 0.522 0.581 0.543 0.662
Smartphone
brands 0.563 0.669 0.504 0.558 0.519 0.580 0.538 0.650
Football 0.544 0.654 0.502 0.551 0.513 0.575 0.533 0.645
The performance of the models is worse comparing to multiclass models in previous sec-tions. We can observe that it is difficult to predict tweet popularity using this approach even with four number of classes. This might be caused by the retweeting behaviour of our train-ing data from Cryptocurrency dataset or not sufficient amount of data for this task.
36
8
Conclusions and future work
In this thesis, we studied information diffusion in social media and ways how to predict it. In particular, we analysed Twitter messages and tried to predict their popularity. Retweet count was considered as a measure of tweet popularity.
We extracted 27 features and categorized them into sets namely Content, User, Sentiment, Initial Behaviour and analysed their impact on model prediction results. As expected, we achieved good performance using Content and User sets and out of all features User features showed the highest importance. Surprisingly, sentiments and emotions didn’t bring a sig-nificant improvement of the results.
First, we performed the simplest approach to divide messages into two categories – without retweets and with at least one retweet. Prediction of message popularity for this binary out-come was quite successful. We achieved values of AUC up to 95% and F1 up to 87%. Our next experiments were based on multiclass prediction task which showed how well very low or high retweet number can be predicted. These edge classes showed good performance using Content, User and Sentiment features of up to 72% of accuracy and 70% of F1. How-ever, overall accuracy and F1 are lower (60% and 67% respectively) which is caused by classes with average values of retweet count.
Our another goal was to analyse retweet behaviour in the first minutes of tweet existence and find out how it affects the prediction power of the model. We used all sets of features for this task and discovered that having information even of 5 minutes is enough to increase the overall accuracy value on 5%. In addition, this method allowed to predict average re-tweet value classes more accurately.
One more predictive task was to use tweet behaviour of previous hour in certain point of time and to predict what can happen in the next hour. Basically, we tried to find out if a message gets more retweet or not, based on all the information about this message we have. This task was more challenging and we didn’t obtain a good predictive model. A larger dataset certainly would improve the stability and effectiveness of models but it requires more detailed investigation.
We trained and tested our models on one labelled dataset and evaluated results with two additional testing datasets. From the experiments, the performance metrics among three test-ing sets are not deviated much (within the difference of up to 6% in accuracy and 7% in F1) so we can conclude that our models are suitable for any Twitter data.
Following are some of the suggestions for the future work:
- It can be studied if people retweet more when they see that a message is already popular.
- User profile is influential on predictive performance so it can be studied better to extract more useful features. For example, in our research, we used information about people who retweeted a message and did not use information about all friends of a tweets author. Correlation between friends-retweeters and strangers-retweeters can be also included.
- Since sentiment features did not bring a significant improvement to our models, it could be due to errors in sentiment extraction. This process can be performed better, taking into account specific domain, evaluating emoji and so on.
37
- Instead of retweet count, another measure of popularity can be studied in the similar way. For example, it can be predicted how many comments a tweet can get or how many minutes/hours needed to obtain a certain number of retweets or comments.
38
9
References
[1] Liangjie Hong, Ovidiu Dan, Brian D. Davison, “Predicting Popular Messages in Twitter,” in 20th international conference companion on World wide web, Hyderabad, India, 2011.
[2] Nasir Naveed, Thomas Gottron, Jérôme Kunegis, Arifah Che Alhadi, “Bad News Travel Fast: A Content-based Analysis of Interestingness on Twitter,” in 3rd International Web Science Conference, Koblenz, Germany, 2011.
[3] Jiang Yang, Scott Counts, “Predicting the Speed, Scale, and Range of Information Diffusion in Twitter,” in Fourth International Conference on Weblogs and Social Media, Washington, DC, USA, 2010.
[4] Eleanna Kafeza, Andreas Kanavos, Christos Makris, Pantelis Vikatos., “ Predicting Information Diffusion Patterns in Twitter.,” in 10th IFIP International Conference on Artificial Intelligence Applications and Innovations (AIAI), Rhodes, Greece, 2014.
[5] Io Taxidou, Peter M. Fischer, “Online analysis of information diffusion in twitter,” in 23rd International Conference on World Wide Web, Seoul, Korea, 2014. [6] Andrey Kupavskii, Liudmila Ostroumova, Alexey Umnov, Svyatoslav Usachev,,
“Prediction of Retweet Cascade Size over Time,” in CIKM, Moscow, Russia, 2012. [7] Zubair Shafiq, Alex Liu, “Cascade Size Prediction in Online Social Networks,” in
2017 IFIP Networking Conference (IFIP Networking) and Workshops, Stockholm, 2017.
[8] Zhang, Qi and Gong, Yeyun and Wu, Jindou and Huang, Haoran and Huang,
Xuanjing, “Retweet Prediction with Attention-based Deep Neural Network,” in 25th ACM International on Conference on Information and Knowledge Management, Indianapolis, Indiana, USA , 2016.
[9] Samad Mohammad, Aghdam Nima, Jafari Navimipour, “Opinion leaders selection in the social networks based on trust relationships propagation,” Karbala
International Journal of Modern Science, vol. 2, no. 2, pp. 88-97, 2016. [10] Meeyoung Cha, Hamed Haddadi, Fabricio Benevenuto, Krishna P. Gummadi,
“Measuring User Influence in Twitter: The Million Follower Fallacy,” in Fourth International AAAI Conference on Weblogs and Social Media, 2010 .
[11] Jundong Chen, He Li, Zeju Wu, “Sentiment analysis of the correlation between regular tweets and retweets,” in 2017 IEEE 16th International Symposium on Network Computing and Applications (NCA), Cambridge, MA, USA, 2017. [12] Andreas Kanavos, Isidoros Perikos, Pantelis Vikatos, Ioannis Hatzilygeroudis,,
“Modeling ReTweet Diffusion Using Emotional Content,” in 10th IFIP
International Conference on Artificial Intelligence Applications and Innovations, Rhodes, Greece, 2014.
[13] Stefan Stieglitz, Linh Dang-Xuan, “Emotions and Information Diffusion in Social Media—Sentiment of Microblogs and Sharing Behavior,” Journal of Management Information Systems, vol. 29, no. 4, pp. 217-248, 2013.
[14] Bo Wu, Haiying Shen, “Analyzing and predicting news popularity on Twitter,” International Journal of Information Management, vol. 35, pp. 702-711, 2015. [15] Kyota Okubo, Kazumasa Oida, “A Successful Advertising Strategy over Twitter,”
39
[16] Cheung, Ming and She, James and Junus, Alvin and Cao, Lei, “Prediction of Virality Timing Using Cascades in Social Media,” vol. 13, January 2017.
[17] Mazloom, Masoud and Rietveld, Robert and Rudinac, Stevan and Worring, Marcel and van Dolen, Willemijn, “For advertisement purposes it leads to bigger number of page reviews, if there is a link to a website in a tweet.,” in Proceedings of the 2016 ACM on Multimedia Conference, Amsterdam, 2016.
[18] Johan Bollen, Huina Mao, Xiaojun Zeng, “Twitter mood predicts the stock market,” Journal of Computational Science, vol. 2, no. 1, pp. Pages 1-8, 2011.
[19] Mahmud Hasan, Mehmet A Orgun, and Rolf Schwitter, “A survey on real-time event detection from the Twitter data stream,” Journal of Information Science, 17 March 2017.
[20] Xiaoming Zhang, Xiaoming Chen, Yan Chen, Senzhang Wang, Zhoujun Li, Jiali Xia, “Event detection and popularity prediction in microblogging,” vol. 149, pp. 1469-1480, 2015.
[21] Takeshi Sakaki, Makoto Okazaki, Yutaka Matsuo, “Earthquake Shakes Twitter Users: Real-Time Event Detection by Social Sensors,” in Proceedings of the 19th International Conference on World Wide Web, Raleigh, North Carolina, USA, 2010. [22] D. R. Cox, “The Regression Analysis of Binary Sequences,” Journal of the Royal
Statistical Society. Series B (Methodological), vol. 20, no. 2, pp. 215-242, 1958. [23] P. Bühlmann, Bagging, Boosting and Ensemble Methods, Z ̈urich, Switzerland,
2012.
[24] Mason, Llew and Baxter, Jonathan and Bartlett, Peter and Frean, Marcus, “Boosting algorithms as gradient descent,” in 12th International Conference on Neural
Information Processing Systems, Cambridge, MA, USA, 1999.
[25] T. K. Ho, “Random Decision Forests,” in 3rd International Conference on Document Analysis and Recognition, Montreal, QC, 1995.
[26] Freund, Yoav and Schapire, Robert E., “Experiments with a New Boosting
Algorithm,” in Thirteenth International Conference on International Conference on Machine Learning, San Francisco, CA, USA, 1996.
[27] J. H. Friedman, Greedy Function Approximation: A Gradient Boosting Machine, 1999.
[28] Tianqi Chen, Carlos Guestrin, “XGBoost: A Scalable Tree Boosting System,” in 22Nd ACM SIGKDD International Conference on Knowledge Discovery and Data Mining, New York, NY, USA, 2016.
[29] F. Sarabchi, Quantitative Prediction of Twitter Message Dissemination: A Machine Learning Approach, Delft, 215.
[30] R. Kohavi, “A study of cross-validation and bootstrap for accuracy estimation and model selection,” in Fourteenth International Joint Conference on Artificial Intelligence. , San Mateo, CA: Morgan Kaufmann., 1995.
40
Appendix
I. Hyperparameters used for the models
The models were built using Caret5 package in R with the following set of parameters. Table 12. Hyperparameters used for the models
Binary predic-tion model Multiclass pre-diction model (3 feature sets) Multiclass prediction adding initial tweet behaviour features Multiclass pre-diction model for a next hour
frame Random forest method = 'rf' ntree = 500 mtry = 6 ntree = 500 mtry = 12
For all models with different initial time range: ntree = 500 mtry = 15 ntree = 500 mtry = 12 Logistic regression method = 'glm' no tuning param-eters - - -
Adaboost method = 'ada' iterations = 150 maxdepth = 3 nu = 0.1 - - - Gbm method = 'gbm' n.trees = 150 interaction.depth = 3 shrinkage = 0.1 n.minobsinnode = 10 n.trees = 150 interaction.depth = 3 shrinkage = 0.1 and n.minobsinnode = 1 0 - n.trees = 150 interaction.depth = 3 shrinkage= 0.1 n.minobsinnode = 1 0
Xgboost - method = 'xgbTree' nrounds = 150 max_depth = 3 eta = 0.4 gamma = 0 colsample_bytree = 0.6 - nrounds = 150 max_depth = 3 eta = 0.4 gamma = 0 colsample_bytree = 0.6