R E S E A R C H
Open Access
Development and psychometric properties of a
questionnaire to assess barriers to feeding
critically ill patients
Naomi E Cahill
1,3*, Andrew G Day
3, Deborah Cook
4, Daren K Heyland
1,2,3, On behalf of the Canadian Critical Care
Trials Group
Abstract
Background:To successfully implement the recommendations of critical care nutrition guidelines, one potential approach is to identify barriers to providing optimal enteral nutrition (EN) in the intensive care unit (ICU), and then address these barriers systematically. Therefore, the purpose of this study was to develop a questionnaire to assess barriers to enterally feeding critically ill patients and to conduct preliminary validity testing of the new instrument.
Methods:The content of the questionnaire was guided by a published conceptual framework, literature review, and consultation with experts. The questionnaire was pre-tested on a convenience sample of 32 critical care practitioners, and then field tested with 186 critical care providers working at 5 hospitals in North America. The revised questionnaire was pilot tested at another ICU (n = 43). Finally, the questionnaire was distributed to a random sample of ICU nurses twice, two weeks apart, to determine test retest reliability (n = 17). Descriptive statistics, exploratory factor analysis, Cronbach alpha, intraclass correlations (ICC), and kappa coefficients were conducted to assess validity and reliability.
Results:We developed a questionnaire with 26 potential barriers to delivery of EN asking respondents to rate their importance as barriers in their ICU. Face and content validity of the questionnaire was established through literature review and expert input. The factor analysis indicated a five-factor solution and accounted for 72% of the variance in barriers: guideline recommendations and implementation strategies, delivery of EN to the patient, critical care provider attitudes and behavior, dietitian support, and ICU resources. Overall, the indices of internal reliability for the derived factor subscales and the overall instrument were acceptable (subscale Cronbach alphas range 0.84–0.89). However, the test retest reliability was variable and below acceptable thresholds for the majority of items (ICC’s range−0.13 to 0.70). The within group agreement, an indices reflecting the reliability of aggregating individual responses to the ICU level was also variable (ICC’s range 0.0 to 0.82).
Conclusions:We developed a questionnaire to identify barriers to enteral feeding in critically ill patients. Additional studies are planned to further revise and evaluate the reliability and validity of the instrument.
Keywords:Barriers, Critical care, Factor analysis, Guideline implementation, Instrument development, Nutrition, Reliability, Validity
* Correspondence:[email protected] 1
Department of Public Health Sciences, Queen’s University, Carruthers Hall, Kingston, Ontario, Canada
3
Clinical Evaluation Research Unit, Kingston General Hospital, Stuart Street, Kingston, Canada
Full list of author information is available at the end of the article
Background
Clinical practice guidelines (CPGs) focusing on nutrition therapy for mechanically ventilated critically ill patients have been developed to assist practitioners in the inten-sive care unit (ICU) manage the rapid proliferation of new information in this area, and make informed feeding decisions [1-5]. However, despite the publication and dissemination of these CPGs, there is considerable variation in nutrition practice across ICUs. Large gaps exist between many recommendations and observed practice [6-10]. Consequently, on average, the delivery of nutrition is suboptimal, with patients only receiving 59% of the calories that they are prescribed [10]. Adopting the practices recommended by these guide-lines is associated with significant reductions in length of stay, infectious complications, and mortality [11-13]. Consequently, efforts to implement guideline recom-mendations and narrow this gap in quality care are warranted [14].
Understanding the barriers to change is key to opti-mal healthcare delivery [15]. Tailoring guideline imple-mentation interventions to address identified barriers to nutrition guideline implementation may be a more effective strategy than the ‘one size fits all’ approach adopted previously in this area [16-19]. However, to identify barriers to change, valid, reliable assessment methods are needed [20].
Barriers may be identified using quantitative and quali-tative methods, including observation, focus group dis-cussions, interviews, surveys of providers, or through analysis of the organization or system. Each method has strengths and weaknesses, although surveys have the ad-vantage of enabling data collection on a large represen-tative sample of providers and tracking change across time. A recent systematic review of 256 studies evaluat-ing barriers to guideline adherence [15], observed that most of these studies (n = 178) used a questionnaire to identify barriers. However, the survey-type instruments adopted in these studies were not rigorously designed. While several questionnaires have undergone some psy-chometric testing [21-24], they were primarily developed for specific guidelines (e.g., hand hygiene), certain pro-fessional groups (e.g., nurses), or unique clinical contexts (e.g., primary care). Therefore, the suitability of these questionnaires for administration to multidisciplinary critical care providers is uncertain. Furthermore, it has been proposed that to be useful for selecting tailored in-terventions, barriers need to be measured specific to the type of innovation and local context [25].
The objective of this report is to describe the develop-ment and psychometric evaluation of a questionnaire designed to assess barriers to adherence to critical care nutrition guidelines for enterally feeding critically ill patients.
Methods
Conceptual framework
Cabana et al. reviewed 76 studies that assessed the po-tential barriers to physician adherence to CPGs and as-similated the results into a framework [26]. We selected this framework to guide our research because it aligned with our specific objective of identifying barriers to guideline adherence. We adopted a case study approach [27] to revise and extend this framework and make it more applied to barriers to adherence to nutrition guidelines in the ICU and to include both individual provider level and system level barriers [28]. Several other authors have also revised and expanded this framework to make it more applicable for specific guide-lines or innovations [15,29-31].
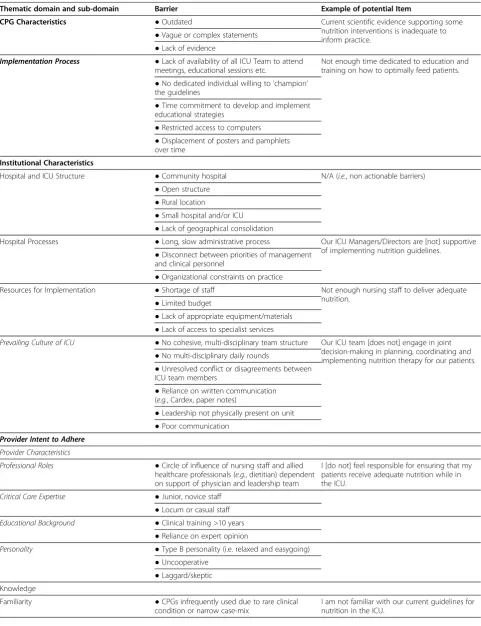
Table 1 Framework for adherence to critical care nutrition clinical practice guidelines
Thematic domain and sub-domain Barrier Example of potential Item
CPG Characteristics ●Outdated Current scientific evidence supporting some
nutrition interventions is inadequate to inform practice.
●Vague or complex statements ●Lack of evidence
Implementation Process ●Lack of availability of all ICU Team to attend meetings, educational sessions etc.
Not enough time dedicated to education and training on how to optimally feed patients. ●No dedicated individual willing to‘champion’
the guidelines
●Time commitment to develop and implement educational strategies
●Restricted access to computers ●Displacement of posters and pamphlets over time
Institutional Characteristics
Hospital and ICU Structure ●Community hospital N/A (i.e., non actionable barriers) ●Open structure
●Rural location
●Small hospital and/or ICU ●Lack of geographical consolidation
Hospital Processes ●Long, slow administrative process Our ICU Managers/Directors are [not] supportive of implementing nutrition guidelines.
●Disconnect between priorities of management and clinical personnel
●Organizational constraints on practice
Resources for Implementation ●Shortage of staff Not enough nursing staff to deliver adequate nutrition.
●Limited budget
●Lack of appropriate equipment/materials ●Lack of access to specialist services
Prevailing Culture of ICU ●No cohesive, multi-disciplinary team structure Our ICU team [does not] engage in joint decision-making in planning, coordinating and implementing nutrition therapy for our patients. ●No multi-disciplinary daily rounds
●Unresolved conflict or disagreements between ICU team members
●Reliance on written communication (e.g., Cardex, paper notes)
●Leadership not physically present on unit ●Poor communication
Provider Intent to Adhere
Provider Characteristics
Professional Roles ●Circle of influence of nursing staff and allied
healthcare professionals (e.g., dietitian) dependent on support of physician and leadership team
I [do not] feel responsible for ensuring that my patients receive adequate nutrition while in the ICU.
Critical Care Expertise ●Junior, novice staff
●Locum or casual staff
Educational Background ●Clinical training >10 years
●Reliance on expert opinion
Personality ●Type B personality (i.e. relaxed and easygoing)
●Uncooperative ●Laggard/skeptic Knowledge
Familiarity ●CPGs infrequently used due to rare clinical condition or narrow case-mix
Individual interview summaries and the framework were sent to each key informant who participated in the case study for review and feedback. In addition, we held two face-to-face meetings with experts in the content area (i.e., ICU physicians and providers specializing in nutrition—e.g., dietitians, nurses, and physicians—re-spectively), and presented our findings to them to assess the comprehensiveness, clarity, and face validity of the de-veloped framework.
Item generation
The purpose of the questionnaire was to assess barriers to be targeted for change through a tailored guideline implementation strategy [19]. To this end, we intended the questionnaire to be administered to individual pro-viders to determine their perception of the barriers to enterally feeding patients in the ICU in which they pri-marily work. To maximize the usefulness of the ques-tionnaire, a priori it was decided to focus only on barriers that are amenable to change and can be targeted by intervention strategies to improve practices, rather than non-actionable barriers (e.g., patient case-mix).
Acknowledging that national or society guidelines are frequently adapted locally, the questionnaire did not refer to any specific set of published ICU nutrition guidelines but asked respondents to refer to the guide-lines currently being used to inform decisions about feeding in their respective ICUs. In addition, we focused on recommendations related to enteral nutrition (EN) only, rather than parenteral nutrition, nutrient supple-mentation, or nutritional assessment, because these rec-ommendations are uniformly endorsed across published guidelines [1-5], are supported by the highest level of evidence, and ICU providers generally agree with the recommendations [37].
In addition to our conceptual framework [28], poten-tial items were identified through a literature review of studies of barriers to guideline adherence and by exam-ining the content of existing barrier questionnaires de-veloped in other settings [21-24]. This initial list of potential items was circulated to experts to obtain in-put on item comprehensiveness and wording. Redundant or irrelevant items (i.e., represented non-modifiable bar-riers, or were not applicable to the ICU) were eliminated.
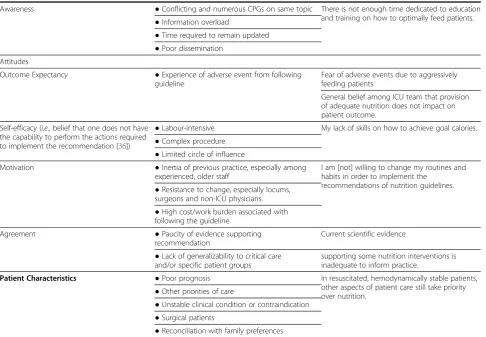
Table 1 Framework for adherence to critical care nutrition clinical practice guidelines(Continued)
Awareness ●Conflicting and numerous CPGs on same topic There is not enough time dedicated to education and training on how to optimally feed patients. ●Information overload
●Time required to remain updated ●Poor dissemination
Attitudes
Outcome Expectancy ●Experience of adverse event from following guideline
Fear of adverse events due to aggressively feeding patients.
General belief among ICU team that provision of adequate nutrition does not impact on patient outcome.
Self-efficacy (i.e., belief that one does not have the capability to perform the actions required to implement the recommendation [36])
●Labour-intensive My lack of skills on how to achieve goal calories. ●Complex procedure
●Limited circle of influence
Motivation ●Inertia of previous practice, especially among experienced, older staff
I am [not] willing to change my routines and habits in order to implement the
recommendations of nutrition guidelines. ●Resistance to change, especially locums,
surgeons and non-ICU physicians. ●High cost/work burden associated with following the guideline
Agreement ●Paucity of evidence supporting
recommendation
Current scientific evidence
●Lack of generalizability to critical care and/or specific patient groups
supporting some nutrition interventions is inadequate to inform practice.
Patient Characteristics ●Poor prognosis In resuscitated, hemodynamically stable patients, other aspects of patient care still take priority over nutrition.
●Other priorities of care
●Unstable clinical condition or contraindication ●Surgical patients
●Reconciliation with family preferences
Following item generation and reduction, in December 2009, a draft paper-based version of the questionnaire composed of 62 items, including 53 potential barriers, di-vided into four sections was pre-tested with a convenience sample of 32 critical care practitioners (11 physicians, 11 nurses, and 10 dietitians) from across Canada. Based on this pre-test, the questionnaire was revised and reduced further to 49 items, including 39 potential barriers, divided into four parts (Additional file 1).
Part A consisted of general questions about the ICU environment and the implementation of guidelines (nine items). Part B asked respondents about their level of agreement with the recommendations of critical care nu-trition CPGs pertaining to enteral feeding (eight items). Part C focused on barriers to delivering adequate amounts of EN (22 items). Each item in Part A, B, and C used a seven-point Likert scale, to maximize the po-tential to discriminate among barriers and to allow a neutral response [35]. The items in Part A and B were formulated positively and end-anchored by the adjectives ‘1 = fully disagree’ and ‘7 = fully agree’ and included a ‘don’t know’option. Parts A and B were intended to as-sess attitudes towards nutrition in general and the guide-line recommendations specifically, because attitudes may influence an individual’s intention to feed and subse-quent behavior, such that lack of agreement with these items indicates a barrier to feeding critically ill patients. The items in Part C were formulated negatively and end-anchored with the adjectives ‘1 = not at all import-ant’and‘7 = very important’, with ‘very important’ indi-cating that the item is a major barrier and ‘not important’indicating that it is not a barrier in their ICU. Each item in Part A, B, and C maps on to one of the five domains of the framework. In addition, Part C included four open-ended questions asking respondents to list additional important barriers to delivering adequate EN in their ICU, to list the most important barriers in their ICU, and to highlight strategies to overcome these bar-riers. In Part D (six items), characteristics of the re-spondent are captured.
Field test
The sampling pool for field testing was provided by seven ICUs from five hospitals in North America who were participating in a pre-test post-test study evaluating the feasibility of a tailored guideline implementation strategy (The PERFECTIS study [ClinicalTrials.gov iden-tifier: NCT01168128]). At each ICU, in March 2010, all full and part-time physicians, nurses, dietitian(s), the Nurse Manager, and the ICU Manager were invited to complete the questionnaire (n = 409). If the nursing pool exceeded 85, a random sample of 60 nurses was used. To maximize the response rate, the questionnaire was distributed according to a modified Dillman’s tailored
design method [38], and respondents were provided with the option of completing a web-based (survey monkey [39]), electronic (fillable pdf ), or paper-based version of the questionnaire.
On-site observational visits
To confirm the results of the field testing and further re-fine the questionnaire, in May and June 2010 we con-ducted on-site observational visits at all five hospitals in the field test. Half-day focus groups were completed with ICU physician and nursing leaders, bedside nurses, and dietitian(s). Participants were first asked to reflect on EN provision in their ICU and identify areas where they perform well and areas for improvement. During these discussions, we explored the reasons (i.e., barriers and enablers) for high or poor performance. Attendees were asked to rank the identified barriers in order of their negative impact on the provision of nutrition (i.e., considering the degree of delay it caused and the fre-quency of its occurrence). Results of the barriers ques-tionnaire were then presented to the group and the top ten ranked barriers from the questionnaire were com-pared with the rankings provided by attendees in the earlier discussion. A detailed report of these on-site visits is published elsewhere [40].
Data analysis to determining the psychometric properties of the questionnaire
First, we conducted a descriptive analysis (e.g., missing data, variance, mean, histograms etc.). The frequency of response was examined, and items with a non-response of greater than 10% were reviewed and consid-ered for re-wording or eliminated. The standard frequency distributions of responses to each item in the question-naire were then examined for floor and ceiling effects. Items with a very high (>0.8) or low (<0.2) endorsement frequency (i.e., proportion of respondents responded‘fully agree’,‘agree’, or‘somewhat agree’in Part A or B and‘’very important’, ‘important’, or‘somewhat important’in Part C) were considered for elimination, because responses to these items can be predicted and including them does not im-prove the scales psychometric properties [41].
Exploratory factor analysis
To refine the content of the barriers questionnaire, re-duce the number of items and ensure the most parsimo-nious representation of the underlying constructs, we conducted an exploratory factor analysis.
loadings greater than 0.5 were used, together with the underlying conceptual framework, to identify the num-ber of factors [42]. Factor loadings of >0.5 were consid-ered acceptable for item retention on a single factor [42]. Items that cross-loaded at >0.5 or loaded 0.4 –0.5 on a single factor were evaluated by the research team on a case-by-case basis, retained or eliminated based on the item’s conceptual importance, its unique contribution to the factor, and whether it was strongly related concep-tually to another factor. Following the descriptive and exploratory factor analysis, we revised the questionnaire.
Internal reliability
We examined the reliability of the overall questionnaire and evaluated factor analysis derived subscales using Cronbach’s alpha. As individual questionnaire responses were intended to be aggregated to the ICU level to identify barriers pertinent to the ICU and inform a tailored inter-vention, a minimum overall and subscale co-efficient alpha of 0.8 was considered desirable, and any item for which alpha significantly increased if the item was deleted from the scale was considered for removal [41].
Scoring the questionnaire
As the purpose of the questionnaire was to identify bar-riers to target through a tailored intervention, when scoring the questionnaire we focused on the upper end of the seven-point Likert scale. Item scores were calcu-lated by awarding 1, 2, or 3 points if the respondent identified an item as a‘somewhat important’,‘important’ or ‘very important’ barrier respectively. If an item was rated 1–4 (i.e.,‘not at all important’to ‘neither import-ant or unimportimport-ant’it was awarded 0 points. The barrier score was calculated by dividing the awarded points for each item by the maximum number of potential points (i.e., 3), and multiplied by 100. Each factor identified by the exploratory factor analysis was considered as a sub-scale, so that subscale and overall barriers scores were calculated as the mean score of all items within that sub-scale and mean of all items respectively. Subsequent analyses were conducted using the barriers score.
Aggregating responses to the unit level
To be a useful tool for tailoring interventions it was also important to assess the extent to which individual re-sponses approximate the barriers within their ICU. To this end, respondents were instructed to complete the questionnaire so that responses reflected the average situation in their ICU. To assess whether responses might be aggregated to the ICU level to obtain a single estimate of site-level barriers, we used three indices of within-group agreement and group mean reliability to examine each questionnaire item, subscale, and overall score [43]: intraclass correlation coefficient (1) (ICC [1])
(or Shrout and Fleiss model 1,1 [44]); ICC(2) (or Shrout and Fleiss model 1,k where k = 35 respondents [44]); and the F-test p-value. The variance components to compute the ICCs were calculated using mixed linear regression models with Restricted Maximum Likelihood (REML) estimation, and the F-test p-values were derived from a one-way analysis of variance (ANOVA). The aggregated data were considered reliable if the F tests’p-values were <0.05 indicating that responses differ in different ICUs and/or ICC(2) (an estimate of the reliability of group means) was >0.60 [45]. ICC(1) is the ratio of between-group variance to total variance and is an estimate of the degree of reliability associated with a single providers as-sessment of the unit mean. Values of ICC(1) between 0.05 and 0.20 are typical in organizations [43].
Qualitative analysis
Responses to the open-ended questions were reviewed to determine whether respondents identified barriers that were not already included in Part C.
We reviewed minutes from the focus group sessions at the five field test sites for evidence supporting content and construct validity (i.e., to identify additional barriers, and evaluate if themes emerging from the focus groups mapped on to the identified factor structure).
Pilot testing
Following completion of the analysis of the field test data, the research team met to review the results and re-vise the questionnaire. A rere-vised version of the barriers questionnaire was circulated to ICU providers who had provided feedback on earlier drafts during the pre-test and field test. In March 2011, the final version of the barriers questionnaire was pilot-tested in a simple ran-dom sample of 60 providers working in a 20 bed closed ICU at a 404 bed teaching hospital in Canada. Using an open-ended format, respondents were asked for feed-back and to report the time to completion; we made fur-ther revisions where required.
Test-retest
co-efficients. A kappa of 0.0 – 0.2 was considered poor agreement, 0.2–0.4 as fair agreement, 0.4–0.6 as mod-erate agreement, 0.6–0.8 as substantial agreement, and 0.8–1.0 as perfect agreement [47]. To further assess the degree of agreement and to identify potential bias Bland and Altman plots were also produced [48].
Sample size
A priori, we estimated that each ICU participating in the field test would have approximately 80 staff members to whom the questionnaire would be distributed, and that the response rate would be approximately 50%, giving a sample size of 280 and a sample size to item ratio of 7 to 1. This sample size surpasses the recommended mini-mum of 150 cases and a sample size to number of items ratio of no lower than 4 to 1 for exploratory factor ana-lysis [49]. For assessment of test retest reliability, we aimed to distribute 60–85 questionnaires, giving a sam-ple of 30 – 43 when accounting for the anticipated re-sponse rate of 50%. This exceeds to 15 – 20 subjects recommended for estimating reliability [50].
Ethical considerations
The Queen’s University Health Sciences and Affiliated Teaching Hospitals Research Ethics Board, Kingston, Ontario and the seven hospitals participating in the field, pilot, and reliability testing approved this study (REB# EPID-292-09 and DMED-994-06). Return of the com-pleted questionnaire and/or attendance at the focus groups implied informed consent on the part of partici-pating critical care providers.
Results
Field test
Descriptive statistics
A total of 186 completed questionnaires out of 409 dis-tributed questionnaires (45.5%) were received. Tables 2 and 3 describe the characteristics of the five participat-ing hospitals and the field test respondent demographics, respectively.
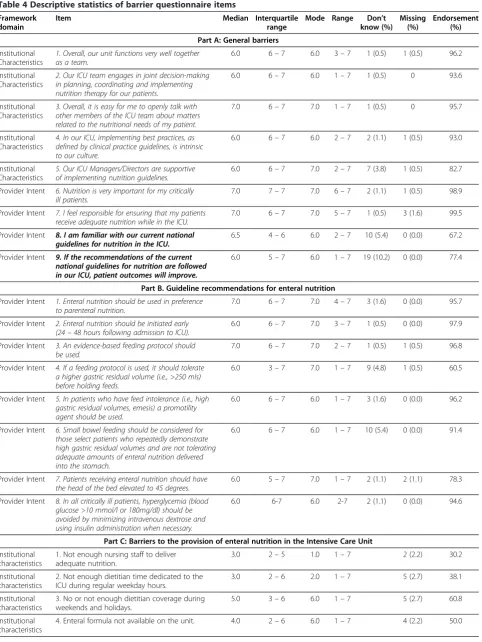
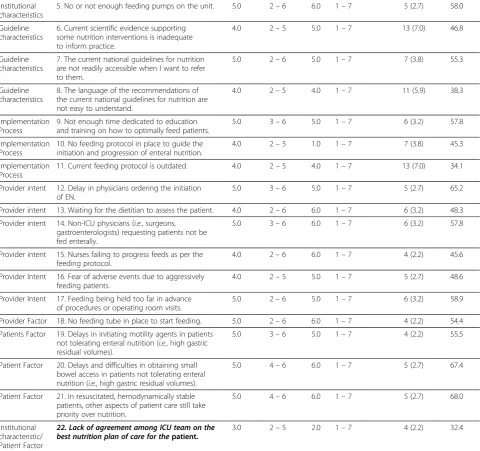
Descriptive statistics of the individual questionnaire items are shown in Table 4. A priori, we planned to
eliminate items with a high proportion of missing data or high endorsement frequency; a commonly applied strategy in initial item reduction [49]. In our field test, the propor-tion of missing values did not exceed 10% for any item, but endorsement frequency was high for the majority of items in Parts A and B. Greater than 80% of respondents agreed with the majority of statements in these sections, resulting in medians skewed to the left and little variance in responses (see Table 4). The endorsement frequency was less that 80% for only 2 items in Part A (A.8 with 67% and A.9 with 77%) and two in Part B (B.4 with 61% and B.7 with 78%). The two items in Part A were retained and reworded to become negative statements (i.e.,‘I am not fa-miliar with our current guidelines for nutrition in the ICU’and ‘General belief among ICU team that provision of adequate nutrition does not impact on patient out-come.’During the on-site focus groups it was highlighted that at some sites the thresholds recommended by these two guideline recommendations in Part B may differ from the local policy documents with which they are familiar (e.g., local policy might tolerate a gastric residual volume of 200 ml not >250 ml as stated in the guidelines or may advocate raising the head of bed to 30 degrees and not 45 degrees as recommended by the guidelines). Based on these observations, we surmised that if the thresholds used in the questionnaire items corresponded to the local thresholds, endorsement would have exceeded 80%, and therefore these items were eliminated.
For the 22 items in Part C, greater variance was ob-served for the majority of items. As a consequence of the overall high endorsement frequency Parts A and B (focused on general barriers and agreement with recom-mendations respectively), were omitted from subsequent psychometric assessment.
Factor analysis
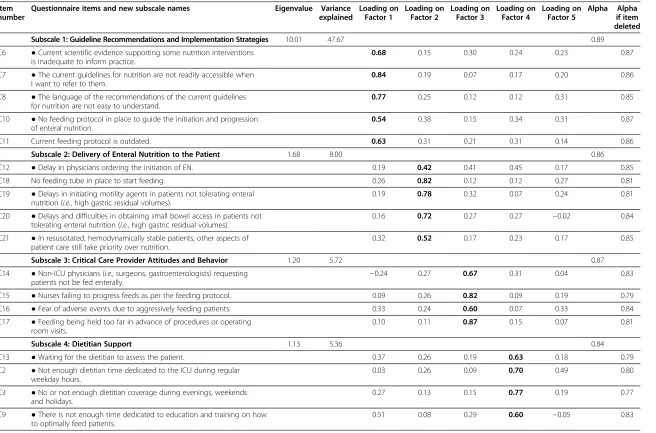
Observations with missing values on any of the items in Part C were omitted from the factor analysis (27 of 186 ob-servations) resulting in 159 respondents for this analysis. The principal components analysis indicated a five-factor solution accounting for 72% of the variance. The eigen-values for each factor and the factor loadings for each item
Table 2 Characteristics of and response rate at the five hospitals participating in the field test
ICU# Country Hospital type Hospital size ICU structure ICU size Response rate n/N (%)
1 USA Non-Teaching 361 Closed& 20 37/73 (50.7)
2 Canada Teaching 497 Closed 16 32/85 (37.7)
3* USA Teaching 600 Open^ 32 36/98 (36.7)
4 Canada Non-Teaching 400 Open 13 29/73 (39.7)
5 Canada Teaching 759 Closed 30 52/80 (65.0)
*Three units combined due to common infrastructure and shared staffing. #
ICU = Intensive Care Unit.
^Open = patient under care of any attending physician. &
after orthogonal rotation are shown in Table 5. The identi-fied factors closely reflected the conceptual framework that guided the development of the barriers questionnaire.
Factor one: guideline recommendations and implementation strategies
‘Guideline recommendations’and ‘Guideline implemen-tation strategies’were identified as two separate domains in the conceptual framework. However, in our factor analysis, the first factor included all six items from these two domains, although item C.9 loaded more heavily on factor three.
Factor two: delivery of EN to the patient
Items associated with the ‘Patient factor’ domain of the conceptual framework were represented in the second factor. Item C.22 did not load on any factor at the cut-off criteria of 0.5 but did load at 0.458 on factor two. However, following feedback at the focus group sessions and discussion among the investigative team, the item was reworded to better reflect the barrier of poor
communication rather than lack of agreement (i.e., ‘Nee-dles delays in relaying information regarding the initi-ation and progression of nutrition’). Item C.22 was therefore omitted from subsequent analyses.A priori,we hypothesized that item C.12 (i.e., Delay in physician or-dering the initiation of EN) would be associated with the ‘critical care provider intent domain.’ In our factor ana-lysis, it did not load on any factor at the cut-off of >0.5 but loaded on factors two, three, and four at 0.42, 0.40, and 0.45 respectively. Despite loading more highly on factor four (Dietitian support), we considered this to be more theoretically aligned with the items in factor two. The title of this factor was changed from‘Patient factor’ to‘Delivery of EN to the patient’to better reflect specific barriers that lead to a delay in EN provision.
Factor three: critical care provider attitudes and behavior
The third factor represented the items associated with the ‘Critical care provider intent’ domain of the frame-work. Two items (C.12 and C.13) originally conceptual-ized to belong to this domain loaded on other factors. The investigative team agreed that the remaining items reflected behaviors that arose from attitudinal beliefs about nutrition and how best to feed ICU patients; therefore the title of this factor was changed to‘Critical care provider attitudes and behavior’ to better reflect this association.
Factor four: dietitian support
Four items referring to the role of the dietitian (C2, C3, C9, C13), identified in numerous domains of the original conceptual framework, were represented by a single fac-tor in the analysis.
Factor five: ICU resources
The fifth factor represented the items associated with the ‘ICU environment’ domain of the original frame-work. The title of this factor was changed to ‘ICU re-sources’ to better reflect that the factor focused on the barrier of inadequate staff and equipment rather than the general environment.
Internal reliability
The Cronbach alpha coefficient for the barriers scale was 0.94. The alpha coefficients for the factor subscales all exceeded the acceptable cut-off of >0.8, ranging from 0.84 to 0.89.The alpha when an item was deleted remained stable for each item, with the exception of one item in factor five (Not enough nursing staff to deliver adequate nutrition) (Refer to Table 5).
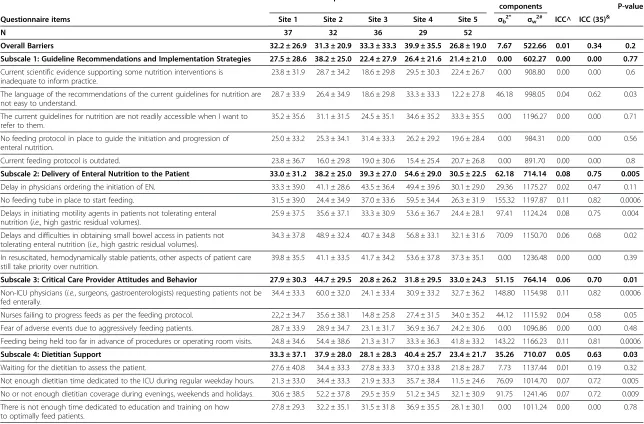
Aggregating responses to the unit level
The variance components and indices to assess the reli-ability of aggregating individual provider responses to Table 3 Personal characteristics of field test sample
Characteristic N (%)
Sex N = 171
Male 28 (16.4)
Female 143 (83.6)
Age N = 172
20–34 75 (43.6)
35–49 68 (39.5)
≥50 29 (16.9)
Clinical Specialty N = 186
Dietitian 25 (13.4)
Nurse 138 (74.2)
Physician 12 (6.5)
Other^ 11 (5.9)
Time dedicated to ICU# N = 173
Full-time 120 (69.4)
Part-time 45 (26.0)
Other& 8 (4.6)
Length of time working in critical care N = 173
0–5 77 (44.5)
6–10 45 (26.0)
11–15 20 (11.6)
>15 31 (17.9)
Leadership role* N = 171
Yes 53 (31.0)
No 118 (69.0)
*Examples of a leadership role include charge nurse, clinical nurse specialist, nurse manager#
ICU = Intensive Care Unit.
^e.g., pharmacist, nurse attendant, student nurse, resident. &
Table 4 Descriptive statistics of barrier questionnaire items
Framework domain
Item Median Interquartile
range
Mode Range Don’t know (%)
Missing (%)
Endorsement (%)
Part A: General barriers
Institutional Characteristics
1. Overall, our unit functions very well together as a team.
6.0 6–7 6.0 3–7 1 (0.5) 1 (0.5) 96.2
Institutional Characteristics
2. Our ICU team engages in joint decision-making in planning, coordinating and implementing nutrition therapy for our patients.
6.0 6–7 6.0 1–7 1 (0.5) 0 93.6
Institutional Characteristics
3. Overall, it is easy for me to openly talk with other members of the ICU team about matters related to the nutritional needs of my patient.
7.0 6–7 7.0 1–7 1 (0.5) 0 95.7
Institutional Characteristics
4. In our ICU, implementing best practices, as defined by clinical practice guidelines, is intrinsic to our culture.
6.0 6–7 6.0 2–7 2 (1.1) 1 (0.5) 93.0
Institutional Characteristics
5. Our ICU Managers/Directors are supportive of implementing nutrition guidelines.
6.0 6–7 7.0 2–7 7 (3.8) 1 (0.5) 82.7
Provider Intent 6. Nutrition is very important for my critically ill patients.
7.0 7–7 7.0 6–7 2 (1.1) 1 (0.5) 98.9
Provider Intent 7. I feel responsible for ensuring that my patients receive adequate nutrition while in the ICU.
7.0 6–7 7.0 5–7 1 (0.5) 3 (1.6) 99.5
Provider Intent 8. I am familiar with our current national guidelines for nutrition in the ICU.
6.5 4–6 6.0 2–7 10 (5.4) 0 (0.0) 67.2
Provider Intent 9. If the recommendations of the current national guidelines for nutrition are followed in our ICU, patient outcomes will improve.
6.0 5–7 6.0 1–7 19 (10.2) 0 (0.0) 77.4
Part B. Guideline recommendations for enteral nutrition
Provider Intent 1. Enteral nutrition should be used in preference to parenteral nutrition.
7.0 6–7 7.0 4–7 3 (1.6) 0 (0.0) 95.7
Provider Intent 2. Enteral nutrition should be initiated early (24–48 hours following admission to ICU).
6.0 6–7 7.0 3–7 1 (0.5) 0 (0.0) 97.9
Provider Intent 3. An evidence-based feeding protocol should be used.
7.0 6–7 7.0 2–7 1 (0.5) 1 (0.5) 96.8
Provider Intent 4. If a feeding protocol is used, it should tolerate a higher gastric residual volume (i.e., >250 mls) before holding feeds.
6.0 3–7 7.0 1–7 9 (4.8) 1 (0.5) 60.5
Provider Intent 5. In patients who have feed intolerance (i.e., high gastric residual volumes, emesis) a promotility agent should be used.
6.0 6–7 6.0 1–7 3 (1.6) 0 (0.0) 96.2
Provider Intent 6. Small bowel feeding should be considered for those select patients who repeatedly demonstrate high gastric residual volumes and are not tolerating adequate amounts of enteral nutrition delivered into the stomach.
6.0 6–7 6.0 1–7 10 (5.4) 0 (0.0) 91.4
Provider Intent 7. Patients receiving enteral nutrition should have the head of the bed elevated to 45 degrees.
6.0 5–7 7.0 1–7 2 (1.1) 2 (1.1) 78.3
Provider Intent 8. In all critically ill patients, hyperglycemia (blood glucose >10 mmol/l or 180mg/dl) should be avoided by minimizing intravenous dextrose and using insulin administration when necessary.
6.0 6-7 6.0 2-7 2 (1.1) 0 (0.0) 94.6
Part C: Barriers to the provision of enteral nutrition in the Intensive Care Unit
Institutional characteristics
1. Not enough nursing staff to deliver adequate nutrition.
3.0 2–5 1.0 1–7 2 (2.2) 30.2
Institutional characteristics
2. Not enough dietitian time dedicated to the ICU during regular weekday hours.
3.0 2–6 2.0 1–7 5 (2.7) 38.1
Institutional characteristics
3. No or not enough dietitian coverage during weekends and holidays.
5.0 3–6 6.0 1–7 5 (2.7) 60.8
Institutional characteristics
the unit level are shown in Table 6. A total of 11 of the 21 questionnaire items included in the analysis and subscales two, three, four, and 5, demonstrated statistically signifi-cant F statistics and ICC(1,35) values >0.6 in the accept-able range. The ICC (1,1) was greater than 0.05 typically observed in the organizational literature for 10 of the 21
items. However, the values for all three indices were not acceptable for the overall and subscale one scores.
Open-ended questions
A total of 52 out of 186 respondents (28%) completed the open-ended question ‘are there any other barriers
Table 4 Descriptive statistics of barrier questionnaire items(Continued)
Institutional characteristics
5. No or not enough feeding pumps on the unit. 5.0 2–6 6.0 1–7 5 (2.7) 58.0
Guideline characteristics
6. Current scientific evidence supporting some nutrition interventions is inadequate to inform practice.
4.0 2–5 5.0 1–7 13 (7.0) 46.8
Guideline characteristics
7. The current national guidelines for nutrition are not readily accessible when I want to refer to them.
5.0 2–6 5.0 1–7 7 (3.8) 55.3
Guideline characteristics
8. The language of the recommendations of the current national guidelines for nutrition are not easy to understand.
4.0 2–5 4.0 1–7 11 (5.9) 38.3
Implementation Process
9. Not enough time dedicated to education and training on how to optimally feed patients.
5.0 3–6 5.0 1–7 6 (3.2) 57.8
Implementation Process
10. No feeding protocol in place to guide the initiation and progression of enteral nutrition.
4.0 2–5 1.0 1–7 7 (3.8) 45.3
Implementation Process
11. Current feeding protocol is outdated. 4.0 2–5 4.0 1–7 13 (7.0) 34.1
Provider intent 12. Delay in physicians ordering the initiation of EN.
5.0 3–6 5.0 1–7 5 (2.7) 65.2
Provider intent 13. Waiting for the dietitian to assess the patient. 4.0 2–6 6.0 1–7 6 (3.2) 48.3 Provider intent 14. Non-ICU physicians (i.e., surgeons,
gastroenterologists) requesting patients not be fed enterally.
5.0 3–6 6.0 1–7 6 (3.2) 57.8
Provider intent 15. Nurses failing to progress feeds as per the feeding protocol.
4.0 2–6 6.0 1–7 4 (2.2) 45.6
Provider Intent 16. Fear of adverse events due to aggressively feeding patients.
4.0 2–5 5.0 1–7 5 (2.7) 48.6
Provider Intent 17. Feeding being held too far in advance of procedures or operating room visits.
5.0 2–6 5.0 1–7 6 (3.2) 58.9
Provider Factor 18. No feeding tube in place to start feeding. 5.0 2–6 6.0 1–7 4 (2.2) 54.4 Patients Factor 19. Delays in initiating motility agents in patients
not tolerating enteral nutrition (i.e., high gastric residual volumes).
5.0 3–6 5.0 1–7 4 (2.2) 55.5
Patient Factor 20. Delays and difficulties in obtaining small bowel access in patients not tolerating enteral nutrition (i.e., high gastric residual volumes).
5.0 4–6 6.0 1–7 5 (2.7) 67.4
Patient Factor 21. In resuscitated, hemodynamically stable patients, other aspects of patient care still take priority over nutrition.
5.0 4–6 6.0 1–7 5 (2.7) 68.0
Institutional characteristic/ Patient Factor
22. Lack of agreement among ICU team on the best nutrition plan of care for thepatient.
3.0 2–5 2.0 1–7 4 (2.2) 32.4
Framework domain column indicates which of the five thematic domains of our previously developed framework [28] that the specific questionnaire item maps on to.
Responses options for Part A: 1 = fully disagree 2 = disagree 3 = somewhat disagree 4 = no opinion 5 = somewhat agree 6 = agree 7 = fully agree Endorsement = % respondents who responded‘fully agree,’ ‘agree’or‘somewhat agree’in Part A.
Responses options for Part B: 1 = fully disagree 2 = disagree 3 = somewhat disagree 4 = no opinion 5 = somewhat agree 6 = agree 7 = fully agree. Endorsement = % respondents who responded‘fully agree,’ ‘agree’or‘somewhat agree’in Part B.
Response options for Part C: 1 = not at all important 2 = unimportant 3 = somewhat unimportant 4 = neither important or unimportant 5 = somewhat important 6 = important 7 = very important. Endorsement = % respondents responded’very important,’ ‘important’or‘somewhat important’in Part C. Items ordered in table as per questionnaire distributed during field test.
deleted Subscale 1: Guideline Recommendations and Implementation Strategies 10.01 47.67 0.89
C6 ●Current scientific evidence supporting some nutrition interventions
is inadequate to inform practice.
0.68 0.15 0.30 0.24 0.23 0.87
C7 ●The current guidelines for nutrition are not readily accessible when
I want to refer to them.
0.84 0.19 0.07 0.17 0.20 0.86
C8 ●The language of the recommendations of the current guidelines
for nutrition are not easy to understand.
0.77 0.25 0.12 0.12 0.31 0.85
C10 ●No feeding protocol in place to guide the initiation and progression
of enteral nutrition.
0.54 0.38 0.15 0.34 0.31 0.87
C11 Current feeding protocol is outdated. 0.63 0.31 0.21 0.31 0.14 0.86
Subscale 2: Delivery of Enteral Nutrition to the Patient 1.68 8.00 0.86
C12 ●Delay in physicians ordering the initiation of EN. 0.19 0.42 0.41 0.45 0.17 0.85
C18 No feeding tube in place to start feeding. 0.26 0.82 0.12 0.12 0.27 0.81
C19 ●Delays in initiating motility agents in patients not tolerating enteral
nutrition (i.e., high gastric residual volumes).
0.19 0.78 0.32 0.07 0.24 0.81
C20 ●Delays and difficulties in obtaining small bowel access in patients not
tolerating enteral nutrition (i.e., high gastric residual volumes).
0.16 0.72 0.27 0.27 −0.02 0.84
C21 ●In resuscitated, hemodynamically stable patients, other aspects of
patient care still take priority over nutrition.
0.32 0.52 0.17 0.23 0.17 0.85
Subscale 3: Critical Care Provider Attitudes and Behavior 1.20 5.72 0.87
C14 ●Non-ICU physicians (i.e., surgeons, gastroenterologists) requesting
patients not be fed enterally. −
0.24 0.27 0.67 0.31 0.04 0.83
C15 ●Nurses failing to progress feeds as per the feeding protocol. 0.09 0.26 0.82 0.09 0.19 0.79
C16 ●Fear of adverse events due to aggressively feeding patients. 0.33 0.24 0.60 0.07 0.33 0.84
C17 ●Feeding being held too far in advance of procedures or operating
room visits.
0.10 0.11 0.87 0.15 0.07 0.81
Subscale 4: Dietitian Support 1.13 5.36 0.84
C13 ●Waiting for the dietitian to assess the patient. 0.37 0.26 0.19 0.63 0.18 0.79
C2 ●Not enough dietitian time dedicated to the ICU during regular
weekday hours.
0.03 0.26 0.09 0.70 0.49 0.80
C3 ●No or not enough dietitian coverage during evenings, weekends
and holidays.
0.27 0.13 0.15 0.77 0.19 0.77
C9 ●There is not enough time dedicated to education and training on how
to optimally feed patients.
0.51 0.08 0.29 0.60 −0.05 0.83
Implemen
tation
Science
2013,
8
:140
Page
11
of
20
tationscien
ce.com/cont
ent/8/1/14
C4 ●Enteral formula not available on the unit. 0.31 0.23 0.07 0.24 0.74 0.71
C5 ●No or not enough feeding pumps on the unit. 0.32 0.08 0.21 0.04 0.80 0.75
Eliminated/Reworded Item
C22 ●Lack of agreement among ICU team on the best nutrition plan of
care for the patient.
0.23 0.46 0.25 0.42 0.35
Bolded text = items retained in the factor.
Implemen
tation
Science
2013,
8
:140
Page
12
of
20
tationscien
ce.com/cont
ent/8/1/14
Questionnaire items Site 1 Site 2 Site 3 Site 4 Site 5 σb2* σw2# ICC^ ICC (35)&
N 37 32 36 29 52
Overall Barriers 32.2 ± 26.9 31.3 ± 20.9 33.3 ± 33.3 39.9 ± 35.5 26.8 ± 19.0 7.67 522.66 0.01 0.34 0.2 Subscale 1: Guideline Recommendations and Implementation Strategies 27.5 ± 28.6 38.2 ± 25.0 22.4 ± 27.9 26.4 ± 21.6 21.4 ± 21.0 0.00 602.27 0.00 0.00 0.77
Current scientific evidence supporting some nutrition interventions is inadequate to inform practice.
23.8 ± 31.9 28.7 ± 34.2 18.6 ± 29.8 29.5 ± 30.3 22.4 ± 26.7 0.00 908.80 0.00 0.00 0.6
The language of the recommendations of the current guidelines for nutrition are not easy to understand.
28.7 ± 33.9 26.4 ± 34.9 18.6 ± 29.8 33.3 ± 33.3 12.2 ± 27.8 46.18 998.05 0.04 0.62 0.03
The current guidelines for nutrition are not readily accessible when I want to refer to them.
35.2 ± 35.6 31.1 ± 31.5 24.5 ± 35.1 34.6 ± 35.2 33.3 ± 35.5 0.00 1196.27 0.00 0.00 0.71
No feeding protocol in place to guide the initiation and progression of enteral nutrition.
25.0 ± 33.2 25.3 ± 34.1 31.4 ± 33.3 26.2 ± 29.2 19.6 ± 28.4 0.00 984.31 0.00 0.00 0.56
Current feeding protocol is outdated. 23.8 ± 36.7 16.0 ± 29.8 19.0 ± 30.6 15.4 ± 25.4 20.7 ± 26.8 0.00 891.70 0.00 0.00 0.8
Subscale 2: Delivery of Enteral Nutrition to the Patient 33.0 ± 31.2 38.2 ± 25.0 39.3 ± 27.0 54.6 ± 29.0 30.5 ± 22.5 62.18 714.14 0.08 0.75 0.005
Delay in physicians ordering the initiation of EN. 33.3 ± 39.0 41.1 ± 28.6 43.5 ± 36.4 49.4 ± 39.6 30.1 ± 29.0 29.36 1175.27 0.02 0.47 0.11
No feeding tube in place to start feeding. 31.5 ± 39.0 24.4 ± 34.9 37.0 ± 33.6 59.5 ± 34.4 26.3 ± 31.9 155.32 1197.87 0.11 0.82 0.0006
Delays in initiating motility agents in patients not tolerating enteral nutrition (i.e., high gastric residual volumes).
25.9 ± 37.5 35.6 ± 37.1 33.3 ± 30.9 53.6 ± 36.7 24.4 ± 28.1 97.41 1124.24 0.08 0.75 0.004
Delays and difficulties in obtaining small bowel access in patients not tolerating enteral nutrition (i.e., high gastric residual volumes).
34.3 ± 37.8 48.9 ± 32.4 40.7 ± 34.8 56.8 ± 33.1 32.1 ± 31.6 70.09 1150.70 0.06 0.68 0.02
In resuscitated, hemodynamically stable patients, other aspects of patient care still take priority over nutrition.
39.8 ± 35.5 41.1 ± 33.5 41.7 ± 34.2 53.6 ± 37.8 37.3 ± 35.1 0.00 1236.48 0.00 0.00 0.39
Subscale 3: Critical Care Provider Attitudes and Behavior 27.9 ± 30.3 44.7 ± 29.5 20.8 ± 26.2 31.8 ± 29.5 33.0 ± 24.3 51.15 764.14 0.06 0.70 0.01
Non-ICU physicians (i.e., surgeons, gastroenterologists) requesting patients not be
fed enterally.
34.4 ± 33.3 60.0 ± 32.0 24.1 ± 33.4 30.9 ± 33.2 32.7 ± 36.2 148.80 1154.98 0.11 0.82 0.0006
Nurses failing to progress feeds as per the feeding protocol. 22,2 ± 34.7 35.6 ± 38.1 14.8 ± 25.8 27.4 ± 31.5 34.0 ± 35.2 44.12 1115.92 0.04 0.58 0.05
Fear of adverse events due to aggressively feeding patients. 28.7 ± 33.9 28.9 ± 34.7 23.1 ± 31.7 36.9 ± 36.7 24.2 ± 30.6 0.00 1096.86 0.00 0.00 0.48
Feeding being held too far in advance of procedures or operating room visits. 24.8 ± 34.6 54.4 ± 38.6 21.3 ± 31.7 33.3 ± 36.3 41.8 ± 33.2 143.22 1166.23 0.11 0.81 0.0006
Subscale 4: Dietitian Support 33.3 ± 37.1 37.9 ± 28.0 28.1 ± 28.3 40.4 ± 25.7 23.4 ± 21.7 35.26 710.07 0.05 0.63 0.03
Waiting for the dietitian to assess the patient. 27.6 ± 40.8 34.4 ± 33.3 27.8 ± 33.3 37.0 ± 33.8 21.8 ± 28.7 7.73 1137.44 0.01 0.19 0.32
Not enough dietitian time dedicated to the ICU during regular weekday hours. 21.3 ± 33.0 34.4 ± 33.3 21.9 ± 33.3 35.7 ± 38.4 11.5 ± 24.6 76.09 1014.70 0.07 0.72 0.005
No or not enough dietitian coverage during evenings, weekends and holidays. 30.6 ± 38.5 52.2 ± 37.8 29.5 ± 35.9 51.2 ± 34.5 32.1 ± 30.9 91.75 1241.46 0.07 0.72 0.009
There is not enough time dedicated to education and training on how to optimally feed patients.
27.8 ± 29.3 32.2 ± 35.1 31.5 ± 31.8 36.9 ± 35.5 28.1 ± 30.1 0.00 1011.24 0.00 0.00 0.78
Implemen
tation
Science
2013,
8
:140
Page
13
of
20
tationscien
ce.com/cont
ent/8/1/14
Enteral formula not available on the unit. 53.7 ± 44.6 33.3 ± 37.1 32.4 ± 36.1 42.9 ± 38.3 17.9 ± 28.4 149.67 1330.97 0.10 0.80 0.0003
No or not enough feeding pumps on the unit. 56.5 ± 42.0 37.9 ± 38.5 19.4 ± 32.2 50.0 ± 38.0 33.3 ± 33.7 172.74 1343.58 0.11 0.82 0.0003
Variance components calculated using mixed linear regression model with Restricted Maximum Likelihood estimation (REML): *= (i.e., ICU),σb2= between group (i.e., ICU) variance #σw2= within group (i.e., ICU) variance ^ICC = Intraclass correlation coefficient (1,1) =σb2/ (σb2+σw2)&ICC(1,35) =σb2/(σb2+σw2/k) where k = 35 respondents per group.
Bolded text = overall and subscale results.
Implemen
tation
Science
2013,
8
:140
Page
14
of
20
tationscien
ce.com/cont
ent/8/1/14
that hinder your ability to deliver adequate amounts of EN?’Of these, 22 indicated ‘no’and 22 described a bar-rier that was already included in the questionnaire or a non-modifiable barrier (e.g., patient’s clinical condition) and therefore were not considered further. Of the remaining eight responses, four described feeds being held for diarrhea, and four described waiting for x-ray confirmation of tube placement as important barriers. The latter two barriers were highlighted for inclusion as new items in the revised questionnaire.
On-site observational visits
A total of 46 providers participated in the five focus groups, ranging from three to 14 attendees per group. Overall, at each site the important barriers reported by the attendees during the discussions on nutrition per-formance were conceptually the same as the top ranked barriers derived from the responses of ICU providers at their site.
Revised barriers questionnaire and pilot test
Of the 39 potential barriers in the field test version of the questionnaire, seven items in Part A and the eight items in Part B were omitted from the revised version, leaving 24 of the original items. Of these items, three (A.8, A.9, and C.22) were reworded. In addition, two new items were added for a total of 26 potential barriers. The revised version of the barriers questionnaire pre-sented (Additional file 2 and available at www.criticalcar-enutrition.com) in this paper consists of two sections. The first section lists the 26 potential barriers to delivery of EN and asks the respondent to rate their importance as barriers in their ICU (See Table 7). These items are followed by two ended questions. The first open-ended question asked respondents if there are any other barriers that hinder their ability to deliver adequate EN, and the second asked respondents to rank the three most important of 26 potential barriers to the provision of adequate EN in their ICU. Part B includes six ques-tions about the personal demographics of the respond-ent. The revised questionnaire has 34 questions.
The pilot test of the revised questionnaire in a separate sample of 43 nurses (response rate 72%) demonstrated completion time was less than five minutes. No further changes were made based on the pilot test feedback.
Test-retest
Of the 60 distributed questionnaires, a total of 17 nurses completed the questionnaire on two occasions, two weeks apart for a response rate of 28%. The ICC (2,1) for total barriers score was 0.64, with subscale scores ranging from 0.39 – 0.62. Only one of the individual items demonstrated acceptable correlation of >0.70. Item ICCs ranged from −0.13 to 0.70. The kappa coefficients
were similar to the ICC; three items demonstrating sub-stantial or almost perfect agreement (Table 7). The Bland Altman plots did not indicate any bias between the two observations (Figure 1a and b).
Discussion
We aimed to develop a novel questionnaire to assess barriers to implementing guideline recommendations pertaining to enterally feeding critically ill patients and to conduct preliminary psychometric testing of this new instrument. The content of the questionnaire has a sound theoretical base, derived from a recently devel-oped framework that describes barriers to implementa-tion of critical care nutriimplementa-tion CPGs [28]. The face and content validity of the questionnaire were established through review by experts, and through pre-testing and pilot testing with ICU providers. The descriptive and ex-ploratory factor analysis led to the elimination of several items, resulting in a more parsimonious representation of the underlying conceptual framework. The indices of internal reliability for the derived factor subscales and the overall instrument were acceptable. However, the as-sessment of test-retest reliability suggested that the tem-poral stability of the questionnaire was poor to moderate for the majority of items, with only two items demon-strating acceptable reliability.
In designing the barriers questionnaire, we hypothe-sized that attitudes towards nutrition and guidelines in general may function as a barrier to feeding by influen-cing a providers’intent to adopt a specific recommenda-tion and their subsequent behavior. However, our analysis revealed very high endorsement for all these general items in Parts A and B. The positive skew of the observed responses may in part be due to social desir-ability bias, whereby critical care providers tended to perceive their workplace favorably. However, the positive attitudes observed in our field test were also observed in our previous international survey of the attitudes of more than 500 physicians and dietitians towards the Canadian Critical Care Nutrition CPG recommendations [37]. When results of this previous survey were com-pared to observational data of nutrition practices [10], despite supportive evidence underlying the dations and uniform endorsement of these recommen-dations among providers, bedside practice did not follow recommendations. This supports our questionnaire field test results suggesting that negative attitudes towards guidelines and lack of agreement with ICU guideline recommendations are unlikely to be important impedi-ments to the provision of EN.
framework as a starting point for our analysis [26]. Our revised framework and subsequent content of the bar-riers questionnaire may have differed if we had selected a different framework or theoretical model. In their qualitative study of barriers to radiography for back pain, the analysis for which was also guided by Cabanaet al.’s framework, Espeland and Baerheim noted that this bar-rier classification system was similar to other systems [29]. However, different barrier systems that look at bar-riers from different angles may provide complementary insights [29]. Cabana et al. primarily used quantitative
data to develop their framework; psychological theories have also been used to explain the behaviors of health professionals across different settings. Through an ex-pert consensus process Michieet al.identified 12 theor-etical domains of relevance to implementation research [51]. Although the terminology differs, the thematic do-mains and subdodo-mains identified in our framework over-lap with those in this theoretical domains framework (TDF) with the exception of our ‘patient characteristics’ domain. This suggests that the content of the barriers questionnaire may have been similar if the TDF had Table 7 Test retest (N = 17)
Questionnaire items ICC (2,1) Kappa*
Overall Barriers 0.64 0.35
Guideline Recommendations and Implementation Strategies 0.31 0.06
1. Current scientific evidence supporting some nutrition interventions is inadequate to inform practice. 0.36 0.24 2. The language of the recommendations of the current guidelines for nutrition are not easy to understand. 0.37 0.38 3.I am not familiar with our current guidelines for nutrition in the ICU. 0.35 0.23 4. The current guidelines for nutrition are not readily accessible when I want to refer to them. 0.51 0.30 5. No feeding protocol in place to guide the initiation and progression of enteral nutrition. −0.13 −0.03
Current feeding protocol is outdated. 0.31 0.20
ICU Resources 0.57 0.60
6. Not enough nursing staff to deliver adequate nutrition. 0.70 0.60
7. Enteral formula not available on the unit. 0.34 0.27
8. No or not enough feeding pumps on the unit. 0.51 0.27
Dietitian Support 0.39 0.34
9. Waiting for the dietitian to assess the patient. 0.15 0.21
Not enough dietitian time dedicated to the ICU during regular weekday hours. 0.43 0.34
10. No or not enough dietitian coverage during evenings,weekends and holidays. 0.52 0.34 11. There is not enough time dedicated to education and training on how to optimally feed patients. 0.32 0.20
Delivery of Enteral Nutrition to the Patient 0.55 0.47
No feeding tube in place to start feeding. 0.51 0.51
12. Delay in physicians ordering the initiation of EN. 0.37 0.13
13.Waiting for physician/radiology to read x-ray and confirm tube placement. 0.22 0.30 14. Delays in initiating motility agents in patients not tolerating enteral nutrition (i.e., high gastric residual volumes). 0.43 0.16 15. Delays and difficulties in obtaining small bowel access in patients not tolerating enteral nutrition
(i.e., high gastric residual volumes).
0.52 0.65
16. In resuscitated, hemodynamically stable patients, other aspects of patient care still take priority over nutrition. 0.59 0.52 17.Needles delays in relaying information regarding the initiation and progression of nutrition. 0.36 0.32
Critical Care Provider Attitudes and Behavior 0.62 0.35
18. Non-ICU physicians (i.e., surgeons, gastroenterologists) requesting patients not be fed enterally. 0.57 0.43
19. Nurses failing to progress feeds as per the feeding protocol. 0.09 0.19
20.Feeds being held due to diarrhea. 0.46 0.50
21. Fear of adverse events due to aggressively feeding patients. 0.53 0.33
22. Feeding being held too far in advance of procedures or operating room visits. 0.69 0.65 23.General belief among ICU team that provision of adequate nutrition does not impact on patient outcome. 0.60 0.87 *Agreement between nurses who responded that an item was‘somewhat important’to‘very important’(5–7) vs‘not at all important’to‘neither important or unimportant’(1–4).
been used. Unlike the TDF, our intention was to use our framework and questionnaire to identify barriers that could be addressed by both behavior change and local system level change. Notwithstanding, moving forward, adopting a more theoretical approach is advised [52]. Referring to the theoretical constructs of the TDF may be useful for both informing our understanding of the nature of the identified barriers, identifying potential in-terventions to address them, and explaining the mechan-ism by which change occurs.
As the content of the barriers questionnaire was guided by the five domains of our framework for under-standing adherence to guidelines in the ICU [28], we ex-pected that the exploratory factor analysis would reveal a five-factor solution, with individual items relating to a specific domain loading onto a factor related to that do-main. Although we did observe a five-factor structure to the data, there were some differences between these fac-tors and the conceptual framework domains. The factor
analysis revealed that all items relating to the dietitian’s role loaded as a distinct factor. As the dietitian has pri-mary responsibility for nutritional care, it is intuitive that ‘dietitian support’ would be a single factor distinct from the role of other critical care providers or ICU resources. This assumption is supported by our previous analysis showing that the presence of a dietitian was associated with higher nutrition performance [53]. In contrast, items related to the two domains of guideline recommendations and guideline implementation strategies in our conceptual framework all loaded as a single factor, suggesting that ICU providers do not perceive the guideline documents and their method of implementation as different types of barriers but all related to the same concept. These ob-served differences with our underlying framework are not overtly discrepant but rather aid in refining it to be a more meaningful representation of potential barriers.
While preliminary evaluation revealed acceptable in-ternal reliability, we observed that test retest reliability
overalla
0 10 20 30 40 50 60 70 80 90 100
overallb
0 10 20 30 40 50 60 70 80 90 100
Difference
-100 -80 -60 -40 -20 0 20 40 60 80 100
Average
0 10 20 30 40 50 60 70 80 90 100
Bland-Altman Plot
a
b
and the reliability of aggregated responses was poor for some items. A priori, we surmised that an ICU pro-viders’ perception of barriers to enterally feeding would not change over a two-week period. Nurses may have altered their responses as a consequence of being prompted to think more about the barriers to feeding their patients following the first administration of the questionnaire, or providers may respond based on their most recent experiences with an individual patient ra-ther than their general experience. Our sample size of 17 nurses may have been inadequate to evaluate test retest accurately. Although greater than 50% of items demon-strated acceptable reliability as aggregated variables, sev-eral items including those associated with subscale one were problematic. Items in subscale one focused on characteristics of nutrition guideline recommendations, therefore we may surmise that there will be greater vari-ation in individuals responses surrounding these general items compared to other items focusing on routine prac-tice in their ICU. Larger samples representing more ICUs would inform whether specific items or the re-sponse scale should be revised to improve reliability.
A weakness of the current response scale is that as the primary purpose of the scale is to identify barriers, not all the information collected on the scale is used. For ex-ample, when using the scale for the purpose of tailoring interventions or when deriving subscale and overall scores from the individual item responses we focused on the upper end of the scale only; i.e.,‘5 – somewhat im-portant' ,‘6 – important’ or ‘7 – very important’ as we were not interested in factors that were not perceived to be important barriers by respondents (i.e.,‘1–not at all important’,‘2 –unimportant’,‘3 – somewhat important’, ‘4 – neither important or unimportant’). Consequently, by using only three points of the scale we may have lost important information regarding the magnitude of the barrier. Furthermore, these limitations associated with the response scale may have led to a reduction in the liability of the questionnaire. Consequently, we have re-vised this Likert scale to better capture the degree to which each item is a barrier (i.e., 0 – ‘not at all’ to 6 – ‘an extreme amount’). The usefulness and reliability of this revised scale will be assessed in future studies.
The utility of this instrument to inform quality im-provement activities in the busy ICU environment is promising. In the pre-test post-test study in which this questionnaire was distributed [54], we employed mul-tiple methods to identify barriers at participating ICUs; supplementing results of a staff survey using this ques-tionnaire with data on the guideline-practice gap, ob-tained through a chart audit, and perspectives of key stakeholders, obtained through a focus group. Using the results of the barriers assessment, ICU staff prioritized barriers to target for change and selected interventions
to overcome them during a one-day brainstorming ses-sion. The resulting tailored intervention was imple-mented over a 12-month period and we observed a statistically significant decrease in overall barriers score and a non-significant increase in prescribed calories received [54].
There are several limitations to this work. First, this report represents the first field test of the questionnaire in a convenience sample of five ICUs in North America with a moderate response rate of 46%. However, the re-sponse rate is similar to other surveys in this setting [55], and the field test sample of 159 responses used in the factor analysis provided a sample size to item ratio of 7:1 (i.e., 159 responses: 22 items), surpassing the mini-mum recommendation of 4:1 [49]. Second, 75% of our participants were nurses; consequently the proportion of dietitians and physicians who are the primary decision makers for nutrition therapy was small. We did not involve non-ICU physicians or residents whose attitudes towards the nutrition recommendations may differ. To this end, further testing is planned in a larger international sample of providers. Third, items in the questionnaire are those that providers perceive to be im-portant barriers to EN in the ICU, but other studies are needed to evaluate whether addressing these perceived barriers actually improves the provision of EN in prac-tice. Finally, analyses using different datasets are re-quired to confirm the five-factor solution derived from this field test and to establish the questionnaire’s con-struct validity.
Conclusions
We have developed a questionnaire for assessing barriers to feeding critically ill patients, and have provided pre-liminary evidence to support the validity and internal consistency of the derived factor subscales and the over-all instrument. In addition to the planned validation studies, the feasibility of using the questionnaire to iden-tify barriers to target for change through a tailored inter-vention is being evaluated.
Additional files
Additional file 1:Barriers to Feeding Critically Ill Patients Questionnaire distributed during the field test phase of development (49 items).
Additional file 2:Barriers to Feeding Critically Ill Patients Questionnaire revised version distributed during the pilot and test-retest phase of development (34 items).
Abbreviations
ANOVA:Analysis of variance; CPGs: Clinical practice guidelines; EN: Enteral nutrition; ICU: Intensive care unit; ICC: Intraclass correlation coefficient; REML: Restricted Maximum Likelihood.
Competing interests