SCITECH
Volume 10, Issue 3RESEARCH ORGANISATION
March 31, 2018Journal of Research in Business, Economics and Management www.scitecresearch.com
Implementation and Effectiveness of Strategic Actions Used to
Reduce Employee Variability in the Service Sector
King-Jang, Yang
1, Shun-Hsing Chen
2, *1Professor, Center for General Education, Chung-Hua University,Taiwan R.O.C.
2, *Professor, Department of Marketing & Distribution Management, Oriental Institute of Technology, Taiwan R.O.C.
Abstract
Employee variability can have significant adverse effects on service delivery and customers’ perceptions of service quality. However, the types of employee variability that exist and the appropriate actions required to address these various types of variability have not been systematically examined. This pioneering study systematically develops a typology of employee variability consisting of six categories: (i) understanding variability; (ii) attitude variability; (iii) capability variability; (iv) method variability; (v) effort variability; and (vi) decision variability. The study also suggests strategic actions that can be used to reduce the effects of each kind of variability. The present study categorises the strategic actions to address employee variability into four groups: (i) classic accommodation (CA); (ii) classic reduction (CR); (iii) low-cost accommodation (LC); and (iv) uncompromised reduction (UR). An empirical study is then conducted among 97 reputable Taiwanese service firms. The results shows that the respondent companies prefer the traditional CA and CR strategies. In contrast, the LC strategies are relatively neglected, despite their potential for producing a significant reduction in the adverse effects of employee variability. The study concludes that service providers should place greater emphasis on the implementation of automated low-cost strategies to reduce the undesirable effects of employee variability.
Keywords:
Employee Variability; Strategic Action; Service Quality.1. Introduction
The provision of quality, satisfaction, and value to customers has become a priority for both manufacturers and service providers in the increasingly competitive customer-focused markets of the contemporary era (Wang et al., 2004). In a service setting, it is widely accepted that perceptions of quality, satisfaction, and value are primarily determined by the interactions between customers and front-line representatives of the service provider. As a consequence, a huge amount of research has explored the impacts of these interactions on customers‘ perceptions of value and quality. In this regard, Dean (2004) proposed a general overarching conception in which organisational characteristics and practices were linked to employee attitudes, which were subsequently reflected in service-quality outcomes, customer satisfaction, customer loyalty, and, ultimately, in organisational profit and success.
Darby and Daniel (1999) contended that front-line service employees are the key to customers‘ perceptions of high-quality service because such employees are the major influence in forming customer expectations and controlling customer experiences. In a similar vein, George and Hegde (2004) stated that service quality is ultimately determined by the ability and willingness of employees to commit themselves to active participation in the delivery of superior service. In this regard, it has been suggested that a positive service orientation is an aspect of personality (Hurley, 1998), and that employees who sincerely believe in understanding customers (and acting to satisfy their needs) will perform better than those who do not hold such beliefs (Gwinner et al., 2005).
knowledge, skills, competence, and communication ability—all of which have the potential to affect the delivery of service and the customers‘ perceptions of quality, satisfaction, and value. In other words, employee variability is an extremely important issue in determining the level and consistency of service quality. However, although many studies have noted the significance of this issue, relatively few studies have focused specifically on the subject of employee variability and it would seem that no systematic analysis of employee variability has ever been undertaken.
The present study addresses this apparent gap in the literature by proposing a systematic typology of employee variability. The study then proposes a conceptual model of the relationships and impacts of these various types of variability at each stage of service delivery. Strategic management actions for managing the adverse effects of each type employee variability are then suggested. This is followed by an empirical study of a sample of Taiwanese service companies with good reputations for service quality. The aim of the empirical study is to investigate the level of implementation and the effectiveness of the proposed strategic actions for managing employee variability. The paper concludes with a summary of the main conclusions, managerial implications, and suggestions for future study.
2. Literature Review and Conceptual Framework
2.1 Typology of Employee Variability
The term ‗employee variability‘ refers to the inherent variation (and instability) that exists among employees in terms of behaviour, attitudes, skills, abilities, and effort. As noted above, although many studies have commented on the significance of this issue in terms of service quality and customer satisfaction, it would seem that no systematic analysis of employee variability has ever been undertaken.
In seeking to address this apparent gap in the literature by defining an appropriate typology of employee variability, the present study considered the following sources:
i) Relevant academic papers that have discussed various aspects of employee behaviour, attitude, capability, communication ability, and willingness; in particular the following studies were considered: Dean (2004); George and Hegde, (2004); Heskett (1987); King & Garey (1997); Chebat and Kollias (2000); Almor & Hashai (2004); Shi & Yip (2007); Gwinner et al. (2005); Ulwick (2002);
ii) An adaptation of the typology of customer variability proposed by Frei (2006).
iii) Interviews with senior managers of several selected service firms with a reputation for outstanding service quality in Taiwan.
iv) After careful assessment of all of these sources, the present study classified employee variability into a proposed typology of six categories, which can be summarised as follows:
v) Understanding variability: Employees have different perceptions of customers‘ needs and expectations,
especially when the employees are facing varied customer requirements. ―Communication ability‖ is a determinant of such variability.
vi) Attitude variability: Differences in personality and willingness to service customers mean that employees‘ attitudes vary. Besides, culture is an another factor of attitude variability.
vii) Capability variability: The professional knowledge, skills, and competence of employees differ significantly. This variability is decided by the employees‘ experiences, learning and training.
viii) Method variability: Different employees use different methods to serve customers or to solve customers‘ problems; in addition, a given employee might use different methods to serve different customers. Such variability may be caused by the employees‘ experiences, professional skill, and willingness.
ix) Effort variability: Employees vary in the levels of effort they put into serving customers; some demonstrate unrelenting enthusiasm, whereas others are reluctant to try hard to meet customers‘ requirements.
x) Decision variability: Different employees make different decisions in response to a given customer requirement.
This variability is influenced by the employees‘ experience and personal capability.
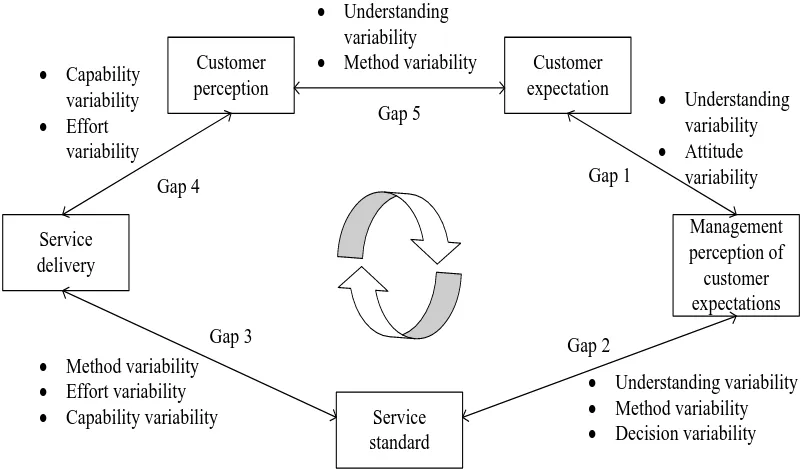
2.2 Employee Variability and the ‘Gap Model’
i) Gap1 Understanding:This gap arises when a service provider lacks a full understanding of a given customer‘s needs and expectations. Of the six types of employee variability identified in the proposed typology presented above, ‘understanding variability‘ and ‗attitude variability‘ are of particular importance in this gap.
ii) Gap2 Design: This gap occurs when the design of service-quality specifications do not match management perceptions of a given customer‘s needs and expectations. Of the six types of employee variability identified above, ‗understanding variability‘, ‗decision variability‘, and ‗method variability‘ are especially relevant to this gap.
iii) Gap 3 Service Delivery: This gap occurs when the actual service delivery is not in accordance with the service-design specifications. Of the six types of employee variability in the proposed typology, ‗capability variability‘, ‗effort variability‘, and ‗method variability‘ are of particular importance in this gap.
iv) Gap 4 Communication: This gap occurs when there is a discrepancy between service delivery and external communications in the form of exaggerated promises and/or a lack of information provided to contact personnel. Of the six types of employee variability identified above, ‗understanding variability‘ ‗capability variability‘ and ‗effort variability‘ are especially relevant to this gap.
v) Gap 5 Expectation–Perception: This gap occurs when there is a discrepancy between the cusstomer‘s -perception of the actual service performed and what the customer had expected to receive. According to the original ‗gap model‘ of Parasuraman et al. (1985), the extent of Gap 5 is determined by the sum of all four of the preceding four gaps. It is therefore reasonable to assume that almost all types of employee variability will be relevant to this gap, with ‗understanding variability‘, ‗method variability‘ and ‗decision variability‘ being the most important.
The influences of the various types of employee variability on the service-quality gap model can be illustrated in an adaptation of the model proposed by Fitzsimmons and Fitzsimmons (2008), as shown in Figure 1.
Customer
expectation
Service
delivery
Management
perception of
customer
expectations
Service
standard
Customer
perception
·
Understanding
variability
·
Method variability
Gap 5
Gap 1
Gap 2
Gap 3
Gap 4
·
Capability
variability
·
Effort
variability
·
Method variability
·
Effort variability
·
Capability variability
·
Understanding variability
·
Method variability
·
Decision variability
·
Understanding
variability
·
Attitude
variability
Figure 1: Influence of Employee Variability on Service Quality Based on the Service-Quality Gap Model
2.3 Strategies to Manage Employee Variability
It is explicit in the ‗gap model‘ of service quality that service organisations that wish to improve their service quality must take steps to eliminate any gaps that are apparent in their service design and delivery. In doing so, it is the contention of the present study that service providers require effective strategies to manage the various types of employee variability identified in the proposed typology. Several such strategic actions might be required to reduce all forms of employee variability.
interviews, together with a review of relevant studies in the literature, a list of proposed strategic actions for management of employee variability was developed. These actions are listed in Table 1.
Table 1: Proposed Strategic Actions for Management of Employee Variability
Type of Employee
Variability Strategic Actions Relevant Studies
Understanding variability
Train customer-contact personnel in communication skills
Provide employees with knowledge of products/services content
Limit complexity of service contents
Provide customers with self-service options
Utilise information system to reduce misunderstandings regarding customer information
Solomon et al. (1985)
Bitner et al. (1994)
Frei (2006)
Halbesleben and Buckley (2004)
Parasuraman et al. (1985); Zeithaml et al. (1988)
Attitude variability Train customer-contact personnel in service attitudes and manner
Provide customers with self-service options to reduce customer–employee interaction
Link evaluation of employees‘ service manner with rewards and penalties
Schlesinger and Heskett (1991)
Halbesleben and Buckley (2004)
Capability variability Recruit new staff with specific skills and abilities
Train employees in required skills and capabilities
Encourage employees to obtain specific certified skills
Automate services using technology
Analyse employees‘ capabilities and organise work schedules appropriately
Hurley (1998)
Solomon et al. (1985)
Johnson and Ventura (2004)
Method variability Standardise processes and operations
Arrange for senior employees to supervise service methods of junior employees
Automate services using technology
Utilise employee panel discussions to enhance experience and knowledge
Cohen and Brand (1993)
Bitner et al. (1994)
Hsieh and Hsien (2001)
Johnson and Ventura (2004)
Effort variability Educate and encourage employees to work hard
Link employee‘s performance evaluation with rewards and penalties
Cultivate an enthusiastic customer-focused organisational culture
Ashill et al. (2006)
Decision variability Train employees in good decision-making
Use decision-support systems to help employees make appropriate decisions
Set-up and ensure consistent service standards
Empower front-line employees to make critical decisions immediately
Johnson and Ventura (2004)
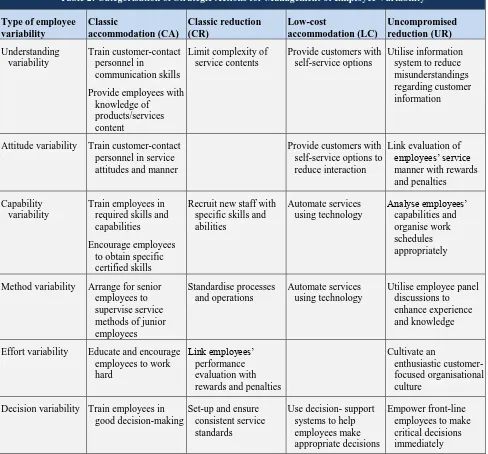
As noted above, Frei (2006) undertook a systematic study of both: (i) the typology of customer variability; and (ii) strategies to manage it. Although the typology proposed by Frei (2006) applied to customer variability (rather than employee variability), the categorisation of strategies can be adapted for use in the present context. Frei divided the strategic actions used to manage customer variability into four categories: (i) ‗classic accommodation‘ (CA); (ii) ‗classic reduction‘ (CR); (iii) ‗low-cost accommodation‘ (LC); and (iv) ‗uncompromised reduction‘ (UR). Adapting this categorisation to the strategic actions proposed for the types of employee variability listed in Table 1, four categories of strategies for management of employee variability are shown in Table 2.
Table 2: Categorisation of Strategic Actions for Management of Employee Variability
Type of employee variability Classic accommodation (CA) Classic reduction (CR) Low-cost accommodation (LC) Uncompromised reduction (UR) Understanding variability Train customer-contact personnel in communication skills
Provide employees with knowledge of
products/services content
Limit complexity of service contents
Provide customers with self-service options
Utilise information system to reduce misunderstandings regarding customer information
Attitude variability Train customer-contact personnel in service attitudes and manner
Provide customers with self-service options to reduce interaction
Link evaluation of employees‘ service manner with rewards and penalties
Capability variability
Train employees in required skills and capabilities
Encourage employees to obtain specific certified skills
Recruit new staff with specific skills and abilities Automate services using technology Analyse employees‘ capabilities and organise work schedules appropriately
Method variability Arrange for senior
employees to supervise service methods of junior employees
Standardise processes and operations
Automate services using technology
Utilise employee panel discussions to enhance experience and knowledge
Effort variability Educate and encourage
employees to work hard
Link employees‘ performance evaluation with rewards and penalties
Cultivate an
enthusiastic customer-focused organisational culture
Decision variability Train employees in good decision-making
Set-up and ensure consistent service standards
Use decision- support systems to help employees make appropriate decisions
Empower front-line employees to make critical decisions immediately
3. Empirical study
An empirical study was conducted among service firms that were well known in Taiwan for implementing quality-management systems. The study had the following aims:
i) To investigate the level of implementation within each firm of each of the strategic actions listed in Table 2;
ii) To investigate the overall adoption (percentage of firms) of each strategic action by the service firms; and
iii) To examine the effectiveness of the strategic actions in reducing the influence of employee variability.
The final questionnaire consisted of three parts: (i) questions relating to the adoption and level of implementation of each strategic action (24 items; one for each strategy); (ii) questions relating to the effectiveness of each of the strategic actions in reducing the influence of employee variability (24 items; one for each strategy); and (iii) basic data on the participants (in particular, the industry sector to which the respondent‘s firm belonged).
In the first two parts, a five-point Likert-type scale was used for responses. To assess the level of implementation of each strategy, the five-point Likert-type scale ranged from ‗never implement‘ (1) to ‗strongly implement‘ (5). For the effectiveness of the strategies, the five-point Likert-type scale ranged from ‗very little effect‘ (1) to ‗very significant effect‘ (5).
In addition to completing the questionnaire, participants were interviewed by researchers to explore issues of employee variability and related strategic actions in greater depth.
The data collection (including interviews) was conducted from July 2008 to December 2008. A total of 108 senior managers of well-known Taiwanese service firms were approached; of these, 97 completed valid questionnaires were suitable for analysis. The 97 service firms were distributed as follows: 14 in the financial services sector; 10 in the insurance sector; 13 in health care; 8 in transportation services; 16 in hotels; 10 in automobile sales; 6 in telecommunications; 16 in consultancies; and 4 others.
4. Analysis and Results
4.1 Understanding Variability
A precise understanding of the customers‘ real needs and expectations is a critical issue in service encounters. Service companies thus need to adopt effective strategies to overcome problems caused by ‗understanding variability‘.
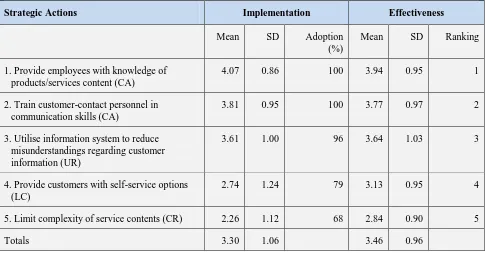
As shown in Table 3, the service companies represented in the present study preferred the ‗classic accommodation‘ (CA) strategies. All of the respondents had adopted the CA actions of ‗providing employees with knowledge of products/services content‘ and ‗training customer-contact personnel in communication skills‘. These two strategies had the highest levels of implementation (mean implementation levels of 4.07 and 3.81 respectively on a scale of 1–5) and were also ranked as the most effective (means of 3.94 and 3.77 respectively on a scale of 1–5).
Table 3: Understanding variability: Implementation and Effectiveness o Strategic Management Actions
Strategic Actions Implementation Effectiveness
Mean SD Adoption
(%)
Mean SD Ranking
1. Provide employees with knowledge of products/services content (CA)
4.07 0.86 100 3.94 0.95 1
2. Train customer-contact personnel in communication skills (CA)
3.81 0.95 100 3.77 0.97 2
3. Utilise information system to reduce misunderstandings regarding customer information (UR)
3.61 1.00 96 3.64 1.03 3
4. Provide customers with self-service options (LC)
2.74 1.24 79 3.13 0.95 4
5. Limit complexity of service contents (CR) 2.26 1.12 68 2.84 0.90 5
Totals 3.30 1.06 3.46 0.96
T
he strategy of ‗utilising information system to reduce misunderstandings regarding customer information‘, which is an
According to Frei‘s analysis of customer variability (Frei, 2006), the ‗classic accommodation‘ (CA) and ‗classic reduction‘ (CR) strategies have traditionally been favoured by service organisations in managing customer variability; in contrast, the ‗low-cost accommodation‘ (LC) and ‗uncompromised reduction‘ (UR) strategies, which are the alternative actions that can be used to reduce the impact of customer variability without increasing costs, have been less favoured. In the present study, it would seem that the service companies also preferred the ‗traditional‘ methods (CA and CR) to manage employee variability. In this regard, it is worth noting that the strategy of ‗providing customers with self-service options‘ (which is an LC action) was relatively neglected by the respondents (implementation level of only 2.74 and adoption rate of only 79%), despite its effectiveness (3.13) being moderately high. It would therefore seem that the service companies in the present sample could benefit by paying more attention to this LC strategic action.
4.2 Attitude Variability
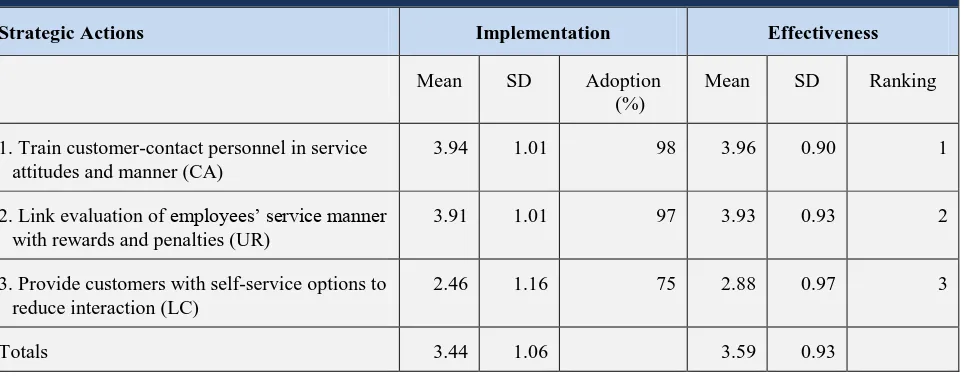
As shown in Table 4, the service companies represented in the present study preferred the CA strategic action of ‗training customer-contact personnel in service attitudes and manner‘, which had high levels of adoption (98%), implementation (mean of 3.94), and effectiveness (mean 3.96). The UR strategic action of ‗linking evaluation of employees‘ service manner with rewards and penalties‘ also had a high level of implementation (3.91) and effectiveness (3.93).
In contrast, the LC strategic action of ‗providing customers with self-service options to reduce interaction‘ was not commonly implemented by the service firms in the present study (mean implementation level of only (2.46); moreover, this strategy had a low level of effectiveness (2.88).
It is thus apparent from the results that, in managing variability in employee attitude, the LC strategic action was again relatively neglected by the service firms in this sample.
Table 4: Attitude Variability: Implementation And Effectiveness Of Strategic Management Actions
Strategic Actions Implementation Effectiveness
Mean SD Adoption
(%)
Mean SD Ranking
1. Train customer-contact personnel in service attitudes and manner (CA)
3.94 1.01 98 3.96 0.90 1
2. Link evaluation of employees‘ service manner with rewards and penalties (UR)
3.91 1.01 97 3.93 0.93 2
3. Provide customers with self-service options to reduce interaction (LC)
2.46 1.16 75 2.88 0.97 3
Totals 3.44 1.06 3.59 0.93
4.3 Capability Variability
As with the previous types of employee variability, the respondents preferred CA strategic actions in addressing the problem of ‗capability variation‘. As shown in Table 5, the strategy of ‗training employees in required skills and capabilities‘ had been adopted by all of the respondents; moreover, this strategic action had the highest levels of both implementation (mean of 4.16) and effectiveness (3.95). Another CA strategy, ‗encouraging employees to obtain specific certified skills‘, also had a high level of adoption (95%), and high implementation (3.85) and high effectiveness (3.82). Apart from these two CA strategic actions, the CR strategic action of ‗recruiting new staff with specific skills and abilities‘ was also widely adopted by the service firms in the present sample (99%); moreover, it had high levels of both implementation (3.93) and effectiveness (3.79).
Table 5: Capability Variability: Implementation and Effectiveness Of Strategic Management Actions
Strategic Actions Implementation Effectiveness
Mean SD Adoption
(%)
Mean SD Ranking
1. Train employees in required skills and capabilities (CA)
4.16 0.72 100 3.95 0.81 1
2. Recruit new staff with specific skills and abilities (CR)
3.93 0.84 99 3.79 0.90 3
3. Encourage employees to obtain specific certified skills (CA)
3.85 1.12 95 3.82 0.95 2
4. Analyse employees‘ capabilities and organise work schedules appropriately (UR)
3.56 1.14 91 3.75 0.91 4
5. Automate services using technology (LC) 2.92 1.23 80 3.28 0.84 5
Totals 3.68 1.01 3.72 0.88
4.4 Method Variability
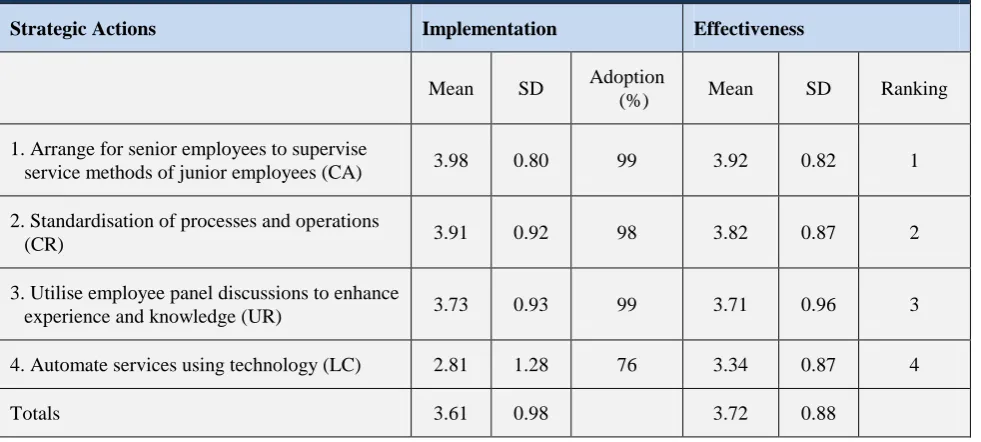
To address the problem of ‗Method variability‘, the respondents reported that the CA strategic action of ‗arranging for senior employees to supervise the service methods of junior employees‘ was widely adopted (99% of respondents) and had high levels of implementation (mean 3.98) and effectiveness (mean 3.92). As shown in Table 6, the CR strategy of ‗standardisation of processes and operations‘ was also widely adopted by the service firms (98% of respondents) with high levels of implementation (3.91) and effectiveness (3.82).
It is also noteworthy that the UR strategy of ‗utilising employee panel discussion to enhance experience and knowledge‘ was also widely adopted by the service firms in the present sample (99%), with high levels of implementation (3.73) and effectiveness (3.71). In contrast, the respondents reported that the use of the LC strategic action of ‗automating services using technology‘ was much less widespread (only 76% of respondents). This result is in accordance with the general neglect of LC strategic actions among these service firms.
Table 6: Method Variability: Implementation And Effectiveness of Strategic Management Actions
Strategic Actions Implementation Effectiveness
Mean SD Adoption
(%) Mean SD Ranking
1. Arrange for senior employees to supervise
service methods of junior employees (CA) 3.98 0.80 99 3.92 0.82 1
2. Standardisation of processes and operations
(CR) 3.91 0.92 98 3.82 0.87 2
3. Utilise employee panel discussions to enhance
experience and knowledge (UR) 3.73 0.93 99 3.71 0.96 3
4. Automate services using technology (LC) 2.81 1.28 76 3.34 0.87 4
4.5 Effort Variability
As shown in Table 7, the service firms in the present sample had very high levels of implementation with regard to all of the strategic actions to address ‗effort variability‘—especially the CA strategy of ‗linking employees‘ performance evaluation with rewards and penalties‘ (implementation level of 4.10); this strategy also had a high level of effectiveness (3.87). The UR strategic action of ‗cultivating an enthusiastic customer-focused organisational culture‘ also had a high level of implementation (3.93) and a very high adoption rate (99%). All of these strategic actions had high levels of effectiveness.
Table 7: Effort variability: Implementation and Effectiveness of Strategic Management Actions
Strategic Actions Implementation Effectiveness
Mean SD Adoption
(%)
Mean SD Ranking
1. Link employees‘ performance evaluation with rewards and penalties (CR)
4.10 0.94 97 3.87 0.89 1
2. Cultivate an enthusiastic customer-focused organisational culture (UR)
3.93 0.82 99 3.74 0.82 2
3. Educate and encourage employees to work hard (CA)
3.76 0.98 97 3.66 0.89 3
Totals 3.93 0.91 3.75 0.86
4.6 Decision Variability
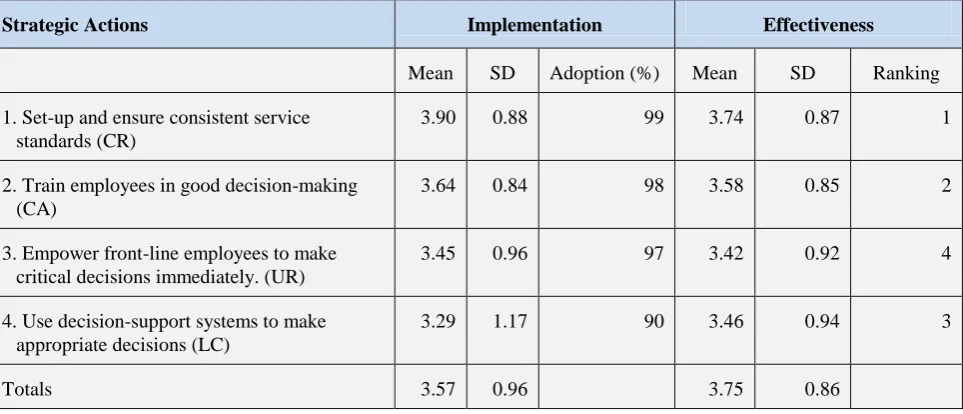
As shown in Table 8, the CR strategic action of ‗setting-up and ensuring consistent service standards‘ was widely adopted by the service firms (99%) to address the problem of ‗decision variability‘. This strategy also had high levels of implementation (mean 3.90) and effectiveness (mean 3.74). The CA strategic action of ‗training employees in good decision-making‘ was also widely adopted (98%) with significant levels of implementation (3.64) and effectiveness (3.58).
Although the notion of ‗empowerment‘ has become popular as a means of solving service problems on the spot, the UR strategic action of ‗empowering front-line employees to make critical decision immediately‘ recorded only moderate levels of implementation (3.45) and effectiveness (3.42) in the present study. The LC action of ‗using decision-support systems to make appropriate decisions‘ was being gradually adopted by the service firms (90%), the implementation level was moderate (3.29), but its effectiveness was already significant (3.46).
Table 8: Decision Variability: Implementation and Effectiveness of Strategic Management Actions
Strategic Actions Implementation Effectiveness
Mean SD Adoption (%) Mean SD Ranking
1. Set-up and ensure consistent service standards (CR)
3.90 0.88 99 3.74 0.87 1
2. Train employees in good decision-making (CA)
3.64 0.84 98 3.58 0.85 2
3. Empower front-line employees to make critical decisions immediately. (UR)
3.45 0.96 97 3.42 0.92 4
4. Use decision-support systems to make appropriate decisions (LC)
3.29 1.17 90 3.46 0.94 3
4.7 Discussion and Management Implications
It is apparent that most of the strategic actions suggested in this study have been widely adopted. Many have high levels of implementation and have resulted in effective management of employee variability. The service firms examined here were especially concerned about ‗effort variability‘, for which all three of the suggested strategies were widely adopted; indeed, as shown in Table 7, the overall average of the means for the level of implementation of these three actions was 3.93, which was very high compared with other strategies. The service firms in the present sample were also concerned to reduce ‗capability variability‘ and ‗method variability‘, for which the suggested strategies had overall average mean levels of implementation of 3.68 and 3.61 respectively (see Table 5 and Table 6).
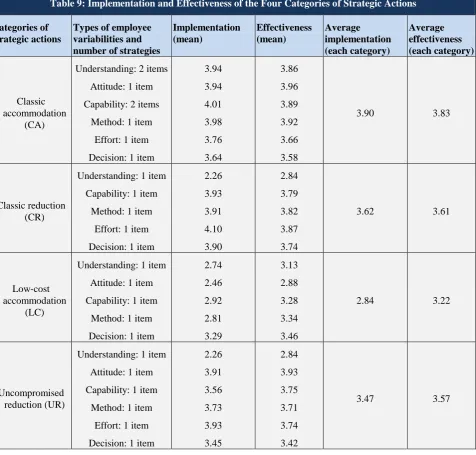
In terms of the categorisation of the various strategies into four categories: ‗classic accommodation‘ (CA), ‗classic reduction‘ (CR), ‗low-cost accommodation‘ (LC), and ‗uncompromised reduction‘ (UR)—it is apparent that the traditional CA and CR strategies were the preferred management actions to address the problems posed by employee variability. As shown in Table 9, the levels of implementation of the CA strategic actions were very high (overall average mean of 3.90). The strategic actions in the CR category were also emphasised by the respondents (overall average mean of 3.62).
Table 9: Implementation and Effectiveness of the Four Categories of Strategic Actions
Categories of strategic actions
Types of employee variabilities and number of strategies
Implementation (mean) Effectiveness (mean) Average implementation (each category) Average effectiveness (each category) Classic accommodation (CA)
Understanding: 2 items
Attitude: 1 item
Capability: 2 items
Method: 1 item
Effort: 1 item
Decision: 1 item
3.94 3.94 4.01 3.98 3.76 3.64 3.86 3.96 3.89 3.92 3.66 3.58
3.90 3.83
Classic reduction (CR)
Understanding: 1 item
Capability: 1 item
Method: 1 item
Effort: 1 item
Decision: 1 item
2.26 3.93 3.91 4.10 3.90 2.84 3.79 3.82 3.87 3.74
3.62 3.61
Low-cost accommodation
(LC)
Understanding: 1 item
Attitude: 1 item
Capability: 1 item
Method: 1 item
Decision: 1 item
2.74 2.46 2.92 2.81 3.29 3.13 2.88 3.28 3.34 3.46
2.84 3.22
Uncompromised reduction (UR)
Understanding: 1 item
Attitude: 1 item
Capability: 1 item
Method: 1 item
Effort: 1 item
Decision: 1 item
2.26 3.91 3.56 3.73 3.93 3.45 2.84 3.93 3.75 3.71 3.74 3.42
3.47 3.57
their implementation levels were quite low (2.84) compared with other categories of strategies. It is perhaps surprising that these LC strategies were relatively neglected--given that most of them involve the use of automated services or
self-service by customers, which can not only reduce employee variability but also reduce the self-service provider‘s costs. The
explanation for the relatively low adoption of these LC strategies might be customer preference. Perhaps the customers simply do not like using automatic machines and/or serving themselves.
The managerial implication arising from these findings is that service firms should recognise that automation and the utilisation of electronic information systems are the trend in all sectors of the service industry. These tools enable new services to be delivered while simultaneously reducing the time and costs involved in rendering present services (Bianchi; 2001). As Nadler and Tushman (1999) have noted, these new technologies make it ― easier, faster, and cheaper to identify and serve targeted micro-markets in ways that were physically impossible or prohibitively expensive in the past‖ (Nadler and Tushman, 1999, P. 49). Service managers therefore need to continuously develop effective user-friendly automated systems. They also need to identify the main obstacles that inhibit their customers using such systems. This will enable managers to take effective action to eliminate such obstacles while simultaneously providing incentives and rewards to promote the use of cost-saving automated service systems that minimise the adverse effects of employee variability.
5. Conclusions
Employee variability has the potential to have significant adverse effects on service quality. The reduction of such variability in order to provide consistent levels of service to customers is thus a critical issue for service providers. This pioneering study has addressed this issue by proposing a systematic typology of employee variability and suggested strategic managerial actions that can be used by service firms to minimise the effects of such variability. The proposed typology of employee variability and the suggested strategic actions have also been exemplified in an empirical study of Taiwanese service firms of high repute.
The study has shown that the service companies in the present sample preferred ‗traditional‘ strategic actions--such as those in the ‗classic accommodation‘ (CA) and ‗classic reduction‘ (CR) categories. However, the study has also demonstrated that the strategic actions in the ‗low-cost accommodation‘ (LC) category also have the potential to provide
significant improvement effects while simultaneously offering the advantage of decreasing the service provider‘s costs.
It is apparent from the study that service firms would be well advised to pay more attentions to these strategic actions.
The findings of the present study could be usefully extended in future research in this area. For example, it would be interesting to compare the strategic actions adopted by firms in different service sectors. It would also be interesting to assess the strategic actions currently being used by various service firms with a view to ascertaining whether any of them need to be improved (and how they might be improved). In this regard, the present author plans several future studies in this important area of research.
References
[1] Almor, Tamar, & Hashai, Niron (2004). The competitive advantage and strategic configuration of knowledge – intensive, small-and medium-sized multinationals: A modified resource-based view‖. Journal of International Management, 10(4), 479-500.
[2] Ashill, Nicholas J., Carruthers, Janet, & Krisjanous, Jayne (2006). The effect of management commitment to service quality and frontline employee affective and performance outcomes: An empirical investigation of the New Zealand public healthcare sector. Int. J. Nonprofit Volunt. Sect. Mark., 11, 271-287.
[3] Bianchi, Alejandro Jose (2001). Management indicators model to evaluate performance of IT organizations. Management of Engineering and Technology, PICMET ‘01, Portland International Conference.
[4] Bitner, Mary Jo., Booms, Bernard H., & Mohr, Lois A. (1994). Critical service encounters: The employees‘ viewpoint. Journal of Marketing, 58(4), 95-106.
[5] Bolton, R., & Drew, J. H. (1991). A multistage model of customers‘ assessment of service quality and value. Journal of Consumer Research, 17, 375-384.
[6] Boshoff, C., & Allen, J. (2000). The influence of selected antecedents on frontline staff perceptions of service recovery performance. International Journal of Service Industry Management, 11(1), 63-90.
[7] Buzzell R. D., & Gale, B. T. (1987). The PIMS principles: Linking strategy to performance, New York: The Free
[8] Chebat, J. C., & Kollias, P. (2000). The impact of empowerment of customer contact employees‘ roles in service
organizations. Journal of Service Research, 3, 66-81.
[9] Cohen, S., & Brand, R. (1993). Total quality management in government: A practical guide for the real world. San Francisco: Jossey-Bass.
[10] Darby, D., & Daniel, K. (1999). Factors that influence nurses customer orientation. Journal of Nursing Management, 7, 271-280.
[11] Dean, Alison M. (2004). Links between organizational and customer variables in service delivery: Evidence, contradictions and challenges. International Journal of Service Industry Management, 15(3/4), 332-350.
[12] Fitzsimmons, J. A., & Fitzsimmons, M. J. (2008). Service Management: Operations, Strategy, and Information Technology (6th ed.). New York: McGraw-Hill.
[13] Frei, F. X. (2006). Breaking the trade-off between efficiency and service. Harvard Business Review, 84(11), 92-101.
[14] George, Babu P., & Hegde, Purva G. (2004). Employee attitude towards customers and customer care challenges in
banks. The International Journal of Bank Marketing, 22(6/7), 390-406.
[15] Gwinner, Kevin P., Bitner, Mary Jo., Brown, Stephen W., & Kumar, Ajith (2005). Service customization through
employee adaptiveness. Journal of Service Research: 8(2), 131-148.
[16] Halbesleben, J. R. B., & Buckley, M. R. (2004). Managing customers as employees of the firm: new challenges for human resources. Personnel Review, 8(2), 131-148.
[17] Heskett, James L. (1987). Lessons in Service Sector. Harvard Business Review, 65(3/4), 118-126.
[18] Hsieh, Y. M., & Hsien, A. T. (2001). Enhancement of service quality with job standardization. The Service Industries Journal, 21(3), 147-166.
[19] Hurley, Robert F. (1998). Customer service behaviour in retail settings: A study of the effect of service provider personality. Academy of Marketing Science Journal, 26(2), 115-127.
[20] Johnson, T., & Ventura, R. (2004). Applied informatics for quality assessment and improvement. Journal of Nursing Care Quality, 19(2), 100-105.
[21] King, C.A., & Garey, J. G. (1997). Relational quality in service encounters. International Journal of Hospitality Management, 16(1), 39-63.
[22] Lewis, Barbara R., & Garey, Gard O. S. (1998). Intra-organizational aspects of service quality management: The employees‘ perspective. The Service Industries Journal, 18(2), 64-89.
[23] Maddem, H., R., Smart, Maull A., & Baker, P. (2007). Customer satisfaction and service quality in UK financial
service. International Journal of Operations & Production Management, 27(9), 999-1019.
[24] Nadler, David A., & Tushman, Michael L. (1999). The organization of the future: Strategic imperatives and core competencies for the 21st century. Organizational Dynamics, 28(1), 45-60.
[25] Parasuraman, A., Zeithaml, Valarie A., & Berry, Leonard L. (1985). A conceptual model of service quality and its implications for the future research. Journal of Marketing , 49(3), 41-50.
[26] Parasuraman, A., Zeithaml, Valarie A., & Berry, Leonard L. (1988). SERVQUAL: A multiple item scale for measuring consumer perceptions of service quality. Journal of Retailing, 64(1), 12-40.
[27] Parasuraman, A., Berry, Leonard L., & Zeithaml, Valarie A. (1991). Understanding customer expectations of service. Sloan Management Review, 32(3), 39-48.
[28] Schlesinger, L. A., & Heskett, J. L. (1991). Breaking the cycle of failure in services. Sloan Management Review, 32( ), 17-28.
[29] Shi, Jia, & Yip, Leslie (2007). Driving innovation and improving employee capability: the effects of customer knowledge sharing on CRM. The Business Review, 7(1), 107-112.
[30] Silvestro, R. (2002). Dispelling the modern myth: employee satisfaction and loyalty drive service productivity. International Journal of Operations & Production Management, 22(1), 30-49.
[32] Ulwick, Anthony W. (2002). Turn customer input into innovation. Harvard Business Review, 80(1), 91-97.
[33] Wang, Yonggni, Lo, Hing-Po & Yang, Yongheng (2004). An integrated framework for service quality, customer value, satisfaction: Evidence from China telecommunication industry. Information Systems Frontiers, 6(4), 325-340.
[34] Zeithaml, Valarie A., Berry, Leonard L., & Parasuraman, A. (1988). Communication and control processes in the
delivery of service quality. Journal of Marketing, 52(2), 35-48.