Copyright © 2004, American Society for Microbiology. All Rights Reserved.
The Ras/Protein Kinase A Pathway Acts in Parallel with the
Mob2/Cbk1 Pathway To Effect Cell Cycle Progression
and Proper Bud Site Selection
Lisa Schneper, Alicia Krauss,† Ryan Miyamoto,‡ Shirley Fang,
and James R. Broach*
Department of Molecular Biology, Princeton University, Princeton, New Jersey 08544 Received 26 June 2003/Accepted 24 October 2003
InSaccharomyces cerevisiae, Ras proteins connect nutrient availability to cell growth through regulation of protein kinase A (PKA) activity. Ras proteins also have PKA-independent functions in mitosis and actin repolarization. We have found that mutations inMOB2orCBK1confer a slow-growth phenotype in aras2⌬
background. The slow-growth phenotype ofmob2⌬ras2⌬cells results from a G1delay that is accompanied by an increase in size, suggesting a G1/S role for Ras not previously described. In addition,mob2⌬strains have imprecise bud site selection, a defect exacerbated by deletion ofRAS2. Mob2 and Cbk1 act to properly localize Ace2, a transcription factor that directs daughter cell-specific transcription of several genes. The growth and budding phenotypes of the double-deletion strains are Ace2 independent but are suppressed by overexpression of the PKA catalytic subunit, Tpk1. From these observations, we conclude that the PKA pathway and Mob2/ Cbk1 act in parallel to determine bud site selection and promote cell cycle progression.
Ras proteins are highly conserved, small monomeric GTPases that function as molecular switches in signal trans-duction pathways to regulate cell growth and differentiation in
response to various environmental cues. InSaccharomyces
cer-evisiae, Ras proteins are encoded by two genes, RAS1 and
RAS2, and are particularly responsive to changes in nutrient
concentration (4, 5, 55, 57). Deletion of eitherRASgene alone
does not affect growth on rich media. However, deletion of both results in decreased mass accumulation and an attendant
terminal G1cell cycle arrest. Detailed analysis of this
pheno-type has demonstrated that Ras proteins redundantly fulfill an essential function in coupling cell growth to nutrient availabil-ity (29, 35, 37, 56, 60).
Ras proteins maintain an essential basal level of cyclic AMP (cAMP) through their activation of adenylate cyclase, the only
Ras effector protein identified inS. cerevisiae(41). Restoration
of fermentable sugar to starved cells elicits Ras stimulation of adenylate cyclase, resulting in a transient increase in intracel-lular cAMP (10, 15, 60). This cAMP spike is not essential for growth but does accelerate both resumption of growth of sta-tionary-phase cells and germination of spores upon nutrient addition (25). cAMP binds to the inhibitory regulatory subunit of protein kinase A (PKA), thereby releasing the catalytic subunit to phosphorylate numerous substrates affecting metab-olism and transcription (reviewed in references 5 and 58). The
catalytic subunits are encoded by three genes, TPK1, TPK2,
and TPK3, which have both unique and redundant functions
(43, 50, 59). Overexpression of any one of the catalytic subunits
of PKA restores growth toras1⌬ras2⌬strains (59).
In addition to its role in PKA activation, Ras participates in mitosis through a PKA-independent mechanism (38). Deletion
of the Ras-related GTPaseRSR1in aras1⌬ras2⌬strain (but
not in aRAS⫹strain) results in a late mitotic arrest that cannot
be suppressed byTPK1overexpression but can be suppressed
by overexpression of any of a number of genes involved in
mitotic exit, includingDBF2,CDC5,CDC15, andSPO12(38).
These genes function to control the localization and the activ-ity of the protein phosphatase Cdc14 (reviewed in reference 18). Cdc14 plays an integral role in controlling the cell’s
deci-sion to exit from mitosis and enter G1. Although this genetic
evidence supports a function of Ras in exit from mitosis, the exact role of Ras in this process has not been resolved.
Ras proteins also function, independent of PKA, in regulat-ing actin cytoskeleton polarity. The actin cytoskeleton nor-mally polarizes to regions of cell growth. Upon shifting wild-type cells to 37°C, the cytoskeleton temporarily depolarizes, but re-polarizes upon continued incubation at the elevated
temperature (22). In contrast, the cytoskeleton inras2⌬cells
subjected to the same treatment remains depolarized. Overex-pression of a PKA catalytic subunit does not suppress the actin polarity defect.
To further understand the role of Ras inS. cerevisiae, we
performed a genetic screen to identify mutations that cause
lethality or slow growth in aras2⌬ background. The product
encoded by one such mutation,MOB2, exhibits homology with
the mitotic exit network component encoded by MOB1,
al-though Mob2 does not appear to be a member of the mitotic exit network (34). Instead, Mob2 is a component of the RAM signaling network, which localizes and activates the Swi5-like transcription factor Ace2 in the daughter cell nucleus to direct daughter cell-specific transcription of several genes involved in cell separation (8, 39, 64). In addition to Mob2, the RAM signaling network consists of an Ndr/Warts family kinase, Cbk1 (cell wall biosynthesis kinase 1), and the conserved gene
prod-* Corresponding author. Mailing address: Department of Molecular Biology, Princeton University, Princeton, NJ 08544. Phone: (609) 258-5981. Fax: (609) 258-1975. E-mail: [email protected].
† Present address: DuPont Crop Genetics, Newark, DE 19711. ‡ Present address: University of Maryland, School of Medicine, Bal-timore, MD 21210.
108
on September 8, 2020 by guest
http://ec.asm.org/
ucts Hym1, Kic1, Pag1, and Sog2. Accordingly, deletion of
MOB2,CBK1,HYM1,PAG1,KIC1,SOG2, orACE2results in
cells with a cell separation defect (2, 8, 13, 39, 48, 64). Cbk1 and Mob2 also have Ace2-independent functions.
First,cbk1⌬andmob2⌬cells are round rather than ovoid due
at least partially to an inability of daughter cells to grow
api-cally (2, 64). Second, CBK1⌬ cells exhibit altered bud site
selection. Deletion of CBK1 in cells that normally exhibit a
bipolar budding pattern results in cells that are able to choose properly the initial bud site but lose the ability in subsequent generations to form buds solely at the poles (2, 48). Finally,
deletion ofCBK1affects mating projection formation, yet
an-other type of polarized growth. After prolonged exposure of
cbk1⌬cells to pheromone, most cells have one or more small protrusions on the surface instead of the normal-size mating projection (2). Mob2, Pag1, Sog2, and Kic1 interact with Cbk1 and affect its localization and activity (13, 39). Hym1 interacts with Kic1 and Sog2. Deletion of genes encoding RAM mem-bers confers cell separation, bipolar budding, apical growth,
and shmoo formation defects similar to those incbk1⌬strains
(2, 8, 13, 39, 64).
In the current study, we show that deletion ofMOB2,CBK1,
HYM1,KIC1, orPAG1confers a synthetic slow-growth
phe-notype with aras2deletion. This slow-growth phenotype is due
to decreased PKA activation, because it is suppressed by
over-expression ofTPK1and is independent of the daughter
cell-specific transcription program driven by the Cbk1/Mob2 com-plex. Flow cytometry and microscopic analysis of synchronized
cells indicate thatras2⌬mob2⌬strains have a cell cycle defect
in G1/S progression. Since this delay is accompanied by an
increase in size, the phenotype differs from that previously
described for Ras pathway mutants, which exhibit a G1arrest
without an accompanying size increase (26, 61). In addition to
the synthetic slow-growth defect, ras2⌬ mob2⌬ mutations
cause synthetic budding defects that are suppressed by
over-expression ofTPK1, demonstrating a novel role for the Ras/
PKA signal pathway in bud site selection. Thus, the Ras/PKA pathway and the Mob2/Cbk1 pathway share a function impor-tant for cell cycle progression and bud site selection.
MATERIALS AND METHODS
Yeast strains and plasmids.Standard yeast media were used (6). All yeast strains used are listed in Table 1 and were derived from the S288C background. mob2⌬ (Y3012), cbk1⌬ (Y3016), hym1⌬ (Y3027), ace2⌬ (Y3026), pag1⌬
(Y3088),swe1⌬(Y3154), andbub2⌬(Y3017) deletion strains were constructed by PCR-based gene disruption (6) or PCR amplification of deleted loci from either theSaccharomyces Genome Deletion Project (65) or YHQ2h5 (from Haiyan Qi).RAS2 andKIC1deletion strains were constructed as described previously (54, 60). Y3084, Y3085, Y3087, and Y3086 were created by digesting B2521 withHincII (Y3084, Y3085, Y3087) orBsaBI (Y3086) and subsequent transformation into Y3014, Y3025, Y3015, and Y3024. Y3155 was created by digesting B2575 withTth111Iand subsequent two-step gene replacement in Y2813. The presence of the mutations was confirmed by DNA sequencing of a PCR product containing theACE2orCDC28region of interest from the afore-mentioned strains. Remaining strains listed in Table 1 produced in this study were derived by standard genetic techniques utilizing strains listed above and their parents.
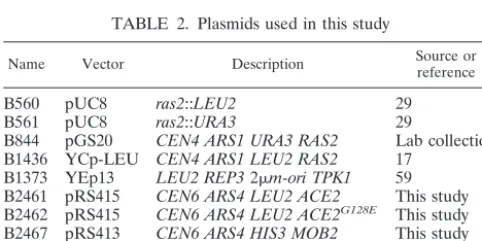
Plasmids used in this study are listed in Table 2.MOB2andACE2were amplified from genomic DNA by PCR using genomic DNA from strain Y2812 and primers hybridizing 500 bp upstream and downstream from the initial codon and stop codon, respectively. TheMOB2PCR product was first subcloned into pGEM-T (Promega), and then theMOB2 EagIfragment was subcloned into the EagIsite of pRS413 (B2467). The primers used to amplifyACE2containedSpeI
andXhoI restriction sites that were used to clone the PCR product into theSpeI andXhoI sites of pRS415 (B2461). TheACE2G128Emutation was introduced into this plasmid by using the Quickchange mutagenesis kit (B2462; Stratagene). The presence of the mutation was confirmed by DNA sequencing.ACE2G128E was subcloned into pRS404, using theSpeI andXhoI sites to create B2521. CDC28Y19Fwas subcloned from pRS414-CDC28Y19F(from Yu Jiang) into the SpeI andXhoI sites of pRS406 to create B2575.
Genetic screen.ras2⌬synthetic mutations were generated by treating Y2465 with ethyl methanesulfonate such that 89% of the cells treated were killed (6). Cells were plated on yeast extract-peptone-dextrose medium (YEPD) at an appropriate density, incubated for 2 days at 30°C, and replica plated to synthetic complete medium (SC) and SC plus 5-fluoroorotic acid (5-FOA). Colonies that grew only on SC were transformed with aCEN LEU2 RAS2plasmid and tested for 5-FOA resistance to show dependence uponRAS2. Strains exhibiting plas-mid-dependent 5-FOA sensitivity were crossed to strain Y797, sporulated, and subjected to tetrad analysis. Tetrads exhibiting 2:2 segregation of 5-FOA sensi-tivity were further analyzed. From 13,000 mutagenized colonies, 44 FOA-sensi-tive colonies whose phenotype was due to a single mutation as determined by segregation analysis and dependent uponRAS2were isolated. Of these, 28 were recessive and 16 were dominant. A YCp50-LEU-based genomic library was used to clone the recessive mutation in Y3011 by complementation. Genomic inserts on plasmids conferring 5-FOA resistance were subcloned into pRS405 and in-tegrated (circular integration) into Y797 such that the locus was marked with LEU2. The resulting strains were crossed to Y3011 to determine linkage. The genes present on the appropriate complementing genomic library plasmid were individually subcloned, transformed into Y3011, and tested for their ability to confer 5-FOA resistance.
FUN 1 staining.Exponentially growing cells were harvested and stained with FUN 1 (6.3M; Molecular Probes) according to the manufacturer’s instructions. Cells were mounted onto cover slips using low-melt-point agarose (1% wt/vol) in GH buffer (10 mM HEPES-KOH [pH 7.2], 2% [wt/vol] glucose) and visualized by using an integrated DeltaVision system (Applied Precision). This included a Nikon Eclipse TE200 inverted microscope, with a 100⫻(numerical aperture, 1.4) objective. A Princeton Instruments charge-coupled device camera was used to capture images.
LY staining.Exponentially growing cells (5⫻106) were pelleted, resuspended in YEPD (90l) containing lucifer yellow (LY) (10l; Molecular Probes), and grown for 1 h at 30°C. Cells were then washed with ice-cold buffer (50 mM succinate, NaOH [pH 5], 100 mM NaCl, 10 mM MgCl2, 20 mM NaN3) and mounted as described previously (49). LY staining was then visualized by using an integrated DeltaVision system as described above.
Bud scar and actin staining.To examine budding patterns, exponentially growing cells (2 ml) were formaldehyde fixed (3.7% final concentration) and stained with calcofluor white (Fluorescent Brightener 28; Sigma; final concen-tration, 0.17 mg/ml) as described previously (6). Cells were placed on a glass slide, and bud scars were visualized with a fluorescent Zeiss Photomicroscope IIIRS with a 63⫻(numerical aperture, 1.25) objective and a UV filter set. Cells that had undergone one or two budding events were analyzed. Buds were scored as distal (positioned in the third of the cell opposite the birth scar), proximal (positioned in the third of the cell next to the birth scar), or medial (positioned in the middle third of the cell). In the case of strains containing aMOB2deletion, chains or clusters of cells were analyzed based upon the location of a cell with a birth scar (2). Axial budding was examined by calcofluor white staining and time-lapse microscopy. To examine actin polarization in mitotic cells, exponen-tially growing cells were fixed and stained with rhodamine phalloidin (2.2M; Molecular Probes) followed by staining with calcofluor white as described pre-viously (6). After being stained, cells were washed with phosphate-buffered saline (PBS) (20) and resuspended in mounting medium (100l; 6). An aliquot of stained cells (5l) was placed on a 1% (wt/vol) low-melt-point agarose-PBS patch which had been allowed to set on a concavity slide (PGC Scientifics) and covered with a cover slip (22 by 22 mm). The cells were then visualized by using the integrated DeltaVision system described above. Thirty-five optical sections were taken at 0.2-m intervals, deconvolved, and flattened using softWoRx v. 2.50 (Applied Precision).
To examine actin polarization in mating projections, cells were grown over-night at 30°C in SC-LEU, pH 3.5 (5 ml). Overover-night cultures were diluted into fresh SC-LEU, pH 3.5 (2 ml), to a density of 3⫻106cells/ml and allowed to grow for 2 h at 30°C. Cells were then incubated with␣-factor (10g/ml) for 3 h, fixed with formaldehyde, stained with rhodamine phalloidin and calcofluor white, and visualized as described for mitotic cells.
Cell cycle experiments.Cells were grown in YEPD or SC-LEU and synchro-nized with␣-factor (5g/ml) as described previously (3). Aliquots were removed before␣-factor addition, just after release, and every 15 or 20 min after release.
on September 8, 2020 by guest
http://ec.asm.org/
Cells were fixed as described previously (6), treated with RNase A (0.25 mg/ml in sodium citrate buffer [pH 7.2] overnight at 37°C) and proteinase K (2 mg/ml; 2 h at 50°C), and stained with Sytox green (1M in sodium citrate [pH 7.2]; Molecular Probes). Fluorescence and forward scatter was analyzed using a Bec-ton Dickinson FACScan flow cytometer and Cell Quest software (BecBec-ton Dick-inson). At least 30,000 events were analyzed for each sample. Percentages of cells in G1, S, and G2were determined by using the Dean-Jett-Fox algorithm, which is part of the FlowJo flow cytometry analysis package (version 4; Tree Star, Inc.). Synchronized fixed cells were also stained with 50 ng of 4⬘,6-diamidino-2⬘ phe-nylindole (DAPI) per ml in PBS (6), sonicated briefly, and examined microscop-ically. Alternatively, cells were synchronized with␣-factor, washed, and mounted on a concavity slide containing a YEPD-agarose (1% [wt/vol]) pad. Time-lapse microscopy was performed at 5-min intervals.
Trehalose assay.Cells were grown in triplicate for 4 days in YEPD (5 ml) at 30°C. Trehalose levels were measured as described previously (30). Purified porcine kidney trehalase and a glucose oxidase/peroxidase assay kit were pur-chased from Sigma. Trehalose levels were determined by subtracting the amount
TABLE 1. Strains used in this study
Strain Mating type Genotype Plasmid Source
Y797 MATa his3⌬1 leu2-3,12 ura3-52 trp1-289 ras2⌬gal B844 Lab collection
Y2465 MAT␣ his3⌬1 leu2-3,112 ura3-52 trp1-289 ras2⌬ B844 Lab collection
Y2811 MATa ura3-52 leu2-3,112 ade2-101 his3⌬200 Lab collection
Y2812 MAT␣ ura3-52 leu2-3,112 trp1⌬1 his3⌬200 Lab collection
Y2813 MATa ura3-52 leu2-3,112 ade2-101 his3⌬200 ras2::LEU2 This study
Y3011 MAT␣ his3⌬1 leu2-3,112 ura3-52 trp1-289 ras2⌬mob2-1 B844 This study
Y3012 MATa ura3-52 leu2-3,112 ade2-101 his3⌬200 mob2::HIS3 This study
Y3013 MAT␣ ura3-52 leu2-3,112 trp1⌬1 his3⌬200 ras2::URA3 This study
Y3014 MATa ura3-52 leu2-3,112 his3⌬200 trp1⌬1 This study
Y3015 MATa ura3-52 leu2-3,112 his3⌬200 trp1⌬1 ras2::URA3 mob2:HIS3 This study
Y3016 MATa ura3-52 leu2-3,112 ade2-101 his3⌬200 cbk1::HIS3 This study
Y3017 MATa ura3-52 leu2-3,112 trp1⌬1 his3⌬200 mob2::HIS3
bub2::kanMX This study
Y3018 MATa ura3-52 leu2-3,112 his3 mob2::HIS3 ras2⌬ B844 This study
Y3019 MAT␣ ura3-52 leu2-3,112 his3 ade2-101 cbk1::HIS3 ras2⌬ B844 This study
Y3020 MATa/MAT␣ ura3-52/ura3-52 leu2-3,112/leu2-3,112 his3⌬200/his3⌬200
ADE2/ade2-101 TRP1/trp1⌬1 This study Y3021 MATa/MAT␣ ura3-52/ura3-52 leu2-3,112/leu2-3,112 his3⌬200/his3⌬200
ADE2/ade2-101 TRP1/trp1⌬1 ras2::URA3/ras2::URA3 This study Y3022 MATa/MAT␣ ura3-52/ura3-52 leu2-3,112/leu2-3,112 his3⌬200/his3⌬200
ADE2/ade2-101 TRP1/trp1⌬1 mob2::HIS3/mob2::HIS3 This study Y3023 MATa/MAT␣ ura3-52/ura3-52 leu2-3,112/leu2-3,112 his3⌬200/his3⌬200
ADE2/ade2-101 TRP1/trp1⌬1 ras2::URA3/ras2::URA3 mob2::HIS3/mob2::HIS3
This study
Y3024 MATa ura3-52 leu2-3,112 his3⌬200 trp1⌬1 ras2::URA3 This study
Y3025 MATa ura3-52 leu2-3,112 his3⌬200 trp1⌬1 mob2::HIS3 This study
Y3026 MAT␣ ura3-52 leu2-3,112 his3⌬200 trp1⌬1 ace2::kanMX This study
Y3027 MATa ura3-52 leu2-3,112 ade2-101 his3⌬200 hym1::HIS3 This study
Y3028 MATa ura3-52 leu2-3,112 ade2-101 his3⌬200 ras2::URA3 This study
Y3082 MATa/MAT␣ ura3-52/ura3-52 leu2-3,112/leu2-3,112 his3⌬200/his3⌬200
ADE2/ade2-101 TRP1/trp1⌬1 cbk1::HIS3/cbk1::HIS3 This study Y3083 MATa/MAT␣ ura3-52/ura3-52 leu2-3,112/leu2-3,112 his3⌬200/his3⌬200
ADE2/ade2-101 TRP1/trp1⌬1 cbk1::HIS3/cbk1::HIS3 ras2::URA3/ras2::URA3
This study
Y3084 MATa ura3-52 leu2-3,112 his3⌬200 trp1⌬1 ACE2G128E This study
Y3085 MATa ura3-52 leu2-3,112 his3⌬200 trp1⌬1 mob2::HIS3
ACE2G128E This study
Y3086 MATa ura3-52 leu2-3,112 his3⌬200 trp1⌬1 ras2::URA3 ACE2G128E This study
Y3087 MATa ura3-52 leu2-3,112 his3⌬200 trp1⌬1 ras2::URA3 mob2:HIS3
ACE2G128E This study
Y3088 MATa ura3-52 leu2-3,112 his3⌬200 trp1⌬1 pag1::HIS3 This study
Y3089 MAT␣ ura3-52 leu2-3,112 his3⌬200 trp1⌬1 kic1::URA3 This study
Y3090 MAT␣ ura3-52 leu2-3,112 his3⌬200 ade2-101 ras2::URA3 This study
Y3154 MATa ura3-52 leu2-3,112 ade2-101 his3⌬200 ras2::LEU2
swe1::KAN This study
Y3155 MATa ura3-52 leu2-3,112 ade2-101 his3⌬200 ras2::LEU2
cdc28Y19F This study
Y3157 MAT␣ ura3-52 leu2-3,112 his3⌬200 trp1⌬1 mob2::HIS3
ras2::URA3 This study
TABLE 2. Plasmids used in this study
Name Vector Description Source orreference
B560 pUC8 ras2::LEU2 29 B561 pUC8 ras2::URA3 29
B844 pGS20 CEN4 ARS1 URA3 RAS2 Lab collection B1436 YCp-LEU CEN4 ARS1 LEU2 RAS2 17
B1373 YEp13 LEU2 REP32m-ori TPK1 59 B2461 pRS415 CEN6 ARS4 LEU2 ACE2 This study B2462 pRS415 CEN6 ARS4 LEU2 ACE2G128E This study
B2467 pRS413 CEN6 ARS4 HIS3 MOB2 This study B2521 pRS404 TRP1 ACE2G128E This study
B2575 PRS406 URA3 CDC28Y19F This study
on September 8, 2020 by guest
http://ec.asm.org/
of glucose present in mock-treated extracts from the amount of glucose in trehalase-treated extracts and comparing to a standard curve. Protein concen-tration was determined using the Bio-Rad protein assay according to the man-ufacturer’s instructions.
RNA isolation and Northern analysis.Total RNA was isolated by extraction with hot acidic phenol (1). Fifteen micrograms of total RNA was fractionated on a 1% agarose gel (0.1 M sodium borate buffer [pH 8.3], 7.5% formaldehyde), transferred to a Nytran SuperCharge membrane (Schleicher & Schu¨ll), baked, and probed with32P-labeled (Random Primers Labeling System; Invitrogen) PCR-generated DNA according to the manufacturer’s directions. Signal inten-sity was quantified using a STORM 860 imaging system (Molecular Dynamics).
RESULTS
mob2⌬ confers a synthetic slow-growth phenotype with
ras2⌬.To further our understanding of the cellular processes
affected by Ras proteins in yeast, we conducted a screen to identify mutations that confer lethality or slow growth in a
ras2⌬strain. One mutant isolated was suppressed by
introduc-tion of either MOB2orRAS2 on a low-copy-number vector
into the mutant background (Fig. 1A). Linkage analysis veri-fied that the synthetic growth phenotype was due to a mutation
at or near the MOB2 locus (data not shown). Deletion of
MOB2confers a synthetic growth phenotype withras2⌬(Fig.
1B). Together, these results demonstrate that the mutation
conferring a synthetic slow-growth phenotype withras2⌬in the
original strain isolated is inMOB2. Deletion ofMOB2alone
does not affect growth in the S288C background used at 30, 14,
or 37°C (data not shown). Deletion ofMOB2does not affect
the growth of strains containing deletions ofRAS1orGPA2, a
G␣homologue that affects cAMP levels in a pathway parallel
to Ras (data not shown). Mutations that downregulate Ras
signaling, such as aras2C318Sallele or thesrv2-1allele (14, 25),
do not confer a slow-growth phenotype to amob2⌬strain (data
not shown).
Mob2 physically associates with the Cbk1 kinase, which lo-calizes to regions of cell growth as well as the nucleus (8, 64). Mob2 is required for daughter cell specific-nuclear localization of Cbk1 and Ace2. Other members of the Cbk1 signaling pathway include Hym1, Pag1, and Kic1 (2, 39). Tetrad analysis
shows that deletion ofCBK1,HYM1,PAG1, orKIC1confers a
synthetic slow-growth phenotype in a ras2⌬ strain (Fig. 1C).
Deletion of SGT2, ECM10, or SEC28, which encode gene
products that have been found in a complex with Cbk1, does
not affect growth of either amob2⌬orras2⌬strain (23; data
not shown). Together, these data suggest that RAS2 and
MOB2/CBK1/HYM1/PAG1/KIC1function in parallel pathways, either of which is necessary for efficient cell growth.
Deletion ofCBK1affects the yeast’s ability to form mating
projections in response to pheromone and, in the case of cells exhibiting a bipolar budding pattern, to correctly position the
FIG. 1. mob2⌬confers a synthetic slow-growth phenotype to aras2⌬strain. (A) Strain Y3011 (ras2 mob2[CEN-RAS2-URA3]) harboring, from top to bottom,[CEN-LEU2],[CEN-LEU2-RAS2],[CEN-HIS3], or[CEN-HIS3-MOB2]were grown in SC liquid medium, spotted onto SC and SC plus FOA plates in fivefold serial dilutions, and incubated at 30°C. (B) Tetrad analysis of Y3012 (mob2⌬)⫻Y3013 (ras2⌬). A representative tetratype tetrad is labeled and shown at the left of the tetrads. At least 10 tetrads were analyzed with consistent results (mob2⌬ras2⌬spore clones are circled). (C)cbk1⌬,hym1⌬,pag1⌬, andkic1⌬confer a synthetic slow-growth phenotype withras2⌬. In all subpanels, representative tetratype tetrads are labeled and shown. For each strain, at least 10 tetrads were analyzed with results fully consistent with those shown. (Left to right) Tetrad analysis of Y3013 (ras2⌬)⫻Y3016 (cbk1⌬), Y3013 (ras2⌬)⫻Y3027 (hym1⌬), Y3090 (ras2⌬)⫻Y3088 (pag1⌬), and Y2813 (ras2⌬)⫻Y3089 (kic1⌬).
on September 8, 2020 by guest
http://ec.asm.org/
next bud. The polarisome, consisting of Spa2, Bud6, Pea2, and Bni1, also plays a role in these pathways (reviewed in refer-ences 45 and 46). To determine if Mob2 or Ras2 was acting in a pathway parallel to the polarisome, strains containing single
deletions in each component (spa2⌬,bud6⌬,pea2⌬, orbni1⌬)
were crossed to strains containing either aMOB2or aRAS2
deletion. Tetrad analysis demonstrated that none of the prog-eny from this cross had a slow-growth phenotype (data not shown). Since no synthetic effects were observed, this
experi-ment suggests that neitherRAS2norMOB2acts in a pathway
essential for growth that is parallel with the polarisome.
Overexpression ofTPK1suppresses themob2⌬ras2⌬ syn-thetic growth defect. To test whether Tpk mediated the Ras function that acts in parallel with Mob2, we determined whether Tpk overexpression could suppress the slow-growth
phenotype of aras2⌬mob2⌬strain. As evident from Fig. 2A,
overexpression of TPK1 in a ras2⌬ mob2⌬ strain or aras2⌬
cbk1⌬strain rescues their slow-growth phenotype.
Since the role of Ras in mitotic exit is Tpk independent, the above result suggests that this particular function of Ras in mitotic exit does not cause the synthetic slow-growth
pheno-type ofras2⌬mob2⌬strains (38). To further analyze this, we
examined the effect of BUB2 deletion on the mob2⌬ ras2⌬
slow-growth phenotype. In the absence of Bub2, the mitotic exit network is active and cells do not arrest in the presence of the microtubule-destabilizing agent nocadazole (reviewed in
reference 16). If Mob2 and Ras2 function upstream ofBUB2in
the mitotic exit network, then deletion ofBUB2should
elimi-nate the growth delay of themob2⌬ras2⌬mutant; however,
deletion of BUB2 has no effect on the growth rate of the
mob2⌬ras2⌬double mutant (Fig. 2B). Furthermore, overex-pression of Cdc14, the downstream target of the mitotic exit network, does not suppress the growth defect of the double mutant (data not shown). Thus, the growth defect observed in the mob2⌬ras2⌬strain is independent of the role of Ras in mitosis.
Deletion of MOB2does not increase trehalose levels of a
ras2⌬strain. Strains with reduced PKA activity exhibit phe-notypes characteristic of increased stress resistance, including high trehalose levels and heat shock resistance. Inhibition of Cbk1 activity results in similar phenotypes that are indepen-dent of cAMP and PKA (63). To test whether deletion of both
RAS2andMOB2results in increased trehalose levels, we
mea-sured trehalose levels inras2,mob2,cbk1,ras2 mob2, andras2
cbk1 cells. As evident from the data in Table 3, deletion of
RAS2 promoted increased trehalose levels, as expected, but
this level was not further increased by deletion of eitherMOB2
orCBK1.
The slow-growth phenotype of themob2⌬ras2⌬strain does not involveACE2.Previous studies have shown that one func-tion of the Mob2/Cbk1 pathway is to activate and direct local-ization of the Swi5-like transcription factor Ace2 to daughter
cell nuclei (8, 64). Deletion ofCBK1results in a cell separation
defect that is at least partly due to decreasedACE2-dependent
transcription of genes, such as chitinase, that are involved in
degrading the cell wall after cytokinesis (8, 48). The ACE2
mutationACE2G128Epartially suppresses thecbk1⌬cell
sepa-ration defect (48). Ace2G128Elocalizes to both the mother and
daughter cell nuclei even in the absence of Cbk1 or Mob2 and
thereby restores expression of genes impaired in cbk1⌬ or
mob2⌬strains (8, 48). Thus, as expected, the level of chitinase
(encoded by CTS1) RNA is drastically reduced in both the
mob2⌬and themob2⌬ras2⌬strain (Fig. 3A). TheACE2G128E
allele partially rescues steady-state levels ofCTS1in both these
strains (Fig. 3A). Also, theACE2G128Eallele partially restores
themob2⌬andmob2⌬ras2⌬cell separation defect (data not
shown). Expression of the ACE2G128E allele in the mob2⌬
ras2⌬strain does not rescue the slow-growth phenotype (Fig.
3B), and deletion ofACE2does not confer a synthetic
slow-growth phenotype in aras2⌬strain (data not shown). Thus, the
FIG. 2. Overexpression ofTPK1suppresses themob2⌬ras2⌬andcbk1⌬ras2⌬slow-growth phenotypes. (A) Y3018 (ras2⌬mob2⌬ [CEN-URA3-RAS2]) and Y3019 (ras2⌬cbk1⌬[CEN-URA3-RAS2]) were transformed with YEp13 (LEU22m) and B1373 (LEU2 TPK12m) and analyzed for growth on SC-Leu and SC-Leu plus FOA as described in the legend to Fig. 1A. (B) Representative tetratype tetrad from tetrad analysis of a diploid resulting from crossing Y3013 and Y3017. More than 10 tetrads were analyzed with consistent results.
TABLE 3. Deletion ofMOB2does not increase trehalose levels of aras2⌬straina
Strain genotype Trehalose (mg/mgof protein)
Wild type ... 3.6⫾0.7 mob2⌬... 1.6⫾0.9 cbk1⌬... 7.4⫾0.3 ras2⌬... 47⫾5 mob2⌬ras2⌬... 30⫾4 cbk1⌬ras2⌬... 35⫾1
aStrains Y3020 (wild type), Y3021 (ras2⌬), Y3022 (mob2⌬), Y3023 (mob2⌬ ras2⌬), Y3082 (cbk1⌬), and Y3083 (cbk1⌬ras2⌬) were grown in YEPD, and trehalose levels were determined as described in Materials and Methods. Num-bers represent the averages for three independent cultures and the standard deviations of the means.
on September 8, 2020 by guest
http://ec.asm.org/
cell cycle delay observed in themob2⌬ras2⌬strain cannot be explained by impaired Ace2 activity.
Actin polarization in mitotic cells is not affected in the
mob2⌬ras2⌬strain.The cortical patch structures formed by yeast actin polymers exhibit marked distribution changes dur-ing the cell cycle that correlate with polarized cellular growth. In the strain background used by Ho and Bretscher (22),
growth of aras2⌬strain is reduced and the actin cytoskeleton
is depolarized at 37°C. Since the role of Ras in actin
repolar-ization is PKA independent and overexpression ofTPK1
sup-presses the growth defect of amob2⌬ras2⌬strain, defects in
actin polarization likely do not contribute to themob2⌬ras2⌬
synthetic growth defect. To confirm that actin polarization was
not affected by the mutations, the mob2⌬ ras2⌬ strain was
stained with rhodamine-conjugated phalloidin. No significant difference was observed in the polarization of cortical patches
in small to medium size buds between themob2⌬ras2⌬strain
and themob2⌬,ras2⌬, or wild-type strain (Fig. 4).
Addition-ally, themob2⌬ras2⌬strain does not exhibit slower growth at
37°C than at 30°C, as would be expected if actin repolarization was affected (data not shown). Mutants having a defect in actin polarization often exhibit an endocytosis defect that can be monitored by uptake of fluorescent vacuolar markers such as
LY and FM464 (reviewed in reference 45). Themob2⌬ras2⌬
strain does not have a synthetic defect in LY endocytosis at
30°C (wild type [Y3014], 90% vacuolar staining;mob2⌬ras2⌬
[Y3015], 92% vacuolar staining;nⱖ150).
When yeast cells are exposed to pheromone, they undergo a
cell cycle arrest and form elongated projections.ras2⌬strains
form mating projections similar to those of wild-type cells,
whilecbk1⌬and mob2⌬ cells do not efficiently form mating
projections, suggesting an inability to maintain polarized
growth (2, 64). mob2⌬ ras2⌬ strains also have a defect in
mating projection formation; the cells do not form long pro-jections, and the actin patches are not consistently concen-trated at the tip of the projections (Fig. 5; data not shown).
However, the phenotype of themob2⌬mutant is too severe to
determine if the double mutant has a synthetic effect.
Overex-pression ofTPK1 does not significantly alter the positions of
the actin patches (Fig. 5).
Deletion ofMOB2andRAS2has a synthetic effect on bud site selection.Diploid cells normally bud at a site in the distal or proximal pole with respect to the birth scar, a process called
bipolar budding. Since deletion ofMOB2affects bipolar
bud-ding, we analyzed budding patterns in mob2and ras2 mob2
strains. Exponentially growing diploid strains containing
ho-mozygous deletions inRAS2,MOB2, or bothRAS2andMOB2
were stained with calcofluor white, and the positions of the first and second budding events were analyzed. As shown in Table
4, deletion ofRAS2does not significantly affect the budding
pattern at either the first or second bud stage. In contrast,
deletion ofMOB2does not affect the position of the initial bud
but has an effect on bud site selection at the second bud stage
(Table 4). In approximately 20% of mob2⌬/mob2⌬cells, the
second bud does not originate from either pole, whereas in
wild-type cells about 5% exhibit nonbipolar budding (P ⬍
0.001). This defect is similar to that of a homozygouscbk1⌬/
cbk1⌬strain (data not shown; 2, 48). Themob2⌬ras2⌬/mob2⌬ FIG. 3. The slow growth of amob2⌬ras2⌬strain is not due to loss of Ace2 localization or activation. (A) Northern blot ofCTS1andACT1 RNA from strains Y3020 (wild type [WT]), Y3021 (ras2/ras2), Y3022 (mob2/mob2), and Y3023 (ras2/ras2 mob2/mob2) transformed with plasmids carrying the indicated markers (YEp13, B1373, B2461, or B2462). Normalized values for the levels ofCTS1mRNA are indicated below the Northern blot. (B) Y3018 (ras2⌬mob2⌬[CEN-URA3-RAS2]) containing a plasmid carrying the indicated marker was spotted onto SC and SC plus FOA as for Fig. 1A.
on September 8, 2020 by guest
http://ec.asm.org/
ras2⌬strain exhibited not only an increase in mislocalization of the second bud but also increased mislocalization of the first
bud (Table 4;P⬍ 0.0005). Thus, Ras2 and Mob2 both
con-tribute to the precision of bipolar budding.
To determine if Ace2 functions downstream from Mob2
with respect to bud site selection, the dominant ACE2G128E
allele was expressed in themob2⌬ras2⌬/mob2⌬ras2⌬strain
on a low-copy-number vector and the positions of the first and second buds were analyzed as before. Although the presence
of this allele partially rescues theCTS1transcriptional defect
of amob2⌬ras2⌬/mob2⌬ras2⌬strain, it does not affect the bipolar budding defect (data not shown). This is consistent
with data demonstrating that the ACE2G128E allele does not
suppress the bipolar budding defect of acbk1⌬strain (48). In
contrast, overexpression ofTPK1did restore the bipolar
bud-ding pattern to approximately that observed in the mob2⌬/
mob2⌬ strain at both the first and second bud stages in the
mob2⌬/mob2⌬ ras2⌬/ras2⌬ strain (Table 4). Thus, the PKA pathway, but not Ace2, affects bud site selection in bipolar budding cells.
Haploid cells bud adjacent to the site at which the previous
bud emerged, a process called axial budding. Deletion ofRAS2
andMOB2caused a defect in axial budding not seen by
dele-tion of either gene alone. Exponentially growing wild-type,
ras2⌬, mob2⌬, andras2⌬mob2⌬cells were stained with cal-cofluor white, and their budding patterns were analyzed (Table
FIG. 4. Filamentous actin is polarized in amob2⌬ras2⌬strain. Calcofluor white (upper panels) and rhodamine phalloidin (lower panels) staining of strains Y3020 (wild type [WT]), Y3021 (ras2⌬/ras2⌬), Y3022 (mob2⌬/mob2⌬), and Y3023 (ras2⌬/ras2⌬mob2⌬/mob2⌬) is shown. Bars ⫽5m.
FIG. 5. Morphological changes and formation of mating projections in response to pheromone. Calcofluor white (first and third columns) and rhodamine phalloidin (second and fourth column) staining of strains Y3014 (wild type [WT]), Y3025 (mob2⌬), and Y3015 (mob2⌬ras2⌬) containing Yep13 (vector) or B1373 (TPK12m) and treated with␣-factor as described in Materials and Methods is shown.
on September 8, 2020 by guest
http://ec.asm.org/
5). Deletion of neither MOB2 nor RAS2 alone significantly affected the fidelity of axial budding, while deletion of both significantly increased bipolar budding at the expense of axial
budding (Table 5,P⬍2⫻10⫺7). Time-lapse experiments of
␣-factor-synchronized cells confirmed a decrease in axial
bud-ding in amob2⌬ras2⌬strain relative to either the wild type or
amob2⌬strain (more than 50 budding events analyzed;P⬍
0.002; data not shown).TPK1overexpression in amob2 ras2
strain suppressed the axial budding defect (Table 5).
Deletion of bothmob2andras2affects growth rate but not viability.In order to determine cell viability, we used FUN 1 staining as an assay of live cells. Live cells metabolize the fluorescent reagent FUN 1, resulting in the formation of
cy-lindrical intravacuolarstructures (CIVS) (Fig. 6A). About 90%
ofmob2⌬ras2⌬cells exhibited positive staining with FUN 1 compared with 94% of wild-type cells (Fig. 6B). Similarly, we detected no loss in viability, as measured by plating efficiency, with any of the mutant strains compared to the wild type (data
not shown). Thus, mob2 ras2strains do not exhibit reduced
viability.
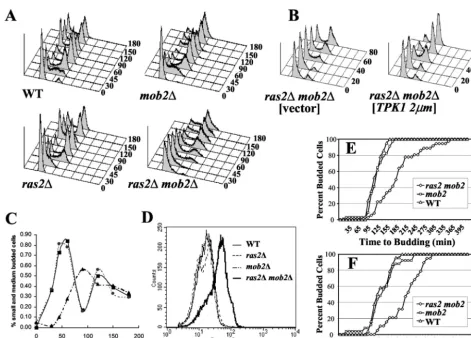
To characterize the slow-growth defect of themob2⌬ras2⌬
strain, we examined wild-type, ras2⌬, mob2⌬, and mob2⌬
ras2⌬strains by flow cytometry following release of cells from
an␣-factor-induced G1arrest (Fig. 7A). As anticipated,
dele-tion ofMOB2resulted in a G2/M defect. Time-lapse
micros-copy demonstrated that this was due to inefficient cell
separa-tion of themob2⌬strain (data not shown; 8, 64). Most (⬎72%)
of the wild-type,ras2⌬, andmob2⌬cells exited G1by 45 min
after release from the␣-factor arrest. In contrast,⬍50% of the
mob2⌬ras2⌬cells exited G1phase at this time. This suggests
that themob2⌬ras2⌬cells have a G1delay. Since
overexpres-sion ofTPK1suppressed the growth defect of amob2⌬ras2⌬
strain, it was likely thatTPK1overexpression would overcome
the observed G1/S delay. Flow cytometry analysis following
release of cells synchronized in G1with␣-factor was used to
determine if overexpression ofTPKsuppressed the G1/S cell
cycle delay observed inmob2⌬ras2⌬cells. As observed
previ-ously,mob2⌬ras2⌬cells exhibited a G1/S delay; however, this
was suppressed by overexpression ofTPK1(Fig. 7B).
Microscopic examination of DAPI-stained cells
synchro-nized as in the flow cytometry experiment supports the G1/S
delay inmob2⌬ras2⌬cells. Wild-type,ras2⌬, andmob2⌬cells
begin budding about 30 min after release from␣-factor arrest,
whilemob2⌬ras2⌬cells begin budding 60 min after release
(Fig. 7C; data not shown). Forward-angle light scattering in a flow cytometer provides a measure of the cell size distribution.
Disruption of eitherRAS2orMOB2alone did not significantly
affect the overall cell size distribution; however deletion of
bothMOB2andRAS2resulted in an increased average cell size
(Fig. 7D).
The observed increase in the length of timemob2⌬ras2⌬
cells spend in G1following␣-factor arrest could be due to an
increase in ␣-factor sensitivity. To address this, wild-type,
mob2⌬, andmob2⌬ras2⌬cells were synchronized with␣ -fac-tor and washed and division time was analyzed using time-lapse microscopy. Cells were followed for two division cycles, and the time between the formation of the first and second buds from the same mother cell was measured (Fig. 7E). On
average, the second bud from mob2⌬ras2⌬mother cells
ap-TABLE 4. ras2⌬andmob2⌬exhibit synthetic bud site selection defects: diploid budding patterna
Strain genotype First bud Second bud
Distal Proximal Medial Distal Proximal Medial
Wild type 99⫾2 1.1⫾1.2 0.3⫾0.3 92⫾4 4.7⫾1.7 3.3⫾2.4
ras2⌬ 98⫾1 1.9⫾0.9 0.9⫾0.7 93⫾4 3.0⫾1.4 6.0⫾2.9 mob2⌬ 97⫾2 2.4⫾1.7 1.6⫾0.8 81⫾4 1.3⫾1.3 18⫾3b
ras2⌬mob2⌬ 82⫾8 1.6⫾0.8 17⫾8c 68⫾4 2.9⫾0.8 29⫾3d
Wild type (vector) 97⫾2 2.3⫾1.2 0.3⫾0.5 76⫾7 17⫾2.4 6.3⫾5.0
mob2⌬(vector) 95⫾4 0⫾0 4.9⫾3.5 84⫾2 0.3⫾0.5 16⫾2
mob2⌬(TPK1) 93⫾5 0.3⫾0.5 6.6⫾4.9 85⫾8 0.3⫾0.5 14⫾7
ras2⌬mob2⌬(vector) 77⫾10 1.9⫾1.6 21⫾8e 68⫾6 3.3⫾2.7 29⫾3f
ras2⌬mob2⌬(TPK1) 94⫾3 0.3⫾0.5 5.2⫾3.7 73⫾22 7.3⫾9.6 19⫾13f
aDiploid strains Y3020 (wild type), Y3021 (ras2⌬/ras2⌬), Y3022 (mob2⌬/mob2⌬), and Y3023 (ras2⌬/ras2⌬mob2⌬/mob2⌬), harboring no plasmid or carrying YEp13 (vector) or B1373 (TPK1), were grown to logarithmic phase and scored for positions of the first and second bud by calcofluor white staining as described in Materials and Methods. Numbers represent the average percentages (⫾standard deviations) of three independent experiments in which at least 100 of each budding event (first buds, second buds) were counted. In all cases, the least-significantPvalue of each of the three independent experiments is reported.
bP⬍0.001 for percent medial buds⫽percent wild-type medial buds.
cP⬍0.0005 for percent medial buds⫽percent wild-type medial buds, andP⬍0.005 for percent medial buds⫽percentmob2⌬medial buds dP⬍0.000005 for percent medial buds⫽percent wild-type medial buds
eP⬍0.0001 for percent medial buds⫽percent wild-type medial buds, andP⬍0.002 for percent medial buds⫽percentras2⌬mob2⌬(TPK1) medial buds. fP⬍0.005 for percent medial buds⫽percent wild-type medial buds.
TABLE 5. ras2⌬andmob2⌬exhibit synthetic bud site selection defects: haploid budding patterna
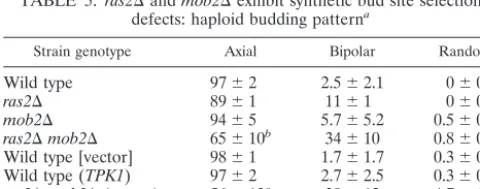
Strain genotype Axial Bipolar Random
Wild type 97⫾2 2.5⫾2.1 0⫾0
ras2⌬ 89⫾1 11⫾1 0⫾0 mob2⌬ 94⫾5 5.7⫾5.2 0.5⫾0.4 ras2⌬mob2⌬ 65⫾10b 34⫾10 0.8⫾0.6
Wild type [vector] 98⫾1 1.7⫾1.7 0.3⫾0.5 Wild type (TPK1) 97⫾2 2.7⫾2.5 0.3⫾0.5 ras2⌬mob2⌬(vector) 56⫾13c 39⫾12 4.7⫾1.2
ras2⌬mob2⌬(TPK1) 92⫾3 8.0⫾1.4 0⫾1.2
aHaploid strains Y3084 (wild type), Y3085 (ras2⌬), Y3086 (mob2⌬), and Y3087 (ras2⌬mob2⌬), harboring no plasmid or carrying YEp13 (vector) or B1373 (TPK1), were grown to logarithmic phase and scored for position of the first bud by calcofluor-white staining as described in Materials and Methods. Numbers represent the average percentages (⫾standard deviations) of three independent experiments in which at least 100 cells were counted.
bP⬍2⫻10⫺7for percent nonaxial buds⫽percent wild-type nonaxial buds and for percent nonaxial buds⫽percentmob2⌬nonaxial buds.
cP⬍6⫻10⫺8for percent nonaxial buds⫽percent wild-type nonaxial buds.
on September 8, 2020 by guest
http://ec.asm.org/
FIG. 6. Slow-growth phenotype ofmob2⌬ras2⌬strains is caused by a growth delay, not loss in viability. (A) Differential interference contrast (left panels) and FUN 1 (right panels) staining of wild-type strain Y3014 (upper panels) andmob2⌬ras2⌬strain Y3015 (lower panels). (B) Percent cells (nⱖ200) exhibiting positive staining with FUN 1 as measured by the appearance of cylindrical intracellular vacuolar structures (CIVS).
FIG. 7. The slow growth of amob2⌬ras2⌬strain is due to a G1delay. (A) Strains Y3084 (wild type [WT]), Y3085 (mob2⌬), Y3086 (ras2⌬), and Y3087 (mob2⌬ras2⌬) were synchronized in G1as described in Materials and Methods. Cells were collected at the indicated times (minutes), stained with Sytox green, and analyzed by fluorescence-activated cell sorting (FACS) as described in Materials and Methods. (B) Strain Y3087 (mob2⌬ras2⌬) was transformed with YEp13 (vector) or B1373 (TPK12m) and synchronized in G1as described in Materials and Methods. Cells were collected at the indicated times, stained with Sytox green, and analyzed by FACS as described in Materials and Methods. (C) Percentages of budded cells as a function of time following release from␣-factor block.■, wild type (Y3084);F,mob2⌬(Y3085);Œ,mob2⌬ras2⌬(Y3087). (D) Forward scatter of asynchronous Y3084, Y3085, Y3086, and Y3087 fixed cells. (E) Cells of the indicated strains were synchronized with ␣-factor and then plated on YEPD and examined by time-lapse microscopy over two generations. Shown is the cumulative percent mother cells with the indicated time interval between the emergence of the first and second buds. (F) Shown is the cumulative percent daughter cells from the experiment for which results are shown in panel E with the indicated interval between birth and emergence of the first bud.
on September 8, 2020 by guest
http://ec.asm.org/
peared approximately 200 min after the emergence of the first bud following release from the arrest, whereas wild-type cells andmob2⌬cells produced a second bud within an average of 118 and 123 min, respectively (Fig. 7E; more than 30 cells
analyzed;P ⬍10⫺17).mob2⌬ ras2⌬daughter cells also took
longer to bud (n⫽19, approximately 250 min,P⬍0.002) than
wild-type (n⫽24, average about 135 min) ormob2⌬(n⫽25,
approximately 140 min (Fig. 7F) cells. Even though the cells
were initially synchronized with ␣-factor, the second- and
third-generationmob2⌬ras2⌬cells analyzed still exhibited a
significant cell cycle delay even though they had not been exposed to this treatment. This indicates that deletion of
MOB2andRAS2results in a true delay in cell cycle
progres-sion rather than exacerbated␣-factor sensitivity.
InSaccharomyces, a morphogenesis checkpoint delays cell cycle progression in response to insults that impair actin orga-nization and/or bud formation (reviewed in reference 32). Var-ious environmental and experimental insults that impair bud formation stabilize the Swe1 kinase, which phosphorylates Cdc28 at Y19 to inhibit kinase activity and cell cycle progres-sion (32, 52, 53). To determine whether the cell cycle delay in
ras2 mob2strains results from an engagement of the
morpho-genesis checkpoint, we examined the effect of deletingSWE1
in amob2⌬ras2⌬strain (Fig. 8). We found that either of these mutations exacerbated the slow-growth defect, such that the triple mutant was extremely sick or, in most cases, dead (Fig.
8). Similarly, the presence of aCDC28Y19Fallele as the sole
copy ofCDC28exacerbated the slow-growth defect ofmob2⌬
ras2⌬ cells (Fig. 8). Due to the cell separation defect of a
mob2⌬strain, we are unable to determine if G2is longer in the mob2⌬ras2⌬ strain than in themob2⌬ strain. The synthetic
effect on bud site selection observed in themob2⌬ras2⌬strain
indicates a cell polarity defect, which may require a Swe1-imposed pause to give the cell sufficient time to complete its required tasks during division.
DISCUSSION
TheMOB2/CBKpathway is required for efficient cell cycle progression in a ras2⌬strain. In a genetic screen to further
our understanding of Ras functions inS. cerevisiae, we found
that mutation ofMOB2results in a slow-growth phenotype in
the absence ofRAS2. The viability ofmob2⌬ras2⌬strains is
similar to that of the wild type, but the cells grow more slowly
due to a G1/S delay that differs from the G0/G1arrest formerly
described for PKA mutants (26). Themob2⌬ras2⌬cells
ex-hibit a G1/S delay accompanied by an increase in cell size,
indicative of a cell cycle defect. In contrast, cAMP/PKA
path-way mutants have a growth defect that causes a G0/G1arrest
with no size increase. Mob2 is part of a signaling network, including Cbk1, Hym1, Pag1, and Kic1, which functions to activate the Ace2 transcription factor and to control polarized morphogenesis (2, 8, 11, 13, 27, 39, 48, 64), and deletion of any
of these genes confers slow growth in a ras2⌬ background.
Thus, the Cbk1 signaling pathway shares a function with Ras2 in cell cycle progression.
Deletion ofMOB2alone in the S288C background used in
this study did not affect cell viability. In contrast, deletion of
CBK1, MOB2,HYM1,PAG1, orKIC1 is lethal in the S288C
background used by theSaccharomycesDeletion Project
Con-sortium (SDPC). However, deletion ofSSD1can suppress the
lethality of deletingCBK1 in the SDPC background (13, 27,
39). Since deletion ofSSD1in the strain background used in
this study does not affect the growth rate of either amob2⌬or
amob2⌬ras2⌬strain, this strain probably does not contain the
SSD1-vallele (data not shown).
mob2⌬ ras2⌬ strains are defective in bud site selection.
Mob2 has a role in bipolar bud site selection in diploid cells, similar to that previously described for Cbk1. In the absence of
MOB2, diploid cells show increased random budding, a defect
that is exacerbated by concurrently eliminatingRAS2.
Further-more,ras2 mob2strains, but neither single mutant alone,
ex-hibit significant bipolar budding as haploids, which under
nor-FIG. 8. Impairment of the morphogenesis checkpoint exacerbates the slow-growth phenotype of amob2⌬ras2⌬strain. (Left) Tetrad analysis of Y3154 (swe1⌬ras2⌬)⫻Y3157 (mob2⌬ras2⌬). Genotypes of spore clones are shown below the panel (MOB2, circle;mob2, diamond;SWE1, filled symbol;swe1, open symbol). (Right) Tetrad analysis of Y3157 (mob2⌬ras2⌬)⫻Y3155 (cdc28Y19Fras2⌬). Individual segregants were
analyzed by PCR amplification andKpnI digestion of theCDC28locus to determine the presence of thecdc28Y19Fmutation. Genotypes of spore
clones are shown below the panel (MOB2, circle;mob2diamond;CDC28, filled symbol;cdc28Y19F, open symbol).
on September 8, 2020 by guest
http://ec.asm.org/
mal circumstances exclusively bud axially. Both budding defects are suppressed by overexpression of the catalytic sub-unit of PKA, implicating a role of the Ras/PKA pathway in bud site selection. Previous studies have demonstrated that loss of PKA activity affects the switch from bipolar to unipolar bud-ding in nitrogen-starved cells, but the identity of the kinase target and the molecular mechanism driving the switch in bud site selection are unknown (43). The axial budding defect
ob-served inras2 mob2cells is likely the result of the cell cycle
delay causing loss of transient spatial cues; however, the bipo-lar defect should not be affected in the same way (7). Many genes affect the process of bud site selection, which involves first marking the positions of the two poles and then selecting the appropriate pole for forming the new bud. Mutations in
either BEM4 orSUR4 give phenotypes similar to those
ob-served for mob2 ras2strains (40). Bem4 interacts with Rho1
and Cdc42, proteins involved in bud emergence but not pole marking. Thus, the synthetic effects of Ras2 and Mob2 on budding may well involve efficiency of recognizing the existing cell polarity rather than establishing it. In addition, these com-ponents may suggest potential targets for the convergence of the Ras/PKA and Mob2/Cbk1 pathways.
What are the downstream targets affected in the mob2⌬
ras2⌬strain?Previous studies have identified PKA-dependent
and PKA-independent roles of the RASgenes. Ras proteins
have PKA-independent functions in mitotic exit and in actin repolarization following heat shock. Since overexpression of
TPK1, encoding a catalytic subunit of PKA, rescues growth of
mob2⌬ras2⌬strains, defects in neither of these cellular roles account for slow growth of the double mutant. Furthermore,
neither deletion ofBUB2nor overexpression ofCDC14affects
growth of amob2⌬ras2⌬strain, although either of these
con-ditions would be expected to affect growth if a defect in the
mitotic exit network was involved. In addition, the mob2⌬
ras2⌬strain grows similarly at 30 and 37°C; if actin polarity was affected, a decrease in growth would be expected at the higher temperature. Therefore, Ras signaling through PKA is
impor-tant for cellular proliferation of amob2⌬strain.
An important role of Mob2, together with Cbk1, is to direct localization of the transcription factor Ace2 into the daughter cell nucleus, resulting in the activation of several genes in-volved in cell separation (8, 64). Currently, Ace2 is the only known downstream target of Cbk1. We have shown that a
mutant allele of ACE2, ACE2G128E, does not suppress the
slow-growth phenotype of a mob2⌬ras2⌬ strain, although it
partially rescues transcriptional defects of mob2and mob2⌬
ras2⌬strains. Importantly, deletion ofACE2does not confer a
synthetic slow-growth phenotype to a ras2⌬ strain.
Conse-quently, the Mob2/Cbk1 complex is likely signaling to a down-stream target other then Ace2, which is important for cellular
proliferation in the absence ofRAS2.
A likely common target of Ras/PKA and Mob2/Cbk1 is Rho1 (Fig. 9). Rho1 plays a dual role in the regulation of cell
morphology: as a regulatory subunit for 1,3--glucan synthase
and an activator of Pkc1 (12, 21, 28, 36, 42, 44, 47). Activation of Pkc1 by Rho1 results in actin cytoskeleton polarization and cellular integrity preservation via activation of the
mitogen-activated protein kinase cascade. Overexpression ofLRE1, a
negative regulator ofCBK1, rescues the 1,3--glucan synthesis
of a strain containing mutations in the catalytic subunits of
1,3--glucan synthase, suggesting that Cbk1 negatively
regu-lates 1,3--glucan synthase (48, 51, 63). Epistasis analysis
sug-gests thatLRE1functions upstream from GTP association with
RHO1(51). Consistent with the Cbk1 pathway negatively
reg-ulating Rho1, deletions in genes encoding Rho1
GTPase-acti-vating proteins, SAC7 and BEM2, confer a synthetic
slow-growth defect incbk1⌬andhym1⌬strains (27). These results
suggest that loss of Cbk1 signaling may cause constitutive
ac-tivation of Rho1 signaling. Consistent with a role ofRHO1in
bipolar bud site selection, a mutant allele ofBEM2,bem2-101,
or deletion ofROM2, which encodes theRHO1exchange
fac-tor, confers a bipolar budding defect (31, 40). Data suggesting that the Ras/cAMP pathway modulates cell wall biosynthesis
also exists. TheWSCgenes function to activateRHO1(9, 19,
24, 33, 62). Heat shock sensitivity of a wsc1⌬ wsc2⌬ wsc3⌬
strain is suppressed by deletion ofRAS2, and overexpression of
WSC1suppresses the heat shock sensitivity of a ras1⌬ras2⌬
strain overexpressingCYR1(62). Finally, we found that a
dom-inant activated allele ofRHO1confers a slow-growth defect to
aras2⌬strain, consistent with the hypothesis that the synthetic
slow-growth phenotype of themob2⌬ras2⌬strain is due to an
inability to properly regulate RHO1 (L. Schneper and J. R.
Broach, unpublished results). Thus, the observed growth and
budding defects ofmob2⌬ras2⌬strains could be explained by
their upregulation of Rho1.
ACKNOWLEDGMENTS
We thank Mark Rose, Virginia Zakian, Waheeda Khalfan, Elbert Chiang, Haiyan Qi, Yu Jiang, and Angelika Amon for generous gifts of plasmids and strains; Mark Rose, Peter Houston, and Sean Clark for training and assistance on yeast microscopy; David Drubin and Eric FIG. 9. Model for the roles of Ras and Mob2 inS. cerevisiae. Ras proteins have PKA-independent functions in mitotic exit and actin repolarization and PKA-dependent functions affecting metabolism, transcription, and cell growth. Cbk1, together with Mob2, regulates the Ace2 transcription factor, effecting daughter cell-specific gene expres-sion. Cbk1 and Mob2 have additional Ace2-independent functions in regulating apical growth and mating projection formation. Hym1 in-teracts with Kic1 and Sog2, and this complex along with Pag1 inin-teracts with Cbk1 to promote its localization and function. Data presented in this report demonstrate that the Ras/PKA and Cbk1/Mob2 pathways play parallel roles in cell growth and bud site selection, likely through regulation of Rho1 (see Discussion for details). Cbk1 and the Ras/ PKA pathway independently repress cellular trehalose levels through a different mechanism.

![FIG. 3. The slow growth of a mob2RNA from strains Y3020 (wild type [WT]), Y3021 (carrying the indicated markers (YEp13, B1373, B2461, or B2462)](https://thumb-us.123doks.com/thumbv2/123dok_us/8659966.1728103/6.603.124.462.69.329/fig-growth-rna-strains-carrying-indicated-markers-yep.webp)
![FIG. 4. Filamentous actin is polarized in a mob2staining of strains Y3020 (wild type [WT]), Y3021 (� 5� ras2� strain](https://thumb-us.123doks.com/thumbv2/123dok_us/8659966.1728103/7.603.117.470.71.243/fig-filamentous-actin-polarized-staining-strains-wild-strain.webp)