T2-adjusted computed diffusion-weighted imaging: a novel method to enhance tumour
visualization
Lin Cheng*1, Matthew D Blackledge*†1, David J Collins1, Matthew R Orton1, Neil P Jerome1, Thorsten Feiweier2, Mihaela Rata1, Veronica Morgan3, Nina Tunariu1,3, Martin O Leach1, and Dow-Mu Koh1,3
1. Cancer Research UK Cancer Imaging Centre, Division of Radiotherapy and Imaging, The Institute of Cancer Research, London, UK
2. Siemens Healthcare GmbH, Erlangen, Germany
3. Department of Radiology, Royal Marsden Hospital, Sutton, UK
*L Cheng and M D Blackledge have made equal contributions to this text.
† Correspondence: Dr. Matthew Blackledge, Cancer Research UK Cancer Imaging Centre, Division of Radiotherapy and Imaging, The Institute of Cancer Research, London, UK E-mail:
Abstract
Purpose
To introduce T2-adjusted computed DWI (T2-cDWI), a method that provides synthetic
images at arbitrary b-values and echo times (TEs) that improve tissue contrast by
removing or increasing T2 contrast in diffusion-weighted images.
Materials and Methods
In addition to the standard DWI acquisition protocol T2-weighted echo-planar images at
multiple (≥2) echo times were acquired. This allows voxelwise estimation of apparent
diffusion coefficient (ADC) and T2 values, permitting synthetic images to be generated at
any chosen b-value and echo time. An analytical model is derived for the noise
properties in T2-cDWI, and validated using a diffusion test-object. Furthermore, we
present T2-cDWI in two example clinical case studies: (i) a patient with mesothelioma
demonstrating multiple disease tissue compartments and (ii) a patient with primary
ovarian cancer demonstrating solid and cystic disease compartments.
Results
Measured image noise in T2-cDWI from phantom experiments conformed to the
analytical model and demonstrated that T2-cDWI at high computed b-value/TE
combinations achieves lower noise compared with conventional DWI. In patients, T2
-cDWI with low b-value and long TE enhanced fluid signal while suppressing solid
shine-through effects and increase the contrast between tumour and fluid compared with
conventional high-b-value DW images.
Conclusion
T2-cDWI is a promising clinical tool for improving image signal-to-noise, image contrast,
and tumour detection through suppression of T2 shine-through effects.
Key words:
Diffusion-weighted imaging, computed DWI, tumour enhancement, T2 contrast, T2
Introduction
Diffusion-weighted magnetic resonance imaging (DWI) is a non-invasive functional
imaging technique, where endogenous image contrast is generated through differences
in the rate of diffusion of water molecules in different environments. DWI is particularly
attractive in oncological applications as the rate of extracellular water diffusion is
thought to provide a surrogate marker of tissue cellularity and the integrity of cell
membranes[1-3]. In recent years, DWI has become mandatory as a source of oncological
imaging biomarkers for tumour detection and characterization [1]. Furthermore, it has
shown great promise for the assessment of early treatment response due to its ability to
non-invasively provide quantitative and qualitative information at the cellular level
throughout the course of therapy[4; 5].
Computed diffusion-weighted imaging (cDWI) has previously been proposed for
achieving improved image contrast and signal-to-noise ratio (SNR) through the
synthesis of images with arbitrary ‘diffusion weighting’ (b-value); by acquiring images at
a range of lower b-values, it is possible to generate synthetic images corresponding to
arbitrarily high b-values without increasing the scan acquisition time[6]. However, as
cDWI is intrinsically T2-weighted it is often unable to distinguish between cellular
disease and tissues with long T2-relaxation times (e.g. cystic areas, necrosis, fluid, pleural
effusion), leading to a diagnostic misinterpretation phenomenon known as `T2
shine-through'.
In this study we propose a novel method, T2-adjusted computed diffusion-weighted
imaging (T2-cDWI), to produce both ADC and T2, thus enabling the generation of
acquiring a small subset of additional images with different (≥2) echo times. This
implementation allows clinicians to independently modify the level of diffusion- and T2
-weighting for a given image and retrospectively remove or isolate the T2-shine-through
effect [7].
In this article we describe the technology required to perform this novel imaging
strategy, derive mathematical approximations for the noise in T2-cDWI, and validate
these models using a diffusion test-object. We further present two clinical examples of
T2-cDWI where adjusting the T2 and/or diffusion contrast provides improved clinical
interpretation of disease.
Materials and Methods
T2-cDWI Model
We utilise a spin-echo echo-planar imaging (SE-EPI) sequence that allows for the
acquisition of images at multiple combinations of b-values and echo times. The intensity
for a given pixel location in the magnitude image may be modelled by:
𝑆𝑖(𝑏𝑖, 𝑇𝐸𝑖) = 𝑆0∙ exp{−𝑏𝑖 ∙ 𝐴𝐷𝐶} ∙ exp{−𝑇𝐸𝑖∙ 𝑅2} + 𝜀𝑖 (1)
for the ith combination of b and TE, where ADC and R2 = 1/T2 are the tissue apparent
diffusion coefficient and transverse relaxivity respectively. We assume 𝜀𝑖~𝑁(0, 𝜎𝑖) to be
the additive noise. T2-cDWI is an approach whereby enough combinations of b and TE
are acquired (at least 3) such that ADC and R2 may be estimated and then used to
generate signal contrast at bc and TEc, the desired b-value and TE:
where𝑆̂ , 𝐴𝐷𝐶0 ̂, 𝑅̂2are the corresponding estimated values for each voxel determined from the joint fitting.
Noise considerations for T2-cDWI
Equation 1 may be considered a special case of a family of exponential functions:
𝑆 = exp {X ∙ 𝛼} , X = (
𝑏1 𝑇𝐸1 1
⋮ ⋮ ⋮
𝑏𝑁 𝑇𝐸𝑁 1) , 𝛼 = ( 𝐴𝐷𝐶
𝑅2
ln𝑆0 )
such that linearized least-squares estimate of the tissue parameters is given by:
𝛼̂ = (𝑋T𝑋)−1𝑋Tln𝑆
In matrix notation we may write equation 2 as
𝑆𝑐 = exp {X𝑐 ∙ 𝛼̂} = exp{𝐴 ∙ln𝑆} = ∏𝑖=1𝑁 𝑆𝑖𝐴𝑖, X𝑐 = (𝑏𝑐, 𝑇𝐸𝑐, 1) (3)
where 𝐴 = 𝑋𝑐∙ (𝑋𝑇𝑋)−1𝑋𝑇
Using error propagation it is possible to approximate the expected variance of Sc:
𝜎𝑐2 ≈ 𝑆𝑐2∙ ∑ (𝐴𝑆𝑖
𝑖)
2 𝑁
𝑖=1 𝜎𝑖2 (4)
The N-vector A, which depends only on the acquisition parameters of the scan and the
desired computed b-values and TEs, can be complex to compute in the general case. We
suggest an optimised imaging protocol for calculations of ADC and R2 according to the
methodology proposed in [8; 9]: For every image acquired at a minimum possible
b-value and echo time (b1=0, TE1=TEm) for the scanner, 3 images should be acquired with
(b2=0, TE2=TEm+∆TEopt) , and 3 images acquired with (b3=bopt, TE3). The values are
optimised according to the expected tissue properties: bopt≈1.28/ADC (ignoring the
c
TE3 should be the minimum echo time achievable on the scanner for the high b-value
acquisition (for our protocol and scanners a lookup table has been derived to provide
the minimum TE over the range 0≤b≤6000s/mm2, although approximations are
available in [11]). For this specially optimised protocol we find that:
𝐴 = (−𝑏𝑐(𝑇𝐸2 − 𝑇𝐸3) 𝑏3(𝑇𝐸2− 𝑇𝐸1)−
(𝑇𝐸𝑐− 𝑇𝐸2) (𝑇𝐸2− 𝑇𝐸1), −
𝑏𝑐(𝑇𝐸3− 𝑇𝐸1) 𝑏3(𝑇𝐸2− 𝑇𝐸1)−
(𝑇𝐸1− 𝑇𝐸𝑐) (𝑇𝐸2− 𝑇𝐸1),
𝑏𝑐 𝑏3)
𝑆𝑐 = 𝑆1𝐴1∙ 𝑆
2𝐴2 ∙ 𝑆3𝐴3 (5)
𝜎𝑐2 ≈ 𝜎2𝑒−2𝑏𝑐𝐴𝐷𝐶𝑒−2𝑇𝐸𝑐𝑅2{ 𝐴12
𝑒−2𝑇𝐸1𝑅2+
𝐴22
3𝑒−2𝑇𝐸2𝑅2+
𝐴32
3𝑒−2𝑇𝐸1𝑅2𝑒−2𝑏3𝐴𝐷𝐶} (6)
where σ2 is the noise variance for the image acquired with one signal average.
It may be noted that for this protocol multiples of 7 image acquisitions are required to
perform the T2-cDWI calculation. It is therefore of interest to consider regions where
σc2<σ2/7, where improvements in noise may be gained using T2-cDWI over
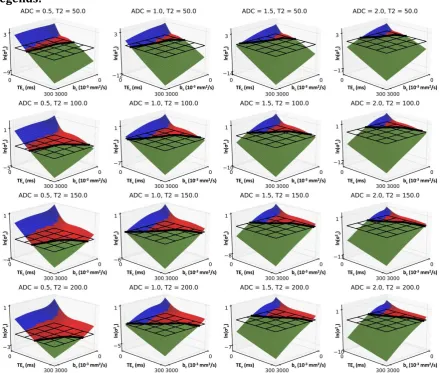
conventionally acquired data. Figure 1 demonstrates the theoretical advantages in noise
can be achieved using this suggested T2-cDWI protocol for a wide range of desired bc
and TEc. Furthermore, T2-cDWI allows the generation of contrast in regions where it
would not be possible to directly acquire the data (i.e. where TEc<TEmin(bc)).
Validation of T2-cDWI models using a diffusion test-object
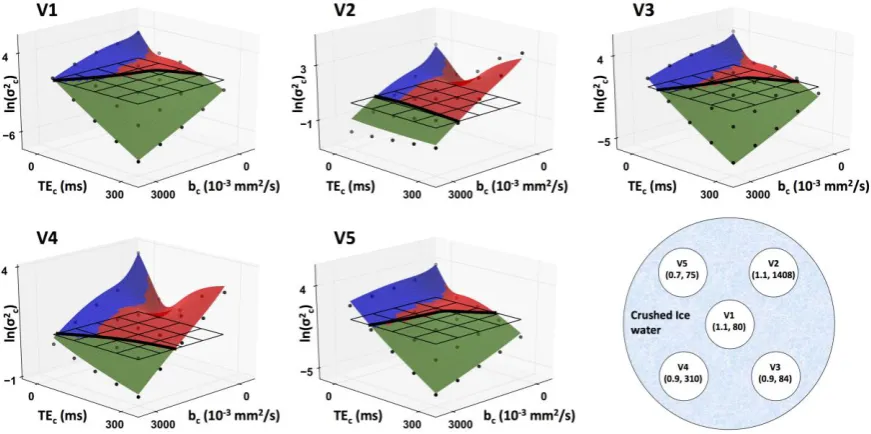
We validate equation (6) using a diffusion test-object consisting of 5 vials containing
sucrose,manganese chloride and water with differing ADC (0.7-1.1×10⁻³mm2/s) and T2
(75-1408ms) properties at 0°C (Figure 2).
Three axial images were acquired at the isocenter of a 1.5T system (MAGNETOM Avanto,
Siemens Healthcare, Erlangen, Germany) using a prototype monopolar, SE-EPI sequence
diffusion directions (three optimized, orthogonal diffusion directions (3-Scan-Trace)),
TE=34.0/136.0/58.8ms, NEX=2/6/2, readout bandwidth=1796Hz/px, repetition time
(TR)=8s, slice thickness=5mm, resolution=2.71×2.71mm2, field-of-view
(FOV)=26×19.5cm2, partial Fourier factor =6/8. No parallel imaging was used. T2-cDWI
images were calculated using these data for each pairwise combination of bc= 0, 750,
1500, 2250, 3000s/mm2 and TEc= 0, 75, 150, 225, 300ms, using in-house software [12].
The protocol was repeated such that T2-cDWI difference images could be generated for
each combination of bc and TEc. Regions-of-interest (ROIs), consisting of 75 pixels, were
drawn within the vials on the images acquired at b=0s/mm2 and TE=34ms, and then
translated onto the difference maps. The variance of the difference values within these
ROIs, divided by a factor of 2, provided an estimate for the true noise variance for T2
-cDWI. The estimated noise variance from equation 6 was computed and compared with
the ground-truth values: σ2 was estimated from values within the same ROIs placed on
the difference map for the two images acquired at b=0s/mm2 and TE=34ms.
Clinical Examples
To investigate the feasibility of T2-cDWI in clinical settings, we applied T2-cDWI
prospectively to two patients on a 1.5T system (MAGNETOM Avanto, Siemens
Healthcare, Erlangen, Germany). All the measurements were acquired with multiple
averaging during free breathing using body-array surface receiver coils. The following
cases were considered:
Patient 1: a 62-year-old male patient with malignant pleural mesothelioma (MPM).
82), (0, 60), (0, 82), and (0, 177). Other sequence parameters include: TR =8.1s,
FOV=273×380mm2, matrix = 128*92, 30 axial slices.
Patient 2: a 59-year-old female patient with ovarian cancer. Combinations of b value and
TE include (b = 100s/mm2, TE = 69.0ms), (600, 69.0), (1050, 69.0), (0, 26.4), (0, 102.0),
and (0, 200.0). Other sequence parameters include: TR=5s, FOV=261×380mm2, matrix =
160*110, 50 axial slices.
Computed images were generated for both clinical datasets using equation (3) at the
following combinations of bc and TEc by using the same software [12]:
Patient 1: (bc =1100s/mm2, TEc =82ms), (1100, 0), (0, 200).
Patient 2: (bc =1200s/mm2, TEc =82ms), (1200, 0), (0, 300).
Results
Validation of T2-cDWI model using a diffusion test-object
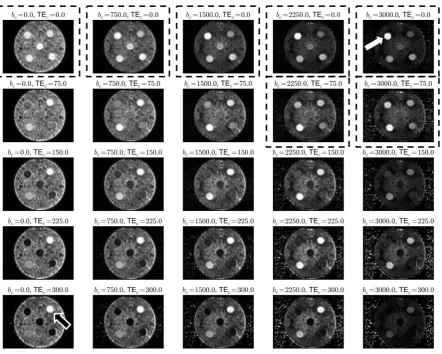
In Figure 3, it is observed that by synthesizing images at short echo times and high
b-values it is possible to suppress the signal from components with long T2 (vial 2,
top-right image), whilst increasing the signal from components with low ADC but shorter T2
(vial 5, top-right image, arrow). Direct acquisition of images with TE =0ms would not be
possible. Conversely, by extending the TEc to long values (e.g. 300ms) it is possible to
increase the signal of regions with long T2 (vials 2, bottom-left image) compared to other
regions without requiring a significant increase in image acquisition time. Figure 2
demonstrates that true image noise in T2-cDWI (black circles) is well approximated by
equation (6) (surface plot) over the range of T2, ADC, bc,and TEc values explored in this
direct calculation over the same image acquisition time (black wireframe) for many
larger b/TE values.
Clinical Examples
In Patient 1 (mesothelioma), we observed two compartments within the disease (Figure
4 e&f): (i) solid tumour characterised by low ADC and short T2 and (ii) pleural effusion
with high ADC but long T2. Both compartments were hyperintense on the acquired high
b-value (Figure 4a) due to the T2 shine-through effects caused by the long T2 of pleural
effusions. Although contrast improvements could be achieved by computing a higher
b-value through conventional cDWI (Figure 4b), the suppression of T2 shine-through was
inadequate to discriminate between compartments. However, after decreasing TEc to
zero through the use of T2-cDWI (Figure 4c), it was possible to reduce the hyperintense
signal of pleural effusions, and improve the contrast of the solid tumour. Conversely, by
using a high TEc and low bc (Figure 4d) it was possible to identify only those
compartments associated with long T2 and thus visualise the extent of pleural effusion.
Similar observations were made for Patient 2 (ovarian cancer). We identified a cystic
region with high ADC and long T2 that confounds the interpretation of the extent of solid
disease on the native high-b-value DW image (Figure 5a). This remains confounding
when a higher b-value was applied through the conventional cDWI (Figure 5b). By
setting TEc=0ms using T2-cDWI, it was possible to eliminate the T2 shine-through effects
and improve the contrast between solid tumour and cystic components. Conversely, by
setting bc=0s/mm2 and TEc=300ms, we were able to enhance the signal from fluid and
Discussion
We have developed a new acquisition and post-processing method that is able to reduce
the T2 shine-through effect that often confounds diffusion-weighted images, by allowing
arbitrary modulation of T2 and diffusion weighting. This is achieved by acquiring
additional T2-weighted EPI images at different echo times. Using the identical EPI
readout ensures that the geometry- and B0-related distortions are inherently matched.
Through voxel-wise estimation of ADC and T2 it is possible to synthesise image contrast
corresponding to any combination of b-value and TE. It is important to note that the
role of T2-cDWI is purely a visualisation mechanism for improving image contrast for the
identification of cellular tumours, and for separating confounding T2 effects. We do not
consider resulting images to be generally comparable with conventionally acquired
images using the same b-value and echo time. In this context of visualisation, the
diffusion model being used is not of primary concern provided that desirable tumour
characteristic can be achieved. In this study, a joint monoexponential diffusion model
was used without consideration of perfusion contribution, but the T2-cDWI methodology
easily lends itself to alternative diffusion models with appropriate data support.
We have derived analytical approximations to the noise characteristics of the T2-cDWI
model and validated the results through phantom experiments; in particular at high
b-value and long TE combinations, T2-cDWI images have reduced noise variance compared
with acquired images. Increased signal noise was observed at low b-value and short TE
combinations, due to the smaller number of signal averages at bc =0s/mm2, compared
Our clinical examples show T2-cDWI was able to independently vary the image contrast
by computation of images at desired b-values and echo times. With a large b-value and
small/zero echo time, which are not possible to be acquired on the scanner, T2-cDWI
provided higher contrast for identifying areas of true impeded diffusion (e.g. tumour),
due to efficient suppression of the T2 shine-through effect, compared with acquired
high-b-value images. Conversely, T2-cDWI images with a low b-value and a long echo time
enhance areas with long T2 (e.g. fluid, effusion, and cystic disease) by effectively
suppressing regions with shorter T2. The greater freedom to adjust image contrast by
manipulating b-values and echo times independently with T2-cDWI may prove to be a
useful clinical tool. There is a clear need for further investigation in future prospective
studies, but our early proof of concept data appears promising. Other clinical uses of T2
-cDWI include multi-centre trials where computed TEs and b-values could be made
equivalent for radiological reading thus minimising the impact of scanner variations in
acquisition protocols. In addition, T2-cDWI may facilitate automated segmentation based
on the enhanced contrast.
Other authors have investigated the use of exponential images to eradicate T2
shine-through effects by removing the S0 component for conventional cDWI [14-16]. However,
these images are associated with poor SNR and are not able to independently vary the
relative contributions of both tissue diffusivity and T2 relaxivity. Relaxation-corrected
DWI [17] and short-TE cDWI [18] were used to correct for T2 shine-through effect;
however T2-cDWI is able to provide synthetic images at any b-value and/or echo time. In
SNR and reduce T2 shine-through effects [19], but without taking into account variations
in tissue T2-relaxation times.
In this study, the acquisition times for clinical studies were increased to acquire the
additional T2-weighted scans; however, the additional time was modest (<2 minutes for
our example cases). In future studies, the dependence of image quality on the choice and
number of echo times will be explored.
In this study, we were able to demonstrate objective and quantitative improvements in
image noise and contrast when using the T2-cDWI method.
Acknowledgement
This work is supported by CRUK and EPSRC Cancer Imaging Centre in association with
the MRC and Department of Health grant C1060/A10334, C1060/A16464; NHS funding
to the NIHR Biomedical Research Centre and post-doctoral fellowship funding by the
NIHR (NHR011X); An Experimental Cancer Medicine Centre Network award
(C51/A7401 & C12540/A15573) and British lung foundation (APP13-4). This paper
presents independent research funded by the National Institute for Health Research
(NIHR). The views expressed are those of the authors and not necessarily those of the
NHS, the NIHR or the Department of Health.
References
1 Koh DM, Collins DJ (2007) Diffusion-weighted MRI in the body: applications and challenges in oncology. American Journal of Roentgenology 188:1622-1635
2 Koh DM, Takahara T, Imai Y, Collins DJ (2007) Practical aspects of assessing tumors using clinical diffusion-weighted imaging in the body. Magnetic Resonance in Medical Sciences 6:211-224
3 Malayeri AA, El Khouli RH, Zaheer A et al (2011) Principles and applications of diffusion-weighted imaging in cancer detection, staging, and treatment follow-up. Radiographics 31:1773-1791
4 Padhani AR, Liu G, Koh DM et al (2009) Diffusion-weighted magnetic resonance imaging as a cancer biomarker: consensus and recommendations. Neoplasia 11:102-125
6 Blackledge MD, Leach MO, Collins DJ, Koh D-M (2011) Computed diffusion-weighted MR imaging may improve tumor detection. Radiology 261:573-581
7 Cheng L, Blackledge MD, Collins DJ, Tunariu N, Leach MO, Koh DM (2015) The use of Quantitative T2 to enhance Computed Diffusion Weighted Imaging. Intl. Soc. Mag. Reson. Med 23, Toronto, Canada, pp 3599
8 Bito Y, Hirata S, Yamamoto E (1995) Optimal gradient factors for ADC measurementsProc Intl Soc Magn Reson Med, pp 913
9 Jones D, Horsfield M, Simmons A (1999) Optimal strategies for measuring diffusion in anisotropic systems by magnetic resonance imaging. Magn Reson Med 42
10 Saritas EU, Lee JH, Nishimura DG (2011) SNR dependence of optimal parameters for apparent diffusion coefficient measurements. Medical Imaging, IEEE Transactions on 30:424-437
11 Kingsley PB (2006) Introduction to diffusion tensor imaging mathematics: Part II. Anisotropy, diffusion‐weighting factors, and gradient encoding schemes. Concepts in Magnetic Resonance Part A 28:123-154
12 Blackledge MD, Collins DJ, Koh D-M, Leach MO (2016) Rapid development of image analysis research tools: Bridging the gap between researcher and clinician with pyOsiriX. Computers in Biology and Medicine 69:203-212
13 Jones DK, Basser PJ (2004) “Squashing peanuts and smashing pumpkins”: How noise distorts diffusion‐weighted MR data. Magnetic Resonance in Medicine 52:979-993
14 Provenzale JM, Engelter ST, Petrella JR, Smith JS, MacFall JR (1999) Use of MR exponential diffusion-weighted images to eradicate T2 "shine-through" effect. American Journal of Roentgenology 172:537-539
15 Park SY, Kim CK, Park JJ, Park BK (2016) Exponential apparent diffusion coefficient in evaluating prostate cancer at 3 T: preliminary experience. The British journal of radiology 89:20150470
16 Tanimoto A, Nakashima J, Kohno H, Shinmoto H, Kuribayashi S (2007) Prostate cancer screening: The clinical value of diffusion-weighted imaging and dynamic MR imaging in combination with T2-weighted imaging. Journal of Magnetic Resonance Imaging 25:146-152
17 Chong DGQ (2013) Relaxation Corrected Diffusion Weighted Imaging. Intl. Soc. Mag. Reson. Med. 21, pp 3209
18 Kimura T, Sakashita N, Machii Y (2015) A short-TE Computed Diffusion Imaging (CDWI)Intl. Soc. Mag. Reson. Med 23, pp 2929
Legends:
Figure 1: Comparison of the logarithm of noise variance from an optimally acquired T2
-cDWI sequence, σ2(bc, TEc) (surface-plot) with logarithm of noise-variance from a
conventionally acquired sequence, σ2 = 1 (black wireframe). Where σc2 < σ2, the surfaces
are coloured in green. Areas in which the surfaces are coloured in blue represent those
combinations of b and TE that could not be acquired directly using the given gradient
performance of our scanner, otherwise they are coloured red. Units of ADC are given in
× 10-3 mm2/s, whilst for T2 they are in ms. It is apparent there is often little advantage in
-c
c
cDWI either affords improved SNR (green areas) or allows generation of images that
would not be possible to acquire directly (blue areas).
Figure 2: An illustration of the diffusion test-object is depicted in the bottom right. Each
vial identifier is shown with its measured (ADC × 10−3 mm2/s, T2 ms) values. Black
circles in the surface plots represent measured noise variance, σ2, for each of the vials in
computed images with a range of b-values and echo times. The analytical estimation of
the noise variance from the vial ADC and T2 values is depicted as a surface plot (Green
areas: σc2 < σ2, red areas: σc2 > σ2, blue areas: combinations of b and TE that could not be
acquired directly using the given gradient performance of our scanner). There is a clear
correspondence between the estimated and measured values for σc2. Black wireframes
indicate the expected noise variance for an acquisition scheme of equivalent acquisition
time to T2-cDWI, but with multiple image averages at each respective bc/TEc: The solid
wireframes. It is observed that T2-cDWI provides SNR advantages over conventional
acquisitions for certain combinations of bc/TEc in this phantom.
Figure 3: T2-cDWI images of the diffusion test-object at varying computed b-values, bc
and echo times, TEc. It is shown that by extrapolating the echo time to TEc = 0.0 ms and
the b-value to bc = 3000 s/mm2 it is possible to enhance the signal in the vial with low
ADC and long T2 (V5, white arrow). Conversely, by synthesising images with long TEc we
acquire images where the contrast favours components with a long T2 (V2, black arrow).
Those combinations of bc and TEc surrounded by black dashed boxes cannot be acquired
directly using conventional diffusion-weighted EPI sequences. The windowing on all
Figure 4: Axial DW MR images of a 62-year-old man with mesothelioma in the right lung
for (a) acquired b-values of 800 s/mm2 at TE of 82 ms, (b) computed b-value of 1100
s/mm2 at TE of 82 ms, (c) T2-adjusted computed b-value of 1100 s/mm2, TE of 0 ms, and
(d) T2-adjusted computed b-value of 0 s/mm2 TE of 200 ms. (e) R2 map and (f) ADC map
generated from all acquired images. The solid tumour (arrow) and pleural effusion
(arrowhead) both show hyperintense signal on the acquired high-b-value DW image due
to T2 shine-through. Pleural effusions are still misinterpreted with solid disease even
using a higher b-value in cDWI. By bringing the TE down to zero ms on T2-cDWI, pleural
contrast, using a very high TE and small b-value, the solid tumour and background tissue
are suppressed. (For viewing of the colour R2 and ADC maps, the reader is referred to
the online version of this article).
Figure 5: Axial DW MR images of a 59-year-old woman with ovarian cancer (a) acquired
using b-values of 1050 s/mm2 at TE of 69 ms, and (b) computed DWI (b-value of 1200
s/mm2, TE of 69 ms), and (c) T2-adjusted computed DWI (b-value of 1200 s/mm2, TE of
tumour, arrowhead: cystic disease. (For viewing of the colour R2 and ADC maps, the