Katarzyna MISZCZYŃSKA, PhD
Email:[email protected] Faculty of Economics and Sociology
University of Lodz
Piotr MISZCZYŃSKI, PhD
Email:[email protected] Faculty of Economics and Sociology University of Lodz
DOES THE OWNERSHIP AFFECT THE FINANCIAL PERFORMANCE OF THE HOSPITAL? THE EXAMPLE OF POLAND
Abstract: Hospital indebtedness is a complex and very diverse phenomenon. Thus, the goal
of this study is the comparison of the financial performance of public hospitals in accordance with their ownership and size. The results of the research lead to the conclusion that the vast majority of public hospitals are indebted, and their ownership structure does not affect their financial condition. What is more, the statistical analysis depicted that large Marshall hospitals are less indebted than poviat-commune ones. In the group of medium-size hospitals, the situation was the opposite. Moreover, the study did not confirm the significant relationship between the size or ownership and the financial status of the hospital. The analysis conducted in the article is aimed at filling in the gap in studies comparing the indebtedness between different types of public hospitals.
Keywords: healthcare sector, financial performance, public hospitals.
1. Introduction
It is commonly assumed that the performance of the healthcare sector in Poland is far from satisfactory [1,2,6]. The situation of Polish university hospitals is very diverse; 40% of entities have current financial liquidity at risk, and more than 70% are struggling with a high level of debt [3,4]. For many hospitals, increasing financial pressures may result in lower margins that conflict with efforts to promote higher quality care [5]. Hospitals vary in terms of different characteristics: status (public, private), ownership/founding body (university hospitals, ministry hospitals, local government hospitals, etc.), the financial objectives (for-profit, not-for-profit), the size or the specialization (e.g., general, psychiatric). Those characteristics can significantly affect their performance and financial situation [6]. Generally, hospitals should finance their growth with debt or revenue from provided services [7]. However, the funding sources for hospitals vary depending on their founding body, business profile, whether they are public or private.
Nevertheless, there are two primary sources of financing: external or internal, from the founding bodies. The external sources of funding are usually connected with debt [7,8]. Bem, Ucieklak-Jeż, Prędkiewicz, and Prędkiewicz have shown that there is a positive relationship between the debt ratio and liquidity as well as the profitability and liquidity ratio [6]. Krzeczewski studied the impact of location on the financial condition of a local government hospital on the example of the Łódź Voivodeship [9]. He also confirmed that the founding
body significantly affects the economic efficiency of the hospitals in the Lodz region [10]. The relationship between the income generated by the hospital bed and hospital liquidity analysed by Bem, Ucieklak-Jeż, and Prędkiewicz showed a statistically significant relationship between the annual income per bed and the level of liquidity [11]. Miszczyńska confirmed based on public hospitals in Łódź the influence of the founding body on the debt [12]. In a study by Creixans-Tenas and Arimany-Serrat, the financial condition of hospital companies was characterized by acceptable liquidity and debt, which significantly affected its profitability [13]. Upadhyay and Smith examined the positive relationship between traditional liquidity ratios and the cash conversion cycle. However, this relationship was not statistically significant for the quick ratio and cash conversion ratio [14]. Lee made a financial analysis of hospitals in Korea in 2008-2011. The author focused on university hospitals, i.e., those whose founding units were medical universities. The results showed that national university hospitals were low in debt, and their management conditions seemed generally satisfactory. However, some hospitals faced severe financial difficulties, and their short-term debts had a negative impact on the profit and loss structure. A detailed indicator analysis showed that the financial situation and performance of national university hospitals had deteriorated [15]. Bem, Prędkiewicz, Ucieklak-Jeż, and Siedlecki [7] claimed that the size of a hospital affected, either positively or negatively, the decisions regarding a new debt. According to the research results, large hospitals have better access to the financial market, and higher profitability ratios increase their chance to obtain credit.
On the other hand, public grants also affect the decisions concerning the level of debt. As the research of Michalski and Gentry showed, the financial position of public hospitals is too weak to be attractive to potential creditors, so they are supported by public donors [8,16]. However, this statement was not widely confirmed in the literature on the subject [17]. Kim underlined that financial distress could have a detrimental influence on the performance of hospitals. What is more, hospital management needs to monitor potential financial distress effectively and know how it will respond depending on the severity of the circumstances [18]. The complexity of the medical and financial processes taking place in hospitals, along with the general constraints in the health sector (including a relatively low level of funding) raises the need for debt analysis to be the subject for more frequent research [6].
It is worth underlining that there are no studies comparing the indebtedness between different types of hospitals, according to their ownership and size. The vast majority of studies are usually based on the relationship between hospital liquidity, efficiency, debt, and their size [19-23]. Thus, there is a literature gap as far as comparisons between different types of hospital ownership (founding body) and debt are concerned. Hence, this study is also aimed at fulfilling this gap.
The main goal of this article is to compare the financial performance of two types of hospitals: those founded by the Marshall Office and the City Council. The research is based on the debt ratio and the solvency ratio. The study is based on the background of the theory concerning the size of the hospital, according to which the size of the hospital can be measured by the number of hospital beds [6,7,19,21,22,24,25]. However, there have also been some research introducing operating revenue and the value of total assets as a hospital size measure [26].
H1 Marshall hospitals are less indebted than poviat-commune ones according to their size groups
H 1.1 Marshall hospitals are less indebted then a poviat-commune hospitals amongst
medium-sized entities.
H 1.2 Marshall hospitals are less indebted then a poviat-commune hospitals amongst large
entities.
H2 Large hospitals are more indebted than medium-sized ones according to their ownership structure.
H 2.1 Large hospitals are more indebted than their medium-sized ones amongst Marshall
hospitals.
H 2.2 Large hospitals are more indebted than their medium-sized ones amongst
poviat-commune hospitals.
Due to the fact that there are no studies of this kind, the considerations are presented mainly concerning hospitals’ financial analysis with the main impact on their indebtedness. The changes that occur in hospitals’ performance due to their founding body are pointed out. The founding body has some possibilities to influence the hospital’s financial management and, thus, its finances.
The structure of the paper is as follows: Section 1 presents the introduction and literature review, Section 2 presents the data and method. In Section 3, the results of U-Mann Whitney tests on the relations between the indebtedness and the size/founding body are presented. The section also presents the results interpretations. Section 4 presents research discussion. The last section presents the conclusions.
2. Materials and Methods
The study is focused on hospitals that are public units; hence their primary source of financing is the National Health Fund, being the main payer of the healthcare system in Poland. The study was conducted between 2007 and 2017. The data are obtained from the EMIS (Emerging Markets Information System) and Amadeus database supplied by InfoCredit.
The hospitals in the study are divided into two groups: those founded by the City Council and the Marshall’s Office. What is more, another subdivision is created in accordance with the size of the analysed hospitals, distinguishing large and medium-sized hospitals’ groups, which is confirmed in the literature [2,4,26]. Such divisions are aimed at identifying the founding body influence on financial performance hospitals due to their ownership and size.
As a part of the study, data are collected on 321 public hospitals in Poland (on 40% of all 814 public hospitals in Poland), in terms of their founding body. The sample is drawn in the way to keep the representativeness of the study (see Table 5 in Attachment). Indebtedness is measured by the application of two ratios – debt ratio (DT) and solvency (SLV) – analysed in the 2007 – 2017 period.
Table 1. List of variables used in the financial and economic analysis of healthcare.
Variable Author, Year
Indebtedness (Debt ratio,
debt-to-equity ratio, solvency ratio)
[2,3,6,7,10,20,23,26-30]
Ownership (founding body) and
status (public/private unit)
[2,10,19,22,23,31-34]
Size of the hospital (Hospital beds) [2,6,8,19,22,24,25,30,32,35]
Underneath there is presented how size-group evaluation is prepared [6,24]:
• Medium-sized hospitals – number of hospital beds: 0-400;
• Large hospitals – number of beds: over 401.
Using methods of division described above, the following hospitals are selected to the study:
• 134 hospitals founded by the Marshal Office, marshal hospitals, including: a. 47 large hospitals,
b. 87 medium-sized hospitals,
• 123 hospitals founded by the City Council, poviat-commune hospitals, including: a. 34 large hospitals,
b. 89 medium-sized hospitals.
In the first step of the analysis, descriptive statistics of the analysed variables are examined. Then the verification of the hypothesis of whether the indebtedness of Marshall hospitals differs significantly from the indebtedness of the poviat-commune hospitals is conducted. This proceeding is carried out in accordance with the size group – separately for medium-sized and large hospitals. In the second part of the study, the analogous procedure is carried out under the ownership group.
To test whether the variables are featured by the normal distribution in the analysed period, a Lilleforse test based on Kolmogorov-Smirnov and Shapiro-Wilk and 2 tests are applied. The
test results reveal that the SLV ratio is not normally distributed. However, DT had to be excluded from further research, while it is normally distributed in terms of medium-sized Marshall hospitals and large poviat-commune hospitals. Therefore, as a consequence, the non-parametric Mann–Whitney U test is used in the further analysis only in terms of SLV ratio. In order to conduct the U Mann-Whitney test verification, the dummy variables grouping hospitals into two categories (Marshall and poviat-commune) are created. Table 2 presents the obtained groups, which could be portrayed as the big ones in terms of medium-sized hospitals and small (n<50) in terms of large hospitals.
Table 2. Group division
Ownership/Hospital Type Marshall Hospitals Poviat-Commune Hospitals
Medium-sized 87 89
According to the grouping, it is decided to conduct a Z test establishing appropriate statistical significance levels. The following hypotheses are put underneath:
H0: There are no differences in indebtedness amongst the analysed groups.
H1: There occur differences in indebtedness amongst the analysed groups.
3. Results
The study is aimed at assessing the indebtedness between Marshall and poviat-commune hospitals, and it also allows to draw conclusions whether the sources and scope of hospital financing depend on the size or the founding body. The details concerning the descriptive statistics are presented in the Attachment (see Table 6).
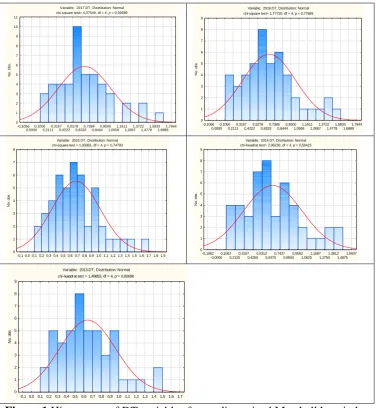
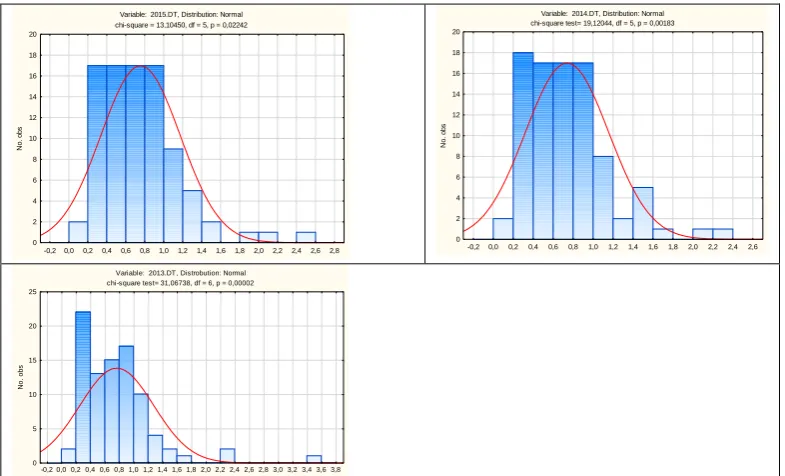
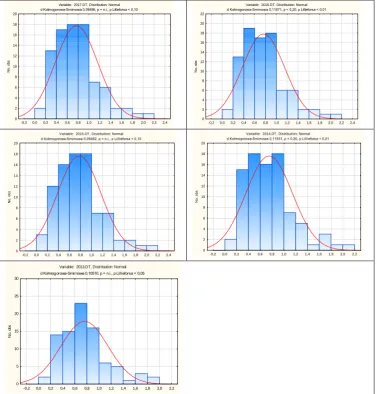
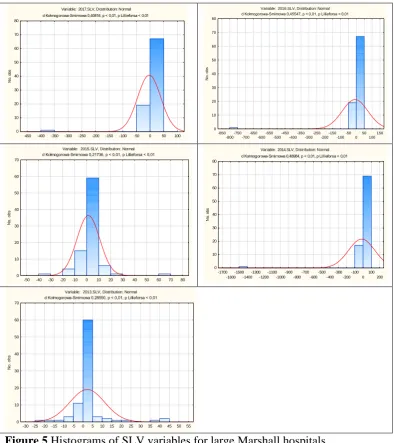
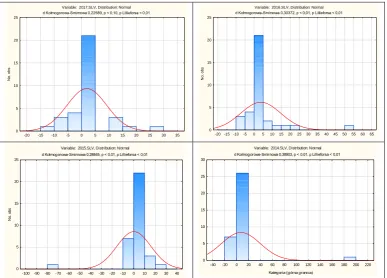
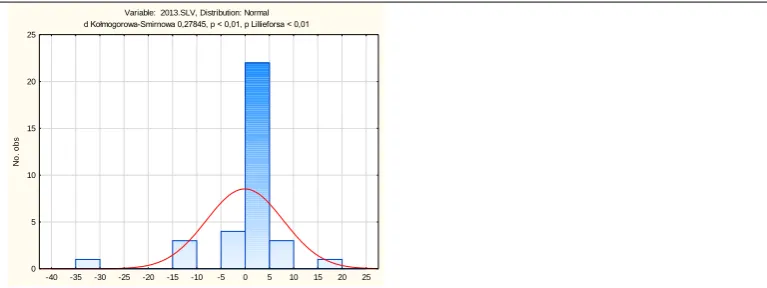
The normality of analysed variables is checked with the Lilleforse test (based on Kolmogorov-Smirnov and Shapiro-Wilk test) and 2 tests, respectively, depending on the number of sub-samples. As a result, most observations are not featured by the normal distribution. Exceptions are: DT ratio in all analysed years in terms of medium-sized Marshall hospitals and large poviat-commune hospitals. That is why, as it was pointed out in the methodology section, those observations are excluded from the further analysis, and to verify the hypotheses, we compare only SLV in all analysed years. Figures 1-8 in attachments present the histograms of each variable distribution (DT and SLV).
In further analysis, there is carried out a verification of the two stated research hypotheses. The verification is carried out at first in accordance with the hospital’s size (hypothesis 1) and secondly according to their ownership/founding body (hypothesis 2).
Large and Medium-sized hospitals
The verification is carried out through the Mann–Whitney U test. The verification of the research hypothesis H1 is formulated as follows:
H0: There are no differences in indebtedness amongst analyzed groups.
H1: There occur differences in indebtedness amongst analyzed groups.
The sample of medium-sized hospitals is divided into two subsamples of Marshall and poviat-commune hospitals (featured respectively by 1 and 0) to verify, the stated in the methodology section, hypotheses.
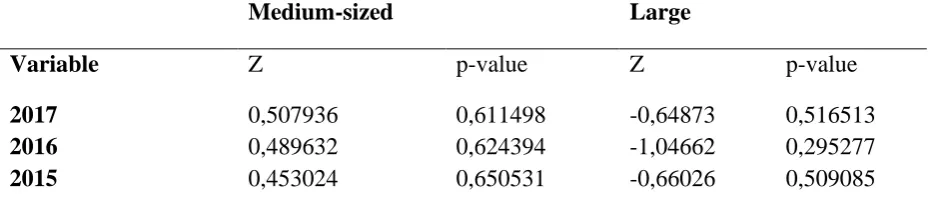
Table 3 presents some results of the Mann–Whitney U test. For the years 2013 – 2017 H0,
there is no reason to reject the null hypothesis (at 0.05 significance level) as far as indebtedness is concerned. It means that indebtedness does not differ significantly between the groups in question. So, it can be said that the hospital's ownership (understood as Marshall of the poviat-commune hospital) does not have any impact on their indebtedness.
Table 3. Results of the Mann-Whitney U test for SLV in medium-sized hospitals.
Medium-sized Large
Variable Z p-value Z p-value
2017 0,507936 0,611498 -0,64873 0,516513
2016 0,489632 0,624394 -1,04662 0,295277
2014 0,288288 0,773126 -0,89669 0,369885
2013 1,290433 0,196901 0,10668 0,915043
Source: own calculations based on data provided by Amadeus and EMIS databases.
The procedure conducted in terms of large companies was analogous to the procedure for medium-sized hospitals. The verification is carried out by means of the Mann–Whitney U test and sample of large hospitals was divided into two subsamples of Marshall hospitals and poviat-commune.
Marshall and poviat commune hospitals
While analysing the group of Marshall hospitals, including medium-sized and large hospitals, it can be observed that no significant differences occur in the analysed years. The detailed results are presented in Table 6.
As far as the poviat-commune hospitals are concerned, in the whole analyzed period at the 0.05 significance level, there is no reason to reject the null hypothesis as far as indebtedness is concerned (see Table 4). It means that the indebtedness does not differ significantly in the analyzed groups of hospitals.
Table 4. Results of the Mann-Whitney U test for SLV for Marshall hospitals.
Marshall hospitals Poviat-commune hospitals
Variable Z p-value Z p-value
2017 -0,247110 0,804823 0,760620 0,446885
2016 -0,223798 0,822915 1,269585 0,204234
2015 -0,293735 0,768961 0,788896 0,430174
2014 0,083924 0,933117 1,167792 0,242892
2013 -0,153861 0,877719 0,641861 0,520964
Source: own calculations based on data provided by Amadeus and EMIS database.
4. Discussion
As it was shown in the previous section, comparing the average values of DT and SLV variables according to the ownership structure, in the group of medium-sized hospitals, it turned out that poviat-commune hospitals had better values (closer to the recommended values) than the poviat-commune ones, and hence were less indebted. In the case of large hospitals, the situation was reversed. The formation of solvency and debt ratios indicate problems in the operation of public hospitals in Poland. These results are consistent with the already published study analyses [2,7]. Optimum values of the solvency ratio suggested by the Polish Ministry of Health should range between 0.01 and 0.5.
Nevertheless, a substantial minority of hospitals did not achieve the above optimum values, instead of reporting negative ones. Negative solvency ratio values were associated with negative equity capital values affected by the balance sheet item: loss brought forward or the lack of efficient external financing use. Debt ratios of the analysed hospitals significantly exceeded the 0.3 level recommended by the Ministry of Health. It should be underlined that the vast majority of hospitals showed values above 1.00, which indicated undermining hospitals’ credibility. The number of hospitals meeting the recommended indebtedness level fell over the years 2007-2017.
Comparing the analysed sample of companies, the study shows that the founding body does not have any influence on the financial situation of the hospital. These results are opposite to those of Krzeczewski. However, our study was based on a bigger representative sample [10]. The study reveals that the indebtedness of the hospital depends on other economic and financial factors. These conclusions are irrelevant to the size of the hospital. For both medium and large hospitals, the influence of the founding body on indebtedness is not statistically significant. This means that the additional financing options and support for hospital activities that are specific to each founding body are not as crucial for creating debt than, for example, the specificity of the unit [2] or its location in the urban or rural area [26].
Limitations of the study
Among the main limitations of the study is the criterion for the division of the size of hospitals is used. Hence, in the future research, it will be checked wheather the change of the hospitals size division will change the obtained results. What is more, the validity of the research could be improved with a full sample of poviat-commune and marshall hospitals. Moreover, it would worth trying to broaden the scope of the study on University and Ministry hospitals. This would give an overview of all types of hospitals and their impact on the dependence on the founding unit.
5. Conclusions
The analysis carried out in the article leads to the conclusion that the financial situation of Polish public hospitals is diverse. It was also confirmed in the literature studies [3,4]. As the statistical analysis showed, the vast majority of public hospitals are indebted. Moreover, the study did not confirm the significant relationship between the size and the financial situation of the hospital.
Moreover, it turns out that the founding body does not have any impact on the units' indebtedness, measured by both the debt and solvency ratios. However, as recent policy actions show, there have been calls to increase the role of voivodeships in coordinating health care activities of the lower levels of territorial self-government, due to difficulties in the local-government coordination [45]. The results are partly consistent with the literature studies regarding the financial performance of public hospitals. Even though the assumed hypotheses have not been verified positively, one should not underestimate the problematic situation of the healthcare sector in Poland. It should be underlined that the support of the financial sustainability of the hospital sector has become essential and will be more and more important. Nowadays, hospitals faced a challenging situation related to coronavirus pandemic. As Dubas-Jakóbczyk depicted, in 2020, hospitals stand at the frontline of the fight with the coronavirus pandemic, facing huge pressures [30]. Therefore, the need to analyze the financial situation and determine its determinants seems extremely necessary.
The added value of our research is the analysis of the situation of public hospitals in Poland in terms of their financial performance, in accordance with the size and ownership groups. As far as it was checked, this type of study has not yet appeared in the scientific literature. The study complements the gap in comparative studies of the financial performance of public hospitals. Taking this into consideration, the authors believe that the presented findings of the study may contribute to the literature on the financial performance of public hospitals in Poland.
Author Contributions: Conceptualization, K.M. and P.M.; methodology, K.M. and P.M.;
software, K.M.; validation, K.M.; formal analysis, K.M. and P.M.; investigation, K.M. and P.M.; resources, K.M.; data curation, P.M.; writing—original draft K.M.; writing—review and editing, K.M. and P.M.; supervision, K.M.; project administration, K.M.
All authors have read and agreed to the published version of the manuscript.
Funding: This research received no external funding.
Conflicts of Interest
The authors declare no conflict of interest.
References
1. Nieszporska S. Priorities in the Polish health care system. Eur J Health Econ. 2017;18(1), 1-5.
3. Dubas-Jakóbczyk, K. Ocena Sytuacji Finansowej Szpitali Uniwersyteckich Na Podstawie Sprawozdań Finansowych Za Rok 2014. Zesz. Nauk. Politech. Śląskiej2017, 100, 99–108.
4. Dubas-Jakóbczyk, K.; Kowalska-Bobko, I.; Sowada, C. The 2017 Reform of the Hospital Sector in Poland – The Challenge of Consistent Design. Health Policy (New. York).
2019, 123 (6), 538–543. https://doi.org/10.1016/j.healthpol.2019.03.013.
5. Ly, D.; Jha, A.; Epstein, A. The Association Between Hospital Margins, Quality of Care, and Closure or Other Change in Operating Status. J Gen Intern Med. 2011, 26 (11), 1291–1296.
6. Bem, A.; Prędkiewicz, K.; Prędkiewicz, P.; Ucieklak-Jeż, P. Determinants of Hospital’s Financial Liquidity. Procedia Econ. Financ. 2014, 12 (March), 27–36. https://doi.org/10.1016/s2212-5671(14)00317-7.
7. Bem, A.; Predkiewicz, P.; Ucieklak-Jez, P.; Siedlecki, R. Profitability versus Debt in Hospital Industry. In European Financial Systems 2015, Masaryk University, 2015, 20-27. 8. Gentry, W. Debt, Investment and Endowment Accumulation: The Case of Not-for-Profit Hospitals. J. Health Econ. 2002, 21 (5), 845–872. https://doi.org/10.1016/S0167-6296(02)00056-5.
9. Krzeczewski, B. Wpływ Lokalizacji Na Kondycję Finansową Szpitala Samorządowego - Na Przykładzie Województwa Łódzkiego. Przedsiębiorczość i Zarządzanie
2014, 15 (10), 229–242.
10. Krzeczewski, B. Wpływ Organu Założycielskiego Na Efektywność Finansową Szpitali w Województwie Łódzkim. Zesz. Nauk. Uniw. Szczecińskiego - Finans. Rynk.
Finans. Ubezpieczenia2014, 65, 569–581.
11. Bem, A.; Ucieklak-Jeż, P. Prędkiewicz, P. Income per Bed as a Determinant of Hospital’s Financial Liquidity. Probl. Manag. 21stcentury2014, 9 (2), 124–131.
12. Miszczyńska, K. Efektywność Funkcjonowania Szpitali Publicznych w Łodzi; Uniwersytet Łódzki: Łódź, 2019.
13. Creixans-Tenas, J., Arimany-Serrat, N. Influential Variables on the Profitability of Hospital Companies. Intang. Cap.2018, 14 (1), 171–185.
14. Upadhyay, S.; Smith, G. Hospital Liquidity and Cash Conversion Cycle: A Study of Washington Hospitals. J. Health Care Finance2016, 147–157.
15. Lee, M. Financial Analysis of National University Hospitals in Korea. Osong Public
Heal. Res Perspect 2015, 6 (5), 310–317.
16. Michalski, G. Inventory Management Optimization as Part of Operational Risk Management. Econ. Comput. Econ. Cybern. Stud. Res.2009, 43 (4), 213–222.
17. McCue, M.; Nayar, P. A Financial Ratio Analysis of For-Profit and Non-Profit Rural Referral Centers. J. Rural Heal.2009, 3, 314–319.
18. Kim, T. Factors Associated With Financial Distress of Nonprofit Hospitals. Heal.
Care Manag. 2010, 29 (1), 52–62.
19. Bai, G.; Anderson, G. F. A More Detailed Understanding of Factors Associated with
Hospital Profitability. Health Aff. 2016, 35 (5), 889–897.
https://doi.org/10.1377/hlthaff.2015.1193.
21. Maślach, D.; Markiewicz, J.; Warelis, A.; Krzyżak, M. Importance of Financial Liquidity in Hospital Management. Epidemiol. Rev. 2019, 73 (3), 369–381.
22. Kim, Y.; Glover, S.; Stoskopf, C.; Boyd, S. The Relationship between Bed Size and Profitability in South Carolina Hospitals. J. Health Care Finance2002, 29, 53–63.
23. Nevola, A.; Pace, C.; Karim, S. A.; Morris, M. E. Revisiting ‘the Determinants of Hospital Profitability’ in Florida. J. Health Care Finance2016, 43 (2), 38–60.
24. Prędkiewicz, K.; Prędkiewicz, P. Financial Liquidity of Public Hospitals in Poland - Empirical Results. Zesz. Nauk. Uniw. Szczecińskiego 2013, 766 (62), 169–179.
25. Vogel, W.; Langland-Orban, B. Gapenski, L. Factors Influencing High and Low Profitability among Hospitals. Heal. Care Manag. Rev1993, 18, 15–26.
26. Siedlecki, R.; Bem, A.; Ucieklak-Jeż, P.; Prędkiewicz, P. Rural Versus Urban Hospitals in Poland. Hospital’s Financial Health Assessment. Procedia - Soc. Behav. Sci. 2016, 220 (March), 444–451. https://doi.org/10.1016/j.sbspro.2016.05.519.
27. Łagowski, P. Analiza Finansowa Kluczowych Podmiotów Leczniczych w Województwie Dolnośląskim. Finans. i Rachun. - Sytuacja przedsiębiorcy w warunkach
pokryzysowych2016, 2, 135–150.
28. Ngorsuraches, S.; Sornlertlumvanich, A. Determinants of Hospital Loss in Thailand: Experience from the First Year of a Universal Coverage Health Insurance Program. Health
Care Manag. Sci. 2006, 9 (1), 59–70. https://doi.org/10.1007/s10729-006-6280-z.
29. Price, C.; Cameron, A.; Price, D. Distress Detectors: Measures for Predicting Financial Trouble in Hospitals. Heal. Financ Manag.2005, 8, 74–80.
30. Dubas-Jakóbczyk, K.; Kozieł, A. Towards Financial Sustainability of the Hospital Sector in Poland — A Post Hoc Evaluation of Policy Approaches. Sustainability 2020, 12 (4801).
31. Langland-Orban, B.; Large, J.; Sear, A.; Zhang, H.; Zhang, N. Operating Profitability of For-Profit and Not-for-Profit Florida Community Hospitals during Medicare Policy
Changes, 2000 to 2010. Inq. (United States) 2015, 52.
https://doi.org/10.1177/0046958015600753.
32. Renn, S. C.; Schramm, C. J.; Watt, J. M.; Derzon, R. A. The Effects of Ownership and System Affiliation on the Economic Performance of Hospitals. Inq. (United States) 1985, 22, 219–236.
33. McCue, M.; Clement, J.; Hoerger, T. The Association of Ownership and System Affiliation with the Financial Performance of Inpatient Psychiatric Hospitals. Inq. (United States) 1993, 30 (3), 306–317.
34. Younis, M.; Younies, H.; Okojie, F. Hospital Financial Performance in the United States of America: A Follow-up Study. East Mediterr Heal. J.2006, 12 (5), 670–678.
35. Harrison, J.; Sexton, C. The Paradox of the Not-for-Profit Hospital. Health Care
Manag. (Frederick).2004, 3, 192–204.
36. Woolhandler, S.; Himmelstein, D. Competition in a Publicly Funded Healthcare System. BMJ2007, 335 (7630), 1126–1129.
38. Veitch, K. Obligation and the Changing Nature of Publicly Funded Healthcare. Med.
Law Rev.2018, 27 (2), 267–294.
39. Cieśla, K. Financial and Economic Governance as a Basis for the Effectiveness of
Healthcare Facilities. In Rationalization of costs in health care.; Wolters Kluwer: Warsaw,
2012.
40. Łyszczarz, B.; Nojszewska, E. Productivity Losses and Public Finance Burden Attributable to Breast Cancer in Poland. BMC Cancer2017.
41. Miszczynska, K. The Application of Balanced Scorecard Method for the Selection of
Factors Used in the Efficiency Measurement of Public Hospitals in Poland. In 5th SGEM
International Multidisciplinary Scientific Conferences on SOCIAL SCIENCES and ARTS SGEM2018; 2018. https://doi.org/10.5593/sgemsocial2018/1.5/S05.128.
42. Berger, M.; Sommersguter-Reichmann, M.; Czypionka, T. Determinants of Soft Budget Constraints: How Public Debt Affects Hospital Performance in Austria. Soc. Sci.
Medicien2020, 249 (112855).
43. Herbert, K. Hospital Reimbursement: Concepts and Principles; CRC Press, 2012. 44. Penner, S. Economics and Financial Management for Nurses and Nurse Leaders, Third Edition; Springer Publishing Company, 2016.
45. Deloitte. Polish Healthcare Sector: Aligning Dutch Smart Solutions to Polish
Opportunitiees; 2017.
Attachments
Table 5 Representativeness testing
To compare the two distributions, the χ2 test of homogeneity was carried out. The χ2 test
was introduced according to the following notation: =
where Oj - observed value of two nominal variables (in %);
Ej - expected value of two nominal variables (in %).
The tested hypothesis:
H0: Distribution of hospitals according to the founding body in the sample is consistent
with the distribution for the entire population (H0~ H1).
Verification of χ2 test of homogeneity.
Values [in %] FB_U FB_M FB_MIN FB_PC Sum
Observed [Oj] 10.0 41.7 10.0 38.3 100
Expected [Ej] 7.0 36.0 8.0 49.0 100
χ2=7.815
Based on the test, there were no grounds for rejecting the null hypothesis. Thus, with 95% probability, it was found that the distribution of hospitals according to their founding body in the sample was consistent with the distribution of the entire population. According to the test, the results of the analysis carried out in this study can be generalized to the entire population.
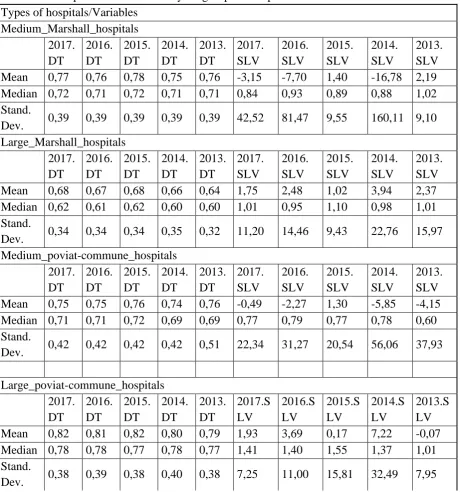
Table 6 Descriptive statistics of analysed groups of hospitals
Types of hospitals/Variables Medium_Marshall_hospitals 2017. DT 2016. DT 2015. DT 2014. DT 2013. DT 2017. SLV 2016. SLV 2015. SLV 2014. SLV 2013. SLV
Mean 0,77 0,76 0,78 0,75 0,76 -3,15 -7,70 1,40 -16,78 2,19
Median 0,72 0,71 0,72 0,71 0,71 0,84 0,93 0,89 0,88 1,02
Stand.
Dev. 0,39 0,39 0,39 0,39 0,39 42,52 81,47 9,55 160,11 9,10
Large_Marshall_hospitals 2017. DT 2016. DT 2015. DT 2014. DT 2013. DT 2017. SLV 2016. SLV 2015. SLV 2014. SLV 2013. SLV
Mean 0,68 0,67 0,68 0,66 0,64 1,75 2,48 1,02 3,94 2,37
Median 0,62 0,61 0,62 0,60 0,60 1,01 0,95 1,10 0,98 1,01
Stand.
Dev. 0,34 0,34 0,34 0,35 0,32 11,20 14,46 9,43 22,76 15,97
Medium_poviat-commune_hospitals 2017. DT 2016. DT 2015. DT 2014. DT 2013. DT 2017. SLV 2016. SLV 2015. SLV 2014. SLV 2013. SLV
Mean 0,75 0,75 0,76 0,74 0,76 -0,49 -2,27 1,30 -5,85 -4,15
Median 0,71 0,71 0,72 0,69 0,69 0,77 0,79 0,77 0,78 0,60
Stand.
Dev. 0,42 0,42 0,42 0,42 0,51 22,34 31,27 20,54 56,06 37,93
Large_poviat-commune_hospitals 2017. DT 2016. DT 2015. DT 2014. DT 2013. DT 2017.S LV 2016.S LV 2015.S LV 2014.S LV 2013.S LV
Mean 0,82 0,81 0,82 0,80 0,79 1,93 3,69 0,17 7,22 -0,07
Median 0,78 0,78 0,77 0,78 0,77 1,41 1,40 1,55 1,37 1,01
Stand.
Dev. 0,38 0,39 0,38 0,40 0,38 7,25 11,00 15,81 32,49 7,95
Variable: 2017.DT , Distribution: Normal chi-square test= 4,07549, df = 4, p = 0,39589
-0,1056
0,00000,10560,21110,31670,42220,52780,63330,73890,84440,95001,05561,16111,26671,37221,47781,58331,68891,7944 0 1 2 3 4 5 6 7 8 9 10 11 N o . O b s .
Variable: 2016.DT, Distribution: Normal chi-square test= 1,77720, df = 4, p = 0,77665
-0,1056 0,0000 0,1056 0,2111 0,3167 0,4222 0,5278 0,6333 0,7389 0,8444 0,9500 1,0556 1,1611 1,2667 1,3722 1,4778 1,5833 1,6889 1,7944 0 1 2 3 4 5 6 7 8 9 N o . o b s
Variable: 2015.DT, Distribution: Normal chi-square test = 1,93381, df = 4, p = 0,74793
-0,1 0,0 0,1 0,2 0,3 0,4 0,5 0,6 0,7 0,8 0,9 1,0 1,1 1,2 1,3 1,4 1,5 1,6 1,7 1,8 1,9 0 1 2 3 4 5 6 7 8 N o . o b s
Variable: 2014.DT, Distrbution: Normal chi-kwadrat test= 2,96230, df = 4, p = 0,56415
-0,1062 0,0000 0,1062 0,2125 0,3187 0,4250 0,5312 0,6375 0,7437 0,8500 0,9562 1,0625 1,1687 1,2750 1,3812 1,4875 1,5937 0 1 2 3 4 5 6 7 8 9 N o . o b s
Variable: 2013.DT, Distribution: Normal chi-kwadrat test = 1,49853, df = 4, p = 0,82690
-0,1 0,0 0,1 0,2 0,3 0,4 0,5 0,6 0,7 0,8 0,9 1,0 1,1 1,2 1,3 1,4 1,5 1,6 1,7 0 1 2 3 4 5 6 7 8 9 N o . o b s
Figure 1 Histograms of DT variables for medium-sized Marshall hospitals
Source: own calculations in Statistica 13.
aa
Zmienna: 2017.DT, Rozkład: Normalny chi-square test = 14,44184, df = 5, p = 0,01303
-0,20,0 0,2 0,4 0,6 0,8 1,0 1,2 1,4 1,6 1,8 2,0 2,2 2,4 2,6 2,8 0 2 4 6 8 10 12 14 16 18 20 N o . o b s
Variable: 2016.DT , Distribution: Normal chi-square test = 15,67971, df = 5, p = 0,00782
Variable: 2015.DT, Distribution: Normal chi-square = 13,10450, df = 5, p = 0,02242
-0,2 0,0 0,2 0,4 0,6 0,8 1,0 1,2 1,4 1,6 1,8 2,0 2,2 2,4 2,6 2,8 0 2 4 6 8 10 12 14 16 18 20 N o . o b s
Variable: 2014.DT, Distribution: Normal chi-square test= 19,12044, df = 5, p = 0,00183
-0,2 0,0 0,2 0,4 0,6 0,8 1,0 1,2 1,4 1,6 1,8 2,0 2,2 2,4 2,6 0 2 4 6 8 10 12 14 16 18 20 N o . o b s
Variable: 2013.DT , Distrobution: Normal chi-square test= 31,06738, df = 6, p = 0,00002
-0,2 0,0 0,2 0,4 0,6 0,8 1,0 1,2 1,4 1,6 1,8 2,0 2,2 2,4 2,6 2,8 3,0 3,2 3,4 3,6 3,8 0 5 10 15 20 25 N o . o b s
Figure 2 Histograms of DT variables for medium-sized poviat-commune hospitals Source:
own calculations in Statistica 13.
Variable: 2017.SLV, Distributed: Normal chi-square = 82,24143, df = 1, p = 0,00000
-180 -160 -140 -120 -100-80 -60 -40 -20 0 20 40 60 80 100120140 0 10 20 30 40 50 60 70 80 N o . o b s
Variable: 2016.SLV, Distribution: Normal Chi-square: ,df = 0 , p =
----350 -300 -250 -200 -150 -100 -50 0 50 100 0 10 20 30 40 50 60 70 80 N o . o b s
Zmienna: 2015.SLV, Rozkład: Normalny chi-square = 66,88000, df = 1, p = 0,00000
-100 -80 -60 -40 -20 0 20 40 60 80 100 120 140 160 180 0 10 20 30 40 50 60 70 80 N o . o b s
Variable: 2014.SLV, Distribution: Normal chi-square = 106,42421, df = 1, p = 0,00000
Variable: 2013.SLV, Distribution: Normal chi-square test = 60,71637, df = 1, p = 0,00000
-400 -350 -300 -250 -200 -150 -100 -50 0 50 100 0 10 20 30 40 50 60 70 80 N o . o b s
Figure 3 Histograms of SLV variables for medium-sized poviat-commune hospitals
Source: own calculations in Statistica 13.
Variable: 2017.DT, Distribution: Normal d Kołmogorowa-Smirnowa 0,09496, p = n.i., p Lillieforsa < 0,10
-0,2 0,0 0,2 0,4 0,6 0,8 1,0 1,2 1,4 1,6 1,8 2,0 2,2 2,4 0 2 4 6 8 10 12 14 16 18 20 N o . o b s
Variable: 2016.DT, Distribution: Normal d Kołmogorowa-Smirnowa 0,11871, p < 0,20, p Lillieforsa < 0,01
-0,2 0,0 0,2 0,4 0,6 0,8 1,0 1,2 1,4 1,6 1,8 2,0 2,2 2,4 0 2 4 6 8 10 12 14 16 18 20 22 N o . o b s
Variable: 2015.DT , Distribution: Normal d Kołmogorowa-Smirnowa 0,09462, p = n.i., p Lillieforsa < 0,10
-0,2 0,0 0,2 0,4 0,6 0,8 1,0 1,2 1,4 1,6 1,8 2,0 2,2 2,4 0 2 4 6 8 10 12 14 16 18 20 N o . o b s
Variable: 2014.DT , Distribution: Normal d Kołmogorowa-Smirnowa 0,11931, p < 0,20, p Lillieforsa < 0,01
-0,2 0,0 0,2 0,4 0,6 0,8 1,0 1,2 1,4 1,6 1,8 2,0 2,2 0 2 4 6 8 10 12 14 16 18 20 N o . o b s
Variable: 2013.DT, Distribution: Normal d Kołmogorowa-Smirnowa 0,10510, p = n.i., p Lillieforsa < 0,05
-0,2 0,0 0,2 0,4 0,6 0,8 1,0 1,2 1,4 1,6 1,8 2,0 2,2 0 5 10 15 20 25 30 N o . o b s
Figure 4 Histograms of DT variables for large Marshall hospitals
Variable: 2017.SLV, Dostribution: Normal d Kołmogorowa-Smirnowa 0,40816, p < 0,01, p Lillieforsa < 0,01
-450 -400 -350 -300 -250 -200 -150 -100 -50 0 50 100 0 10 20 30 40 50 60 70 80 N o . o b s
Variable: 2016.SLV, Distribution: Normal d Kołmogorowa-Smirnowa 0,45547, p < 0,01, p Lillieforsa < 0,01
-850 -800 -750 -700 -650 -600 -550 -500 -450 -400 -350 -300 -250 -200 -150 -100 -50 0 50 100 150 0 10 20 30 40 50 60 70 80 N o . o b s
Variable: 2015.SLV, Distribution: Normal d Kołmogorowa-Smirnowa 0,21736, p < 0,01, p Lillieforsa < 0,01
-50 -40 -30 -20 -10 0 10 20 30 40 50 60 70 80 0 10 20 30 40 50 60 70 N o . o b s
Variable: 2014.SLV, Distribution: Normal d Kołmogorowa-Smirnowa 0,48984, p < 0,01, p Lillieforsa < 0,01
-1700 -1600 -1500 -1400 -1300 -1200 -1100 -1000 -900 -800 -700 -600 -500 -400 -300 -200 -100 0 100 200 0 10 20 30 40 50 60 70 80 N o . o b s
Variable: 2013.SLV, Distribution: Normal d Kołmogorowa-Smirnowa 0,28550, p < 0,01, p Lillieforsa < 0,01
-30 -25 -20 -15 -10 -5 0 5 10 15 20 25 30 35 40 45 50 55 0 10 20 30 40 50 60 70 N o . o b s
Figure 5 Histograms of SLV variables for large Marshall hospitals
Source: own calculations in Statistica 13.
Variable: 2017.DT, Dostrobution: Normal d Kołmogorowa-Smirnowa 0,11584, p = n.i., p Lillieforsa = n.i.
0,0 0,1 0,2 0,3 0,4 0,5 0,6 0,7 0,8 0,9 1,0 1,1 1,2 1,3 1,4 1,5 1,6 1,7 1,8 1,9 2,0 0 1 2 3 4 5 6 7 8 N o . o b s
Variable: 2016.DT, Distribution: Normal d Kołmogorowa-Smirnowa 0,11693, p = n.i., p Lillieforsa = n.i.
Variable: 2015.DT, Distribution: Normal d Kołmogorowa-Smirnowa 0,11508, p = n.i., p Lillieforsa = n.i.
0,0 0,1 0,2 0,3 0,4 0,5 0,6 0,7 0,8 0,9 1,0 1,1 1,2 1,3 1,4 1,5 1,6 1,7 1,8 1,9 2,0 0 1 2 3 4 5 6 7 8 9 N o. o bs
Variable: 2014.DT, Distribution: Normal d Kołmogorowa-Smirnowa 0,12002, p = n.i., p Lillieforsa = n.i.
0,0 0,1 0,2 0,3 0,4 0,5 0,6 0,7 0,8 0,9 1,0 1,1 1,2 1,3 1,4 1,5 1,6 1,7 1,8 1,9 2,0 0 1 2 3 4 5 6 7 8 N o . o b s
Variable: 2013.DT, Distribution: Normal d Kołmogorowa-Smirnowa 0,13073, p = n.i., p Lillieforsa < 0,20
0,0 0,1 0,2 0,3 0,4 0,5 0,6 0,7 0,8 0,9 1,0 1,1 1,2 1,3 1,4 1,5 1,6 1,7 1,8 1,9 0 1 2 3 4 5 6 7 N o . o b s
Figure 6 Histograms of DT variables for large poviat-commune hospitals
Source: own calculations in Statistica 13.
Variable: 2017.SLV, Distribution: Normal d Kołmogorowa-Smirnowa 0,22589, p < 0,10, p Lillieforsa < 0,01
-20 -15 -10 -5 0 5 10 15 20 25 30 35 0 5 10 15 20 25 N o . o b s
Variable: 2016.SLV, Distribution: Normal d Kołmogorowa-Smirnowa 0,30372, p < 0,01, p Lillieforsa < 0,01
-20 -15 -10 -5 0 5 10 15 20 25 30 35 40 45 50 55 60 65 0 5 10 15 20 25 N o . o b s
Variable: 2015.SLV, Distribution: Normal d Kołmogorowa-Smirnowa 0,28845, p < 0,01, p Lillieforsa < 0,01
-100 -90 -80 -70 -60 -50 -40 -30 -20 -10 0 10 20 30 40 0 5 10 15 20 25 N o . o b s
Variable: 2014.SLV, Distrbution: Normal d Kołmogorowa-Smirnowa 0,38903, p < 0,01, p Lillieforsa < 0,01
-40 -20 0 20 40 60 80 100 120 140 160 180 200 220 Kategoria (górna granica)
Variable: 2013.SLV, Distribution: Normal d Kołmogorowa-Smirnowa 0,27845, p < 0,01, p Lillieforsa < 0,01
-40 -35 -30 -25 -20 -15 -10 -5 0 5 10 15 20 25 0
5 10 15 20 25
N
o
. o
b
s
Figure 7 Histograms of SLV variables for large poviat-commune hospitals