Relative Handgrip Strength is Inversely Associated with the Presence of Type 2 Diabetes in Overweight Elderly Women with Varying Nutritional Status
Mauro Lombardo MD1,2, *, Elvira Padua PhD1,3 *, Francesca Campoli PhD1,3, Michele Panzarino1,3,
Veronica Mîndrescu PhD4, Giuseppe Annino PhD1,3,Ferdinando Iellamo MD, PhD2,3 and Alfonso
Bellia MD, PhD1,2
1Department of Human Sciences and Promotion of the Quality of Life, San Raffaele Open University,
Rome, Italy.
2Department of Systems Medicine, University of Rome “Tor Vergata,” Rome, Italy. 3School of Human Movement Science, University of Rome “Tor Vergata,” Rome, Italy.
4 Faculty of Physical Education and Mountain Sports, Department of Motric Performance.
Transilvania University of Brasov, Romania
*: Both authors contributed equally to this work.
Address correspondence to: Mauro Lombardo, MD
San Raffaele Open University Via di Val Cannuta, 247 00166 Rome
Italy
E-mail: [email protected] https://orcid.org/0000-0001-7509-5487
AUTHORSHIP:
1) Substantial contributions to conception and design, analysis and interpretation of data: ML, AB, EP
2) Acquisition of data: FC, MP
3) Drafting the article or revising it critically for important intellectual content: GA, FI, VM, AB Final approval of the version to be published by ALL AUTHORS
Short Title for Running Head: Relative handgrip strength and diabetes in elderly Word count: 2509
Number of tables: 3 Number of figures: 1
Abstract
Background and Aims
We aimed to investigate cross-sectional relationships of relative handgrip strength (RHGS) with presence of diabetes and hypertension in a community setting.
Methods and Results
Between 2016 and 2018, we enrolled 601 consecutive women with an average age of 70.7 ± 6.9 years (mean ± SD). Nutritional status was evaluated by the Mini Nutritional Assessment (MNA) score. Muscular strength and level of fitness were assessed by handgrip strength (HGS) and other standardized physical functional tests. The majority of participants were overweight or obese (80% with BMI > 25). Prevalence of diabetes and hypertension was 13 and 60%, respectively. Participants in the lowest quartile of HGS adjusted for BMI (RHGS) had significantly higher prevalence of diabetes and hypertension compared with those in the lower quartile (20.7 vs. 5.3% and 49.3 vs. 39.3%, respectively, p < 0.01 for both), whereas differences in nutritional status were not observed. Likelihood of having diabetes was significantly reduced in women with higher RHGS values (OR 0.77; 0.59–0.86 CI95%; p=0.002), independently of age, abdominal adiposity and presence of hypertension. RHGS was positively correlated with most of the physical functional tests performed. Conclusion
RHGS is an easy-to-obtain and inexpensive measure of muscular strength, independently associated with presence of diabetes in overweight elderly women. Prospective studies are required to assess its predictive value in individuals at risk of new onset or progression of diabetes.
Main text
Introduction
Diabetes mellitus (DM) often induces functional deterioration leading to loss of whole-body homeostasis and deterioration in physical function (1).
Sarcopenia is a physiological process consisting of both loss of muscle mass and muscle function that occurs in the elderly. Sarcopenia is a major driver of frailty and has emerged as one of the strongest predictors of disability (2, 3). Frailty is a dynamic process which progresses from a robust condition to a pre-frail stage, then frailty and eventually disability. DM is characterized by a progressive decline in muscle mass, strength and function (4) resulting from the detrimental effects of diabetic peripheral neuropathy and insulin resistance on skeletal muscles (5). Accordingly, muscle weakness has been consistently linked with DM, even amongst well-nourished subjects (6).
Handgrip strength (HGS) is a low-cost assessment tool and an easy indicator of the overall muscular strength of the body. There is likely a direct relationship between muscle strength and functional decline in DM subjects(7, 8), with further potential implications on the underlying disease driven by protein-calorie malnutrition (9).
Methods
Study design
This is a community-based cross-sectional study carried out from January 2016 to December 2018. Participants were adult Caucasian women, enrolled from those routinely attending one of the twenty-seven Senior Centres in the area of Rome and Viterbo (Italy), who gave their own written informed consent to participate. The study protocol was approved by the local Ethical Committee, and the investigation was conducted in accordance with the Declaration of Helsinki. Exclusion criteria were as follows: a history of pacemaker implantation, heart failure, valvular or congenital disease, osteo-articular disorders and use of glucocorticoids, oestrogens and anti-convulsant medications. Given these criteria, 601 Caucasian women over 60 years of age were finally included in the analysis.
Data collection
Participants were asked to report their age and whether they had ever been diagnosed with or treated for DM or hypertension. Standardized questionnaires were used to collect medical history, including former or current use of medications. Nutritional status of participants was evaluated using the standardized Mini Nutritional Assessment (MNA) questionnaire (14). The MNA scale is structured with anthropometric measurements and questions about dietary habits, global health and social assessment, and subjective assessment of health and nutrition. The sum of the MNA score distinguishes elderly patients in: (1) adequate nutritional status, MNA ≥ 24; (2) at risk of malnutrition, MNA between 17 and 23.5; and (3) protein-calorie malnutrition, MNA < 17.
Anthropometric measurements were collected from subjects wearing light clothing and barefoot. Weight was measured using a precision digital scale. Height was measured using a high-precision digital stadiometer. BMI was calculated as weight (kg) divided by height (m2). A standard
the calf's greatest girth with the subject standing upright with feet apart to shoulder width and body weight evenly distributed between both legs. All of these parameters were assessed twice, and the resulting average values were used for subsequent analysis.
Functional tests
The 30-Second Chair Stand Test (CST) was implemented for the evaluation of lower limb strength (15). The subject, sitting in the middle of a standard chair (high 43 cm), with arms crossed at his chest and hands on his shoulders, was invited to get up from a chair up to the complete extension of legs and to repeat the movement. The total number of repetitions performed in a 30-second duration was recorded. All trials were performed using the same chair and with similar ambient conditions as previously described (16). The Reverse Crunch Test (RCT)was used for the assessment of abdominal muscle strength (17). The subjects from the decubitus supine position with feet on the ground moved their knees to their chest and back to the starting position. The total number of repetitions performed in a 30-second duration was recorded. Subjects performed the One-legged Stance Test (OLST) with open eyes and their hands gripped on their iliac crests, while staying, without assistance, on one foot with the other leg flexed forward. The number of seconds that the position was properly kept was recorded (18). The Fingertip-to-floor (FTF) test was used to assess the degree of flexibility in elderly subjects. The subjects were asked to flex their trunks forward while extending their arms forward with joined hands. The distance between the middle finger of the subject and the floor was measured with a standard measuring tape (19).
Hand-grip strength
hard as they could until they could not squeeze any harder. Subjects were asked to take a breath in and then blow out while squeezing. A resting interval of 30 seconds was allowed between each measurement. A measure of three times was reported as an average. RHGS was estimated as the average value for maximum grip strength of the dominant hand divided by BMI, as previously reported (10-13).
Statistical analysis
Results
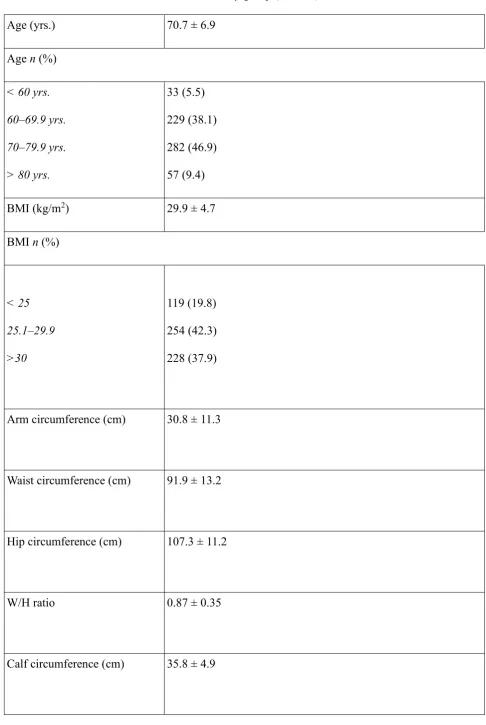
Table 1 shows the main clinical characteristics of the study population. Mean age was 70.7±6.9 years. Out of the total participants, 339 (56.3%) belonged to the age group of over 70 years. The majority of participants were overweight or obese, with nearly 80% of the subjects recorded with a BMI over 25 and predominant abdominal obesity according to WC measurements (91.9 ± 13.2 cm). Presence of DM and hypertension were reported by 13 and 60% of participants, respectively.
According to MNA score, 498 (82.8%) subjects were well nourished (MNA >24), whereas 103 subjects (17.2%) were reported to be at risk of malnutrition (MNA 17-23.5). No subjects were identified as being malnourished (MNA <17).
Measures of muscular strength included the mean absolute HGS at 23±4.8 kg and the average RHGS at 0.81±0.21 kg/BMI. We observed significant associations of RHGS with all selected physical functional tests. As shown in the regression plots (Fig 1a–d), Spearman’s rank correlation coefficients revealed a trend toward a significant positive relationship between RHGS and CST (Rho=0.208, p<0.001), RCT (Rho=0.179, p<0.001) and OLST (Rho=0.122, p=0.01), whereas an inverse
association was observed with FTF (Rho=-0.215, p<0.001).
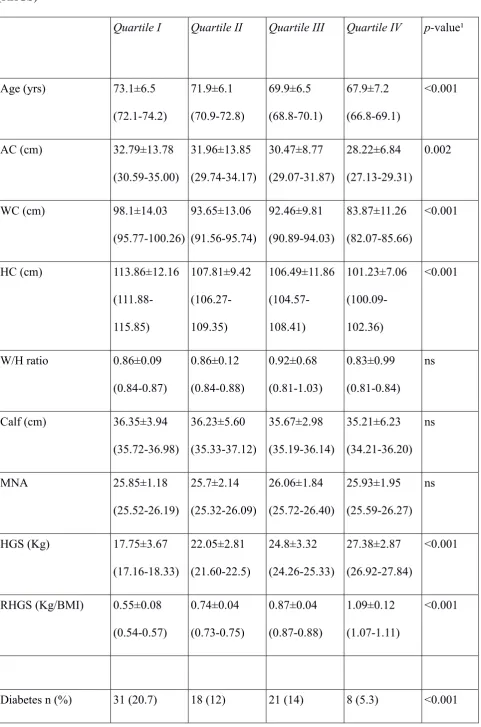
When RGHS was further analysed as a categorical variable (Table 2), individuals in the lowest quartile, compared with those in the highest category, were significantly older (p<0.001) and basically more overweight according to most selected anthropometric measures (namely arm, waist and hip circumference, p<0.002 for all). Of note, no inter-quartile differences were observed in MNA mean values as well as in the proportion of patients with adequate nutritional status or at risk for malnutrition. Prevalence of DM was significantly higher in subjects with lower RHGS values (20.7%), with a significant decreasing trend across RHGS categories (p<0.001) (Table 2). Similar figure was observed for the prevalence of hypertension.
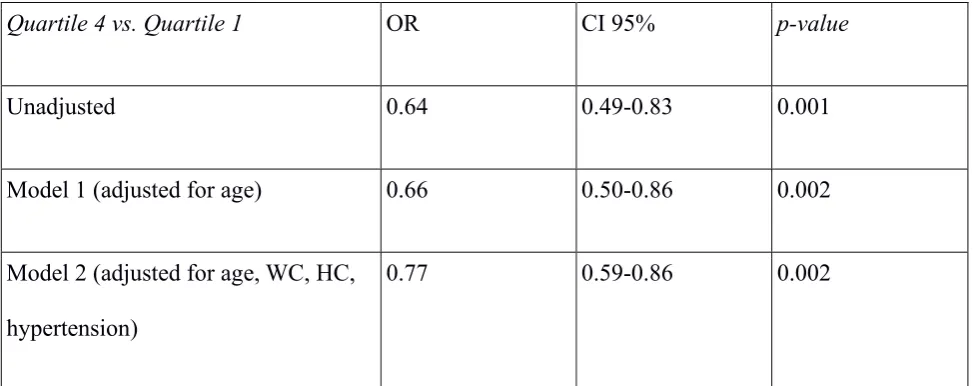
relevance of the independent association between the presence of DM and RHGS (OR 0.77; IC95% 0.59–0.86; p = 0.002).
Discussion
In recent years, new therapies for DM have facilitated the ability to achieve measures of good disease control in most cases (21). The same cannot be said for the diagnosis of DM, and especially for type 2 diabetes which is often asymptomatic in the early stage. Accordingly, 3- and 6-years delay in the diagnosis and treatment of type 2 diabetes has been estimated in Europe, mostly because of physicians clinical inertia or patients difficulties to access to health care system screening programs (22). It is therefore necessary that diagnostic tools are developed as simple and easily reproducible as possible, especially in primary care setting.
The pathophysiological process for the observed link of RHGS with DM may be due to impaired insulin sensitivity and inflammation, since these two factors are both associated with low muscular fitness (26). Fat infiltration in the muscle may also play a role, causing impaired muscular function. (26). Alternatively, low RHGS might be associated with low cardiorespiratory fitness, which in turn has been demonstrated to increase the risk of developing type 2 diabetes (27).
Interestingly, no significant relationships were seen between RHGS values and MNA scores in our population study. This is somewhat surprising, since reduced muscle health is likely to be more frequently detected in subjects with concomitant evidence of malnutrition. It was not the case of women enrolled in this study, as those in the lowest quartile of RHGS did not report MNA scores consistent with higher risk of malnutrition, compared with the top quartile. Such a discrepancy could be attributable to inherent limitations of self-administered questionnaires, as MNA is, whose results are necessarily affected by certain risk of misclassification. Alternatively, this lack of association might be attributable to the fact that the majority of individuals reported to be well nourished, without any of them in the MNA-derived category of malnutrition, even among those with lowest values of RHGS. However, we believe these data cannot be firmly conclusive and more precise criteria (e.g. biochemical criteria) of malnutrition are needed to better assess potential relationship between RHGS and nutritional status.
Interestingly, RHGS might be an useful and inexpensive tool to also indirectly assess cardiovascular health in elderly obese women. In this sense, it has been previously demonstrated that older women with lower RHGS present an impaired heart rate recovery following a treadmill exercise test (11). In accordance, in our study, women with lower RHGS had concomitantly higher prevalence of hypertension, with significant decreasing trend across quartiles of RHGS, irrespective of age. These results are also in line with previous findings from the database of the National Health and Nutrition Examination Survey, revealing an inverse relationship between grip strength and hypertension in adults with healthy BMI and no history of cardiovascular disease (28).
about the causality of the associations observed between reduced RHGS and DM. Appropriate longitudinal studies will be needed to confirm our results. Finally, both DM and hypertension were only self-reported by patients themselves or assessed by researchers on the basis of medications taken, therefore with not negligible risk for underestimation. However, prevalence rates of both conditions in our study were in line with those reported for elderly population in Italy.
In conclusion, our results show that RHGS can provide a valid estimate of muscular strength and physical efficiency in overweight elderly women, with significant relationship with presence of diabetes and hypertension. Future longitudinal researches could explore the predictive value of RHGS in the risk assessment of diabetes in elderly populations.
Acknowledgments
All authors state they have no conflicts of interest regarding this study.
References
1. Floody PD, Navarrete FC, Elgueta HO, Díaz MC, Mayorga DJ, Poblete AO. Efectos de un programa de ejercicio físico estructurado sobre los niveles de condición física y el estado nutricional de obesos mórbidos y obesos con comorbilidades. Nutrición Hospitalaria. 2016;33(2). https://dx.doi.org/10.20960/nh.107
2. Keller K, Engelhardt M. Strength and muscle mass loss with aging process. Age and strength loss. Muscle Ligaments and Tendons Journal. 2019;03(04):346. https://10.32098/mltj.04.2013.17
3. Lombardo M, Boaria A, Aulisa G, Padua E, Annino G, Pratesi A, Caprio M, Iellamo F, Bellia A. Sarcopenic obesity: etiology and lifestyle therapy. Eur Rev Med Pharmacol 2019;23:7152-7162. https://10.26355/eurrev_201908_18761
5. Sinclair AJ, Abdelhafiz AH, Rodríguez-Mañas L. Frailty and sarcopenia - newly emerging and high impact complications of diabetes. Journal of Diabetes and its Complications. 2017;31(9):1465–73. https://10.1016/j.jdiacomp.2017.05.003
6. Sinclair AJ, Rodriguez-Mañas L. Diabetes and Frailty: Two Converging Conditions? Canadian Journal of Diabetes. 2016;40(1):77–83. https://10.1016/j.jcjd.2015.09.004
7. Leenders M, Verdijk LB, Hoeven LVD, Adam JJ, Kranenburg JV, Nilwik R, et al. Patients With Type 2 Diabetes Show a Greater Decline in Muscle Mass, Muscle Strength, and Functional Capacity With Aging. Journal of the American Medical Directors Association. 2013;14(8):585–92. https://10.1016/j.jamda.2013.02.006
8. Lee M-R, Jung SM, Bang H, Kim HS, Kim YB. Association between muscle strength and type 2 diabetes mellitus in adults in Korea. Medicine. 2018;97(23). https://10.1097/md.0000000000010984
9. Vischer UM, Perrenoud L, Genet C, Ardigo S, Registe-Rameau Y, Herrmann FR. The high prevalence of malnutrition in elderly diabetic patients: implications for anti-diabetic drug treatments. Diabetic Medicine. 2010;27(8):918–24. https://10.1111/j.1464-5491.2010.03047.x
10.Yi D, Khang AR, Lee HW, Son SM, Kang YH. Relative handgrip strength as a marker of metabolic syndrome: the Korea National Health and Nutrition Examination Survey (KNHANES) VI (2014–2015). Diabetes, Metabolic Syndrome and Obesity: Targets and Therapy. 2018;Volume 11:227–40. https://10.2147/dmso.s166875
11.Silva CR, Saraiva B, Nascimento DDC, et al. Relative Handgrip Strength as a Simple Tool to Evaluate Impaired Heart Rate Recovery and a Low Chronotropic Index in Obese Older Women.Int J Exerc Sci. 2018;11(2):844–855.
12.Hong S. Association of Relative Handgrip Strength and Metabolic Syndrome in Korean Older Adults: Korea National Health and Nutrition Examination Survey VII-1. Journal of Obesity & Metabolic Syndrome. 2019;28(1):53–60. https://10.7570/jomes.2019.28.1.53
14.Cereda E. Mini Nutritional Assessment. Current Opinion in Clinical Nutrition and Metabolic Care. 2012;15(1):29–41. https://10.1097/MCO.0b013e32834d7647
15.Tsai Y-J, Yang Y-C, Lu F-H, Lee P-Y, Lee I-T, Lin S-I. Functional Balance and Its Determinants in Older People with Diabetes. Plos One. 2016;11(7). https://10.1371/journal.pone.0159339
16.Rikli RE, Jones CJ. Development and Validation of a Functional Fitness Test for Community-Residing Older Adults. Journal of Aging and Physical Activity. 1999;7(2):129–61. https://10.1123/japa.7.2.129
17.Sternlicht E, Rugg S. Electromyographic Analysis of Abdominal Muscle Activity Using Portable Abdominal Exercise Devices and a Traditional Crunch. The Journal of Strength and Conditioning Research. 2003;17(3):463. https://10.1519/1533-4287(2003)017<0463:eaoama>2.0.co;2
18.Springer BA, Marin R, Cyhan T, Roberts H, Gill NW. Normative Values for the Unipedal Stance Test with Eyes Open and Closed. Journal of Geriatric Physical Therapy. 2007;30(1):8– 15. https://10.1519/00139143-200704000-00003
19. Perret C, Poiraudeau S, Fermanian J, Colau MML, Benhamou MAM, Revel M. Validity, reliability, and responsiveness of the fingertip-to-floor test. Archives of Physical Medicine and Rehabilitation. 2001;82(11):1566–70. https://10.1053/apmr.2001.26064
20.Cruz-Jentoft AJ, Bahat G, Bauer J, Boirie Y, Bruyère O, Cederholm T, et al. Sarcopenia: revised European consensus on definition and diagnosis. Age and Ageing. 2019;48(4):601. https://10.1093/ageing/afz046
21.8. Pharmacologic Approaches to Glycemic Treatment:Standards of Medical Care in Diabetes—2018. Diabetes Care. 2017Aug;41(Supplement 1). https://10.2337/dc18-S008 22.Herman WH, Ye W, Griffin SJ, Simmons RK, Davies MJ, Khunti K, et al. Early Detection
23.Cheung C-L, Nguyen U-SDT, Au E, Tan KCB, Kung AWC. Association of handgrip strength with chronic diseases and multimorbidity. Age. 2012Aug;35(3):929–41. https://
24.Manini TM, Clark BC. Dynapenia and aging: an update. J Gerontol A Biol Sci Med Sci. 2012 Jan;67(1):28-40. https://10.1093/gerona/glr010.
25.Rantanen T, Guralnik JM, Foley D, Masaki K, Leveille S, Curb JD, White L. Midlife hand
grip strength as a predictor of old age disability. JAMA 1999 Feb 10;281(6):558-60. https://10.1001/jama.281.6.558
26.Li S, Zhang R, Pan G, Zheng L, Li C. Handgrip strength is associated with insulin resistance
and glucose metabolism in adolescents: Evidence from National Health and Nutrition Examination Survey 2011 to 2014. Pediatr Diabetes. 2018;19(3):375–380. https://10.1111/pedi.12596
27.Tarp J, Støle AP, Blond K, Grøntved A. Cardiorespiratory fitness, muscular strength and risk
of type 2 diabetes: a systematic review and meta-analysis. Diabetologia. 2019;62(7):1129– 1142. https://10.1007/s00125-019-4867-4
28.Mainous AG, Tanner RJ, Anton SD, Jo A. Grip Strength as a Marker of Hypertension and
Tables
Table 1. Main clinical characteristics of the study group (n = 601)
Age (yrs.) 70.7 ± 6.9
Age n (%) < 60 yrs.
60–69.9 yrs.
70–79.9 yrs.
> 80 yrs.
33 (5.5) 229 (38.1) 282 (46.9) 57 (9.4)
BMI (kg/m2) 29.9 ± 4.7
BMI n (%)
< 25
25.1–29.9
>30
119 (19.8) 254 (42.3) 228 (37.9)
Arm circumference (cm) 30.8 ± 11.3
Waist circumference (cm) 91.9 ± 13.2
Hip circumference (cm) 107.3 ± 11.2
W/H ratio 0.87 ± 0.35
Diabetes n (%)
78 (13)
Hypertension n (%)
363 (60.4)
MNA 25.9 ± 1.9
MNA n (%)
Adequate (>24)
At risk (17–23.5)
Malnutrition (< 17)
498 (82.9)
103 (17.1)
0 (0)
HGS (kg)
23 ± 4.8
RHGS (kg/BMI)
0.81 ± 0.21
Table 2. Main clinical features of the study group by quartile categories of relative handgrip strength (RHGS)
Quartile I Quartile II Quartile III Quartile IV p-value¹
Age (yrs) 73.1±6.5
(72.1-74.2) 71.9±6.1 (70.9-72.8) 69.9±6.5 (68.8-70.1) 67.9±7.2 (66.8-69.1) <0.001
AC (cm) 32.79±13.78
(30.59-35.00) 31.96±13.85 (29.74-34.17) 30.47±8.77 (29.07-31.87) 28.22±6.84 (27.13-29.31) 0.002
WC (cm) 98.1±14.03
(95.77-100.26) 93.65±13.06 (91.56-95.74) 92.46±9.81 (90.89-94.03) 83.87±11.26 (82.07-85.66) <0.001
HC (cm) 113.86±12.16
(111.88-115.85) 107.81±9.42 (106.27-109.35) 106.49±11.86 (104.57-108.41) 101.23±7.06 (100.09-102.36) <0.001
W/H ratio 0.86±0.09
(0.84-0.87) 0.86±0.12 (0.84-0.88) 0.92±0.68 (0.81-1.03) 0.83±0.99 (0.81-0.84) ns
Calf (cm) 36.35±3.94
(35.72-36.98) 36.23±5.60 (35.33-37.12) 35.67±2.98 (35.19-36.14) 35.21±6.23 (34.21-36.20) ns
MNA 25.85±1.18
(25.52-26.19) 25.7±2.14 (25.32-26.09) 26.06±1.84 (25.72-26.40) 25.93±1.95 (25.59-26.27) ns
HGS (Kg) 17.75±3.67
(17.16-18.33) 22.05±2.81 (21.60-22.5) 24.8±3.32 (24.26-25.33) 27.38±2.87 (26.92-27.84) <0.001
RHGS (Kg/BMI) 0.55±0.08 (0.54-0.57) 0.74±0.04 (0.73-0.75) 0.87±0.04 (0.87-0.88) 1.09±0.12 (1.07-1.11) <0.001
Hypertension n (%) 74 (49.3) 73 (48.7) 58 (38.7) 59 (39.3) 0.004 Adequate Nutritional
state (MNA >24) n (%)
30 (20) 29 (19.3) 23 (15.3) 28 (18.5) ns
At risk for
malnutrition (MNA 17-23.5) n (%)
120 (80) 121 (80.7) 127 (84.7) 123 (81.4) ns
Table 3. Multivariable logistic regression analysis for categories (quartiles) of RHGS vs. presence of diabetes
Quartile 4 vs. Quartile 1 OR CI 95% p-value
Unadjusted 0.64 0.49-0.83 0.001
Model 1 (adjusted for age) 0.66 0.50-0.86 0.002
Model 2 (adjusted for age, WC, HC, hypertension)
0.77 0.59-0.86 0.002
Figure
Abbreviations: CST, 30-Second Chair Stand Test; RCT, Reverse Crunch Test; OLST, One-legged Stance Test; FTF, Fingertip-to-floor test; RHGS, relative handgrip strength (HGS/BMI).
Abbreviations: