Poulos, N. et al.: COMPLEX TRAINING AND COUNTERMOVEMENT JUMP...
75 Kinesiology 50(2018) Suppl.1:75-89
COMPLEX TRAINING AND COUNTERMOVEMENT
JUMP PERFORMANCE ACROSS MULTIPLE SETS:
EFFECT OF BACK SQUAT INTENSITY
Nick Poulos
1,5, Anis Chaouachi
4,6, Martin Buchheit
2,3, Denis Slimani
4,
Gregory G. Haff
1, and Robert U. Newton
11
Centre for Exercise and Sports Science Research, Edith Cowan University,
Joondalup, Western Australia, Australia
2
Paris Saint Germain, Saint-Germain-En-Laye, France
3
Sport Development and Analysis, Myorobie Association, Montvalezan, France
4
Tunisian Research Laboratory “Sports Performance Optimisation”,
National Centre of Medicine and Science in Sports (CNMSS), Tunis, Tunisia
5
Australian Rugby Union, Sydney, Australia
6
AUT University, Sports Performance Research Institute New Zealand, Auckland, New Zealand
Original scientific paper UDC: 796.015.367:796.012.82
Abstract:
The purpose of this investigation was to determine the acute effects of back squats on countermovement jump performance across multiple sets using a strength-power potentiation complex training protocol. Fifteen elite volleyball players performed three unloaded countermovement jumps (CMJ) following three repetitions of the back squat performed at either 65% or 87% of 1-RM, respectively, repeated for 10 sets. A control session of three CMJs was also repeated for 10 sets. Mean jump height performance was enhanced compared to performing CMJs only irrespective of which intensity was used (65% 1-RM: +3.3 ± 2.2% [CI: 1.0 to 5.6]; 87% 1-RM: 2.6 ± 1.9% [CI: 0.7 to 4.5]). Subjects with a greater relative strength possessed a very likely large (97%; ES = 1.51) chance of improvement in jump height across 10 sets of the protocol prescribed using the intensity of 87% 1-RM and a likely moderate (89%; ES = 0.94) and very likely large (97%; ES = 1.76) chance of improvement in maximum concentric impulse (N·s) using intensities of 65% and 87%1-RM, respectively. Performance (jump height and maximum concentric impulse) may be enhanced across 10 sets of the strength power potentiation complex training protocol prescribed irrespective of intensity, with a greater effect observed for the subjects with a greater relative strength and with the 87% 1-RM heavy load back squat condition. In practice, coaches should consider the athlete’s strength level when designing such a complex training protocol to generate any post-activation potentiation effect across multiple alternating sets to enhance jump performance.
Key words: complex training, postactivation potentiation, PAP, conditioning stimulus
Introduction
Alternating a specific resistance exercise with
a biomechanically similar plyometric exercise has been referred to as complex training (CT) (Comyns, Harrison, Hennessy, & Jensen, 2007). The use of a strength-power potentiation complex training
pro-tocol aims to benefit from the transient increase in
muscle contractile performance after a brief maxi-mal or near-maximaxi-mal voluntary contraction (Rob-bins, 2005). This response is known as post-activa-tion potentiapost-activa-tion (PAP) whereby acute muscle force output is enhanced as a result of contractile history
Ag-Poulos, N. et al.: COMPLEX TRAINING AND COUNTERMOVEMENT JUMP...
76
Kinesiology 50(2018) Suppl.1:75-89
geloussis, Kasimatis, Mavromatis, & Garas, 2003; Kilduff, et al., 2008; McCann & Flanagan, 2010; Mitchell & Sale, 2011; Rixon, Lamont, & Bemben, 2007; Smilios, et al., 2005; Young, Jenner, &
Grif-fiths, 1998) (e.g., 2.9% increase in CMJ height at
4 min [Mitchell & Sale, 2011]), while either a de-crease (Jensen & Ebben, 2003; Jones & Lees, 2003; Mangus, et al., 2006; Rixon, et al., 2007; Scott & Docherty, 2004) (e.g. 10% decrease in CMJ height immediately following heavy back squats [Jensen & Ebben, 2003]), or no improvement (Hanson, Leigh, & Mynark, 2007; Jones & Lees, 2003; Khamoui, et al., 2009) (e.g. 0.01%, -0.02%, -0.03% change in CMJ height at 3, 10 and 20 min respectively [Jones & Lees, 2003]) has been found in other studies. The
reasons for these somewhat conflicting findings are
not all understood, but athlete strength levels, con-ditioning stimulus nature (including type, volume and intensity) and the time course between the stim-ulus and the performance measure are likely the most important determinants (Seitz & Haff, 2016).
As previously reported (Weber, Brown, Co-burn, & Zinder, 2008), conditions that have been proposed to be effective and characteristics for pro-moting, seemingly, PAP to the greatest extent in-clude the observation that PAP is more effective in: biomechanically similar sets (Robbins, 2005); athletes more so than non-athletes; individuals with a greater relative strength (Duthie, Young, & Ait-ken, 2002); athletes with a greater proportion of FT
muscle fibers (Hamada, Sale, Macdougall, & Tar -nopolsky, 2000b); heavy loads (<6 repetition max-imum (RM) lifts) (Duthie, et al., 2002; Hamada, Sale, Macdougall, & Tarnopolsky, 2000; Smith, Fry, Weiss, Yuhua, & Stephen, 2001; Young, et al., 1998) and rest intervals (intra-complex rest
inter-val) between two and five minutes (min) (Robbins,
2005), although more recent research has suggest-ed rest intervals of between 8 and 12 min are nec-essary to exhibit a PAP effect in some populations (Comyns, Harrison, Hennessy, & Jensen, 2006; Kilduff, et al., 2007, 2008). Fatigue and PAP can co-exist in skeletal muscle and muscle performance following heavy resistance exercise (HRE) will de-pend on the balance between muscle fatigue and muscle potentiation (Rassier & Macintosh, 2000). Baker (2009) has suggested that most studies that
have not reported a significant performance bene
-fit during CT have used in excess of 85% 1-RM or
5-RM for the HRE and recommended that using lighter resistances in the range of 60-75+% 1-RM is generally more effective when using CT (Baker, 2003, 2009; Baker & Newton, 2005, 2006), but not always (Crum, 2012). This is even though maximal resistance has been suggested to be necessary for full motor unit recruitment and thus may be an im-portant contributor to the stimulation of a PAP ef-fect. A considerable amount of neural fatigue will result following the use of a 3-RM or 5-RM
pro-tocol, which may explain why longer rest periods are required prior to a subsequent plyometric ex-ercise. In addition, evidence suggests that an indi-vidual’s muscular strength may determine a PAP effect or response following a conditioning con-traction (Tillin & Bishop, 2009) (e.g. Gourgoulis et al. (2003) found a 4% increase in CMJ height following heavy load back squats in subjects able to squat a load > 160 kg). Ruben et al. (2010) found that the individuals who were able to back squat
≥ 2.0 times body mass were able to exhibit a PAP
effect in a horizontal plyometric activity (hurdle jumps) following an ascending squat protocol (av-erage peak power output: 38.3 ±26.27 % increase; average peak velocity: 24.8 ± 19.3% increase). The recent meta-analysis by Seitz and Haff (2016) also suggested that stronger individuals were able to ex-hibit a greater PAP effect (effect size [ES] = 0.410 than weaker counterparts (ES = 0.32), which might be explained by the fact that stronger individuals might possess a greater percentage of type II muscle
fibers and thus greater phosphorylation of myosin
light chain, which was one of the peripheral fac-tors proposed as a mechanism underpinning PAP. Furthermore, Seitz and Haff (2016) suggested that balance between fatigue and PAP following a con-ditioning stimulus might be affected by a strength level of the individual, with stronger individuals de-veloping some level of fatigue resistance to heavier loads after a near-maximal effort.
While these studies have examined the acute effects of dynamic maximal voluntary contractions (MVCs) on CMJ performance, there appears to be only two studies (Andrews, et al., 2011; Duthie, et al., 2002) that have investigated the set-to-set com-bination of a HRE followed by a subsequent bio-mechanically similar plyometric exercise such as a CMJ conducted over multiple sets, which may be more typical of an applied complex training ses-sion. Andrews et al. (2011) investigated CMJ per-formance across three sets using either heavy load back squats or hang cleans as the conditioning stim-ulus in a complex pair vs. CMJs only in trained col-lege-aged women (back squat = 1.49 ± 0.30 body weight [BW], hang clean = 1.01 ± 0.15 BW). The hang clean (0.30 cm decrease) was superior to the back squat (2.0 cm decrease) in maintaining consist-ent CMJ performance across three sets with three min of intra-complex and between-set rest intervals, while performing only CMJs demonstrated a 1.6 cm decrease in performance. However, as reported by Andrews et al. (2011), the results of this study may not extend to other populations such as elite male athletes or individuals of differing training status. Duthie et al. (2002) compared the use of alternating the 3-RM half squat and loaded jump squats
(con-centric only) across three sets (defined as ‘contrast’
undertak-Poulos, N. et al.: COMPLEX TRAINING AND COUNTERMOVEMENT JUMP...
77 Kinesiology 50(2018) Suppl.1:75-89
en prior to three sets of the half squat in resistance trained women. Stronger athletes (mean predicted
1-RM half squat: 139kg) were able to benefi t from
the CT with an increase in peak power (+4%) and maximum force (+2%) compared to the traditional training. Conversely, weaker athletes (mean
predict-ed 1-RM half squat: 116kg) were unable to benefi t
from this form of priming. Despite these studies and their varying protocols and outcomes, it re-mains unclear whether using a CT protocol across
multiple sets may provide a performance benefi t
or PAP effect.
If a CT protocol is to be used during training in a trained athletic population, the optimal bal-ance between volume and intensity needs to be es-tablished along with an appropriate intra-complex rest interval. Consequently, an examination of vol-ume and intensity pertaining to the use of CT over a number of sets or a training session is warranted should practitioners be seeking to utilize the
pro-posed performance enhancing benefi ts of this form
of training PAP.
Therefore, the aim of this study was to
deter-mine how specifi c CT protocols, varying in load intensity, affect the PAP benefi t over multiple sets
of a training session in elite volleyball players with
an extensive training history. More specifi cally, the
purposes of this study were to: (i) investigate the global effect of varying load intensity of back squats on CMJ performance conducted over multiple sets in the form of a complex training; (ii) investigate whether absolute or relative strength may be a cri-teria for identifying responders or non-responders to changes in CMJ performance; and (iii) examine whether a particular time course for performance may be established across 10 sets of CT, and wheth-er this is related to athletes’ strength charactwheth-eristics.
Methods
Subjects
Fifteen (n = 15) male elite volleyball players from senior teams competing in the Tunisian na-tional volleyball competition (nana-tional team, n = 6; and professional, n = 9) were recruited for the study (mean ± SD: age 24.3 ± 2.6 years, body mass 88.95 ± 7.9 kg, body height 1.93 ± 0.08 m, training volume 12 ± 2 hours a week). All volleyball play-ers had a minimum of two-year experience in per-forming the back squat and had been familiarized throughout the training year with various forms of CT including those that contained the back squat and CMJ. Athletes had just commenced the early phase of the post-competitive volleyball season and
were about to commence preparation for a fi nal
se-ries. No structured resistance or other training pro-gram was undertaken by any athlete during the time of testing. All subjects completed informed writ-ten consent documents after the approval from the
University Human Research Ethics Committee at the Edith Cowan University and the Ethics Com-mittee of the National Centre of Medicine and Sci-ence in Sports, Tunis, Tunisia. The study also con-formed to the recommendations of the Declaration of Helsinki.
Design
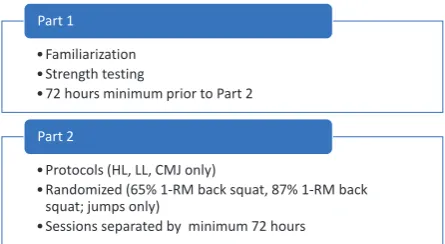
In this study, we examined the effect of manip-ulating load intensity of a dynamic back squat on CMJs performed over multiple sets in elite senior-level volleyball players. Fifteen elite male volley ball players performed two CT protocols using ei-ther a heavy load (HL), using 87% 1-RM, or lighter load (LL), using 65% 1-RM back squat in a rand-omized design (Figure 1). Subjects performed three unloaded countermovement jumps (CMJ) on a force platform following three repetitions of a back squat protocol, using either a HL or LL, and this complex was repeated for 10 sets (Figure 2). Baseline CMJs served as a baseline in each session and were com-pared with the post-squat CMJs for each set dur-ing each session.
An additional control session involving 10 sets of unloaded CMJs was also undertaken to exam-ine whether any effect on the selected performance parameters was observed in the absence of a back squat CT protocol. The order of the three condi-tions was randomized across three separate days.
Methods
This study was completed in two parts under-taken over four separate sessions (Figures 1 and 2). All subjects arrived at the training facility at the same time each day and were tested at the same time. A minimum of 72 hours separated each test-ing session. Subjects were asked to refrain from alcohol, caffeine, or any strenuous activities, re-sistance, or plyometric training at least 48 hours prior to each testing session. Consumption of water (500 ml) was permitted during each test and ver-bal encouragement was provided to maximize per-formance.
Seitz, L.B., & Haff, G. (2016). Factors modulating post-activation potentiation of jump, sprint, throw,
and upper-body ballistic performances: A systematic review with meta-analysis. Sports Medicine,
46(2), 231-240.
Smilios, I., Pilianidis, T., Sotiropoulos, K., Antonakis, M., & Tokmakidis, S.P. (2005). Short-term
effects of selected exercise and load in contrast training on vertical jump performance. Journal of
Strength and Conditioning Research, 19(1), 135-139.
Smith, J., Fry, C., Weiss, W., Yuhua, L., & Stephen, J.K. (2001). The effects of high intensity exercise
on a 10-second sprint cycle test.Journal of Strength and Conditioning Research, 15(3), 344-348.
Tillin, N.A., & Bishop, D. (2009). Factors modulating post-activation potentiation and its effect on
performance of subsequent explosive activities. Sports Medicine, 39(2), 147-166.
Weber, K.R., Brown, L.E., Coburn, J.W., & Zinder, S.M. (2008). Acute effects of heavy-load squats on
consecutive squat jump performance. Journal of Strength and Conditioning Research, 22(3), 726.
Young, W.B., Jenner, A., & Griffiths, K. (1998). Acute enhancement of power performance from heavy
load squats. Journal of Strength and Conditioning Research, 12(2), 82-84.
•Familiarization
•Strength testing
•72 hours minimum prior to Part 2
Part 1
•Protocols (HL, LL, CMJ only)
•Randomized (65% 1-RM back squat, 87% 1-RM back
squat; jumps only)
•Sessions separated by minimum 72 hours
Part 2
Figure 1. Outline of Part 1 and Part 2.
Poulos, N. et al.: COMPLEX TRAINING AND COUNTERMOVEMENT JUMP...
78
Kinesiology 50(2018) Suppl.1:75-89
Part 1. Before the main experimental trials (Part 2), subjects visited the laboratory to become fa-miliar with the testing methods (complex training protocol) and to have their 3-RM back squat
deter-mined. On their fi rst arrival at the laboratory, each
subjects’ age, body height (BH; m) and body mass (BW; kg) was recorded. A full description of the CT testing procedures was explained in detail to the subjects. Athletes were required to undertake a standardized dynamic warm-up protocol (warm-up protocol 1) adapted from Moir et al. (Chaouachi, et al., 2011; Moir, Dale, & Dietrich, 2009). This in-volved performing a series of dynamic exercises consisting of two sets of 10 body-weight squats and two repetitions of lunge walks over 10 m with two minutes of recovery between sets. Athletes then performed two sets of three CMJs at intensities of 60% and 80% of maximum effort, separated by a
recovery period of two minutes. A 10-second re-covery separated each individual jump. Athletes
then progressed to a more specifi c warm-up
proto-col (warm-up protoproto-col 2) in preparation for heavy load back squat adapted from previous research in-vestigating PAP (Chaouachi, et al., 2011; Kilduff, et al., 2008). Warm-up protocol 2 involved subjects performing three warm-up sets of eight repetitions at 50% of their previously determined 1-RM, 4 rep-etitions at 70% 1-RM and two reprep-etitions at 80% 1-RM.
Back squat testing session. Following the fi nal
warm-up set, each participant attempted three rep-etitions of the chosen set load (3-RM). If the lift was successful, the weight was increased until the weight could not be lifted through the full range of motion. All subjects were required to have their 3-RM determined within a maximum of three at-tempts. A 5-minute rest was imposed between all attempts to allow adequate time to recover (Kilduff, et al., 2008). A lift was deemed successful as de-scribed by the International Powerlifting Federation (2007) rules for performing the back squat requir-ing the subject to descend to a point where the in-guinal fold was lower than the patella and ascend to the starting position without assistance (Hanson, et al., 2007). Each athlete’s 3-RM back squat was determined and 1-RM was then estimated using the tables provided by Haff and Triplett (Haff & Triplett, 2016).
Part 2. Subjects participated in three testing ses-sions, randomized and counterbalanced over two weeks, involving two CT protocols, a HL and LL protocol, as well as a CMJ only session. Warm-up protocols were adhered to as described previously. Countermovement jump assessment. Vertical jump performance was assessed as previously de-scribed (Chaouachi, et al., 2011) on a Quattro Jump portable piezoelectric force plate (Kistler
Instru-Note. HL = heavy load; LL – light load; CMJ = countermovement jump; RM = repetition maximum.
Figure 1. Outline of Part 1 and Part 2.
Note. HL = heavy load; LL – light load; CMJ = countermovement jump; RM = repetition maximum. Note. 15-second rest was undertaken between each CMJ.
Figure 2. Description of 3 randomized protocols.
HL session
Warm-up protocol 1 & 2
5 minutes rest
(i) 3 repetitions HL back squat (87% 1-RM)
(ii) 3 minutes rest
(iii) 3 repetitions CMJ
(iv) 3 minutes rest
Repeat sequence (i) - (iv) until 10 sets have been completed
LL session
Warm-up protocol 1 & 2
5 minutes rest
(i) 3 repetitions of LL back squat (65% 1-RM)
(ii) 3 minutes rest
(iii) 3 repetitions CMJ
(iv) 3 minutes rest
Repeat sequence (i) - (iv) until 10 sets have been completed
CMJ session
Warm-up protocol 1
(i) 3 repetitions CMJ
(ii) 3 minutes rest
Repeat sequence (i) - (ii) until 10 sets have been completed
Note. HL = heavy load; LL – light load; CMJ = countermovement jump; RM = repetition maximum.
Note. 15-second rest was undertaken between each CMJ.
Figure 2. Description of 3 randomized protocols.
Note.
= 1 repetition of back squat; = 1 repetition of CMJ; = 3-minute recovery; 15-second
recovery was undertaken between each CMJ.
Complex Training Protocol represented in repetition format for the LL (65% 1- RM back squat)
and HL ( 85% 1-RM back squat) with 3-minute recovery prior to completing 3 CMJs.
Figure 3. Complex training protocol.
Note.
= 1 repetition of CMJ; = 3-minute recovery; 15-second recovery was undertaken
between each CMJ.
Complex training protocol represented in repetition format for CMJ session.
Figure 4. Countermovement jump session.
Set 1 Set 2 Set 3 Set 4 Set 5 Set 6
Set 7 Set 8 Set 9 Set 10
Set 1 Set 2 Set 3 Set 4 Set 5 Set 6 Set 7 Set 8 Set 9 Set 10
Note. = 1 repetition of back squat; = 1 repetition of CMJ; = 3-minute recovery; 15-second recovery was undertaken between each CMJ.
Complex Training Protocol represented in repetition format for the LL (65% 1- RM back squat) and HL ( 85% 1-RM back squat) with 3-minute recovery prior to completing 3 CMJs.
Figure 3. Complex training protocol. Note.= 1 repetition of back squat; = 1 repetition of CMJ; = 3-minute recovery; 15-second recovery was undertaken between each CMJ.
Complex Training Protocol represented in repetition format for the LL (65% 1- RM back squat) and HL ( 85% 1-RM back squat) with 3-minute recovery prior to completing 3 CMJs.
Figure 3. Complex training protocol.
Note. = 1 repetition of CMJ; = 3-minute recovery; 15-second recovery was undertaken between each CMJ.
Complex training protocol represented in repetition format for CMJ session.
Figure 4. Countermovement jump session.
Set 1 Set 2 Set 3 Set 4 Set 5 Set 6
Set 7 Set 8 Set 9 Set 10
Set 1 Set 2 Set 3 Set 4 Set 5 Set 6 Set 7 Set 8 Set 9 Set 10
Note.= 1 repetition of back squat; = 1 repetition of CMJ; = 3-minute recovery; 15-second recovery was undertaken between each CMJ.
Complex Training Protocol represented in repetition format for the LL (65% 1- RM back squat) and HL ( 85% 1-RM back squat) with 3-minute recovery prior to completing 3 CMJs.
Figure 3. Complex training protocol.
Note. = 1 repetition of CMJ; = 3-minute recovery; 15-second recovery was undertaken between each CMJ.
Complex training protocol represented in repetition format for CMJ session.
Figure 4. Countermovement jump session.
Set 1 Set 2 Set 3 Set 4 Set 5 Set 6
Set 7 Set 8 Set 9 Set 10
Poulos, N. et al.: COMPLEX TRAINING AND COUNTERMOVEMENT JUMP...
79 Kinesiology 50(2018) Suppl.1:75-89
ment AG, Winterthur, Switzerland) at a sampling rate of 500 Hz. Athletes performed CMJs according to the protocol described by previous researchers (Chaouachi, et al., 2011). Athletes were required to keep their hands on their hips throughout the entire jump to minimize lateral and horizontal
displace-ment and prevent any infl uence of arm movedisplace-ments
on jump performance while minimizing coordina-tion as a confounding variable in the assessment of the leg extensor neuromuscular performance (Cha-ouachi, et al., 2009). Countermovement depth was self-selected by the subjects and they were asked to jump as high as possible (Cormack, Newton, & McGuigan, 2008).
Raw data from the vertical component of the ground reaction force (N) was extracted and select-ed parameters analyzselect-ed using custom made soft-ware (Force Plate Data Analyzer, Copyright ©
As-pire 2010 Version 1.2.1.0). Force data were fi ltered using a fourth-order low pass Butterworth fi lter
with a 28-Hz cutoff frequency.
Session descriptions
High load (HL) session with a 3-minute intra-complex recovery. Athletes performed three repeti-tions of the back squat at 87% 1-RM followed by a rest period of three minutes before completing three CMJs separated by a 15-second rest between each repetition on the force platform. This was repeated for a total of 10 sets with a 3-minute recovery be-tween each set. The premise of selecting a 3-minute intra-complex and inter-set recovery period was to provide a realistic time-frame for the use of complex training in the practical setting based on a multi-set protocol or training session while remaining con-sistent with recent research investigating the use of complex training conducted over multiple sets (An-drews, et al., 2011). Rest intervals of 2-5 minutes have been previously recommended when training for strength and power (Haff & Triplett, 2016) while increases in CMJ height have previously been dem-onstrated following heavy load back squat using a rest interval of three minutes (Rixon, et al., 2007).
Light load (LL) session with a 3-minute
intra-complex recovery. Athletes performed fi ve
repeti-tions of the back squat at 65% 1-RM followed by a rest period of three minutes before completing three CMJs on the force platform. This was
repeat-ed for a total of 10 sets with a 3-minute recovery between each set.
Countermovement jump session. Athletes per-formed 10 x sets of three CMJs on the force plat-form separated by a rest period of three minutes between each set.
Statistical analysis
Data in text and tables are presented as means ± standard deviations (SD). Relative changes (%) in performance are expressed with 90% CI (90%
con-fi dence intervals). All data were log-transformed
prior to the analysis to reduce bias arising from the non-uniformity error.
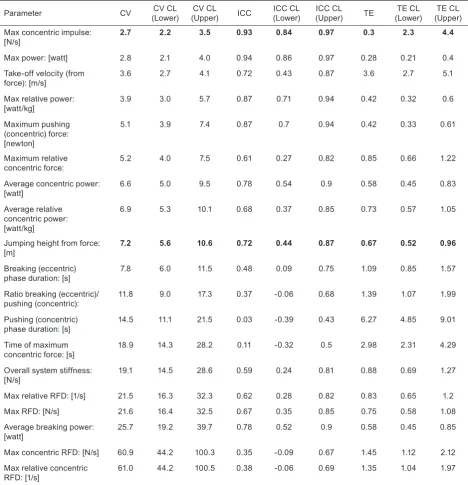
As a preliminary step, we wished to establish the most reliable and sensitive parameters derived from CMJs. The reliability of each parameter ob-tained from the Quattro Jump was established from the baseline measurements in each testing session (Table 1). Three trials were analyzed for each pa-rameter using the Hopkins method (Hopkins, 2009) to derive typical errors (TE) expressed as both the
percentage of coeffi cient of variation (CV) and the
standardized one (based on Cohen’s approach). We therefore selected the most reliable parameter for further analysis based on the standardized TE, i.e., maximum concentric impulse (N·s), and jump height (cm) because it is still the most reported measure in the CMJ literature (Chiu, et al, 2004; Duthie, et al., 2002; Gourgoulis, et al., 2003; Jensen & Ebben, 2003; Ruben, et al., 2010; Tillin & Bishop, 2009). The majority of the most reliable parameters (e.g., maximum power, maximal concentric power) were demonstrated similar responses and, for clar-ity and conciseness, in this investigation we chose to focus our attention on these two parameters (jump height and maximum concentric impulse).
To examine the effect of intensity of back squat load on performance (jump only, 65% 1-RM, 87% 1-RM) across 10 sets of the heavy load back squat – CMJ complex pair, average values were calculated to obtain a single value for each subject of each se-lected parameter. The difference in performance in each parameter between the three conditions (jump only, 65% 1-RM, 87% 1-RM) were expressed as the standardized mean differences (Cohen’s d). The cri-teria used to interpret the magnitude of Cohen’s d
were: ≤ 0.2 trivial, > 0.2-0.6 small, > 0.6-1.2
mod-Note.
= 1 repetition of back squat; = 1 repetition of CMJ; = 3-minute recovery; 15-second
recovery was undertaken between each CMJ.
Complex Training Protocol represented in repetition format for the LL (65% 1- RM back squat)
and HL ( 85% 1-RM back squat) with 3-minute recovery prior to completing 3 CMJs.
Figure 3. Complex training protocol.
Note.
= 1 repetition of CMJ; = 3-minute recovery; 15-second recovery was undertaken
between each CMJ.
Complex training protocol represented in repetition format for CMJ session.
Figure 4. Countermovement jump session.
Set 1 Set 2 Set 3 Set 4 Set 5 Set 6
Set 7 Set 8 Set 9 Set 10
Set 1 Set 2 Set 3 Set 4 Set 5 Set 6 Set 7 Set 8 Set 9 Set 10
Note. = 1 repetition of CMJ; = 3-minute recovery; 15-second recovery was undertaken between each CMJ. Complex training protocol represented in repetition format for CMJ session.
Figure 4. Countermovement jump session.
Note.= 1 repetition of back squat; = 1 repetition of CMJ; = 3-minute recovery; 15-second recovery was undertaken between each CMJ.
Complex Training Protocol represented in repetition format for the LL (65% 1- RM back squat) and HL ( 85% 1-RM back squat) with 3-minute recovery prior to completing 3 CMJs.
Figure 3. Complex training protocol.
Note. = 1 repetition of CMJ; = 3-minute recovery; 15-second recovery was undertaken between each CMJ.
Complex training protocol represented in repetition format for CMJ session.
Figure 4. Countermovement jump session.
Set 1 Set 2 Set 3 Set 4 Set 5 Set 6
Set 7 Set 8 Set 9 Set 10
Set 1 Set 2 Set 3 Set 4 Set 5 Set 6 Set 7 Set 8 Set 9 Set 10
Note.= 1 repetition of back squat; = 1 repetition of CMJ; = 3-minute recovery; 15-second recovery was undertaken between each CMJ.
Complex Training Protocol represented in repetition format for the LL (65% 1- RM back squat) and HL ( 85% 1-RM back squat) with 3-minute recovery prior to completing 3 CMJs.
Figure 3. Complex training protocol.
Note. = 1 repetition of CMJ; = 3-minute recovery; 15-second recovery was undertaken between each CMJ.
Complex training protocol represented in repetition format for CMJ session.
Figure 4. Countermovement jump session.
Set 1 Set 2 Set 3 Set 4 Set 5 Set 6
Set 7 Set 8 Set 9 Set 10
Poulos, N. et al.: COMPLEX TRAINING AND COUNTERMOVEMENT JUMP...
80
Kinesiology 50(2018) Suppl.1:75-89
erate, >1.2 large (Hopkins, et al, 2009). In addi-tion, data were also assessed for practical mean-ingfulness using an approach based on magnitude of change (Batterham & Hopkins, 2006; Hopkins, et al., 2009). An assessment of the chances that the (true) performance values were greater (i.e., greater than the smallest practically important effect, or the smallest worthwhile change, SWC [0.2 multiplied by the between-subject standard deviation, based on the Cohen’s principle (Cohen, 1988)]), was un-dertaken. Quantitative chances of higher or small-er psmall-erformance responses across the 10 sets wsmall-ere assessed qualitatively as follows: <1%, almost
cer-tainly not; 1-5%, very unlikely; >5- 25%, unlike-ly; >25-75%, possible; >75-95%, likeunlike-ly; >95-99%, very likely; >99%, almost certain (Hopkins, et al,
2009). If the chance of having beneficial/better or detrimental/poorer performances were both >5%,
the true difference was assessed as unclear (Hop-kins, et al., 2009).
To examine individual responses to the inten-sity of back squat load (jump only, 65% 1-RM, 87% 1-RM) subjects were divided into groups (respond-ers or non-respond(respond-ers) based on their responses compared with jump only.
Table 1. Reliability of specific parameters of countermovement jump performance (n = 15)
Parameter CV (Lower)CV CL (Upper)CV CL ICC (Lower)ICC CL (Upper)ICC CL TE (Lower)TE CL (Upper)TE CL
Max concentric impulse:
[N/s] 2.7 2.2 3.5 0.93 0.84 0.97 0.3 2.3 4.4
Max power: [watt] 2.8 2.1 4.0 0.94 0.86 0.97 0.28 0.21 0.4
Take-off velocity (from
force): [m/s] 3.6 2.7 4.1 0.72 0.43 0.87 3.6 2.7 5.1
Max relative power:
[watt/kg] 3.9 3.0 5.7 0.87 0.71 0.94 0.42 0.32 0.6
Maximum pushing (concentric) force: [newton]
5.1 3.9 7.4 0.87 0.7 0.94 0.42 0.33 0.61
Maximum relative
concentric force: 5.2 4.0 7.5 0.61 0.27 0.82 0.85 0.66 1.22
Average concentric power:
[watt] 6.6 5.0 9.5 0.78 0.54 0.9 0.58 0.45 0.83
Average relative concentric power: [watt/kg]
6.9 5.3 10.1 0.68 0.37 0.85 0.73 0.57 1.05
Jumping height from force:
[m] 7.2 5.6 10.6 0.72 0.44 0.87 0.67 0.52 0.96
Breaking (eccentric)
phase duration: [s] 7.8 6.0 11.5 0.48 0.09 0.75 1.09 0.85 1.57
Ratio breaking (eccentric)/
pushing (concentric): 11.8 9.0 17.3 0.37 -0.06 0.68 1.39 1.07 1.99
Pushing (concentric)
phase duration: [s] 14.5 11.1 21.5 0.03 -0.39 0.43 6.27 4.85 9.01
Time of maximum
concentric force: [s] 18.9 14.3 28.2 0.11 -0.32 0.5 2.98 2.31 4.29
Overall system stiffness:
[N/s] 19.1 14.5 28.6 0.59 0.24 0.81 0.88 0.69 1.27
Max relative RFD: [1/s] 21.5 16.3 32.3 0.62 0.28 0.82 0.83 0.65 1.2
Max RFD: [N/s] 21.6 16.4 32.5 0.67 0.35 0.85 0.75 0.58 1.08
Average breaking power:
[watt] 25.7 19.2 39.7 0.78 0.52 0.9 0.58 0.45 0.85
Max concentric RFD: [N/s] 60.9 44.2 100.3 0.35 -0.09 0.67 1.45 1.12 2.12
Max relative concentric
RFD: [1/s] 61.0 44.2 100.5 0.38 -0.06 0.69 1.35 1.04 1.97
Poulos, N. et al.: COMPLEX TRAINING AND COUNTERMOVEMENT JUMP...
81 Kinesiology 50(2018) Suppl.1:75-89
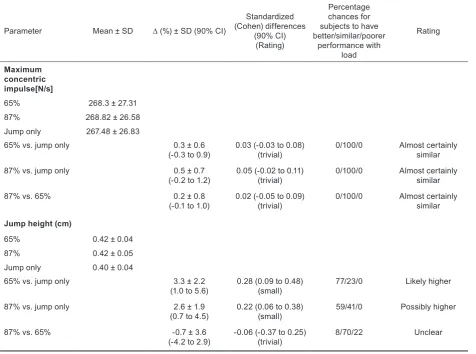
Table 2. Effect of a heavy back squat intensity on CMJ performance (n = 15)
Parameter Mean ± SD ∆ (%) ± SD (90% CI)
Standardized (Cohen) differences
(90% CI) (Rating)
Percentage chances for subjects to have better/similar/poorer
performance with load
Rating
Maximum concentric impulse[N/s]
65% 268.3 ± 27.31
87% 268.82 ± 26.58
Jump only 267.48 ± 26.83
65% vs. jump only 0.3 ± 0.6
(-0.3 to 0.9) 0.03 (-0.03 to 0.08)(trivial) 0/100/0 Almost certainly similar
87% vs. jump only 0.5 ± 0.7
(-0.2 to 1.2) 0.05 (-0.02 to 0.11)(trivial) 0/100/0 Almost certainly similar
87% vs. 65% 0.2 ± 0.8
(-0.1 to 1.0) 0.02 (-0.05 to 0.09)(trivial) 0/100/0 Almost certainly similar Jump height (cm)
65% 0.42 ± 0.04
87% 0.42 ± 0.05
Jump only 0.40 ± 0.04
65% vs. jump only 3.3 ± 2.2
(1.0 to 5.6) 0.28 (0.09 to 0.48)(small) 77/23/0 Likely higher
87% vs. jump only 2.6 ± 1.9
(0.7 to 4.5) 0.22 (0.06 to 0.38)(small) 59/41/0 Possibly higher
87% vs. 65% -0.7 ± 3.6
(-4.2 to 2.9) -0.06 (-0.37 to 0.25)(trivial) 8/70/22 Unclear
Note. CI = confidence interval; SD = standard deviation; n = number of subjects; ES = effect size (qualitative outcome, see “Methods” for thresholds used); Intensity = jumps only, 65%, or 87% 1-RM.
Groups were divided into non-responders (both intensities = jump only), responders to either 65% 1-RM (65% > jump) or to 87% 1-RM (87% > jump), for each parameter. A cut-off point of half the CV for each parameter was utilized as deter-mining the smallest worthwhile response in perfor-mance for either condition (jump only, 65% 1-RM or 87% 1-RM). This cut-off value of half of a CV has been suggested as being important for detect-ing the smallest worthwhile performance enhance-ment in athletes, irrespective of the level of group homogeneity (Hopkins, Hawley, & Burke, 1999). Relative or absolute strength of each group (non-responders, responders to 65% 1-RM, or responders to 87% 1-RM) were then compared, using the same magnitude-based analysis as for between-condition comparisons as described above.
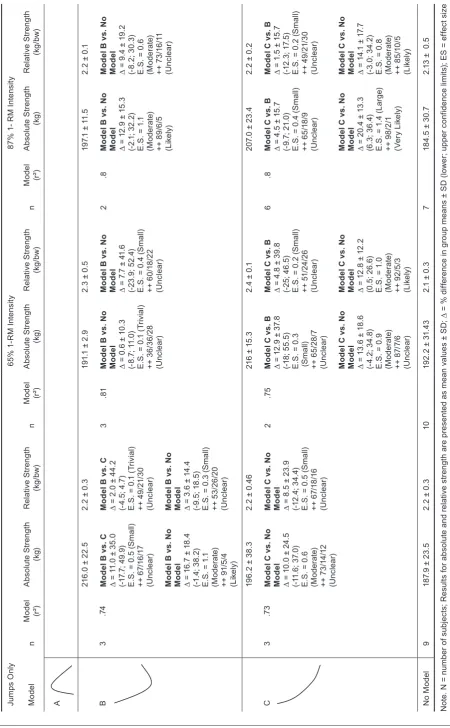
To examine the effect of the intensity of back squat load on potential fatigue development, the time course of performance across the 10 sets was established with the changes in the selected param-eters modeled using 3-polynomial functions when appropriate. Model A was used to describe perfor-mance changes following a bell shape formation, model B presented as a decrease initially followed
by an increase in later sets, while model C presented a decrease across all 10 sets.). Each athlete, for each condition, was then allocated into families based on their individual responses (A, B, C, or no model). Each time course was allocated to either model A, B
or C based on best fit and r² values. If an individual time course did not fit either model based on best fit and/or r² value (r² <0.7), they were allocated to
the group ‘no model’. As above, relative and abso-lute strengths of the distinct groups were compared.
Results
Poulos, N. et al.: COMPLEX TRAINING AND COUNTERMOVEMENT JUMP...
82
Kinesiology 50(2018) Suppl.1:75-89
Following investigation of responders vs. non-responders to load (number of athletes is presented in Table 3), results indicated that the subjects with a greater relative strength possessed a very likely chance of improvement in both jump height and maximum concentric impulse when performing 10 sets of a squat – CMJ complex training protocol using an intensity of 87% 1-RM compared to non-responders (Table 3). In addition, the athletes with a greater relative strength were able to also improve maximum concentric impulse performance across the 10 sets of complex training utilizing an intensity of 65% 1-RM heavy back squat as the conditioning stimulus when compared to non-responders.
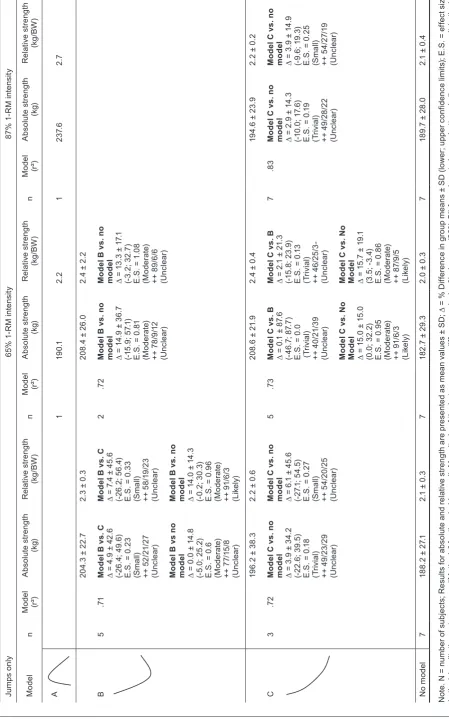
Finally, individual performance modelling (Ta-bles 4 and 5) across 10 sets of either jumps only or a complex pair involving back squat (65% or 87% 1-RM) and CMJs, utilizing the protocols provided, indicated the highly individual responses of each athlete. Some athletes exhibited a bell-shaped curve across the 10 sets (model A), while others dem-onstrated a decrease followed by a late increase in latter sets (model B). Alternatively, several ath-letes’ performance measures could be modelled as a direct decrease in performance across the 10 sets (model C). However, the majority of athletes could
not be modelled based on either fit and/or r² values
although it did appear that athletes with a greater absolute and relative strength were more likely to
be modelled as opposed to the athletes who were weaker.
Discussion and conclusions
To our knowledge, this is the first study to in
-vestigate the possible PAP benefit using a specific
CT protocol varying in load intensity over multi-ple sets of a training session in elite male
volley-ball players. The main findings of this study were
as follows:
(1) When examining the effect of the intensity of back squat load on performance across 10 sets of a complex pair, mean jump height was enhanced irrespective of the load intensity used (65% 1-RM: +3.3 ± 2.2% [CI: 1.0 to 5.6]; 87% 1-RM: +2.6 ± 1.9% [CI: 0.7 to 4.5]). Interestingly however, for the vari-able maximum concentric impulse, it appears that utilizing either intensity provided similar perfor-mance outcomes to performing CMJs only across 10 sets (65% 1-RM: +0.3 ± 0.6% [CI: -0.3 to 0.9]; 87% 1-RM: +0.5 ± 0.7% [CI: -0.2 to 1.2]). These results highlight the specificity of the effect of the current complex protocol, which likely affects jump height but not concentric impulse, suggesting some
alterations in movement efficiency/strategy (Cabre -ra, Morales, Greer, & Pettitt, 2009).
(2) When examining responders vs. non-re-sponders to load, the subjects with a greater rela-tive strength possessed a very likely large chance
Table 3. Responders vs. non-responders to load
Maximum concentric impulse Jump height
n strength (kg)Absolute Relative strength
(kg/BW) n
Absolute strength (kg)
Relative strength (kg/BW)
Non-Responders 2 178.2 ± 22.91 1.87± 0.11 5 187.7 ± 32.3 2.0 ± 0.3
Responders 65% only 7 189.9 ± 27.12 2.15 ± 0.35 6 187.6 ± 14.4 2.2 ± 0.4
Responders 87% only 5 203.04 ± 27.96 2.30 ± 0.29 4 216 ± 29.3 2.4 ± 0.2
Responders to both (65% and 87%) 1 226.8 2.39
65% vs. non-responders % difference (90% CI) Effect size (rating)
% Chances for 65% values to have
better/similar/poorer results Rating 65% vs. non-responders
6.0 ± 97.1 (-46.2; 109.0)
0.34 (Small) 57/16/27
Unclear
14.0 ± 16.1 (-1.8; 32.4)
0.95 (Moderate)
89/7/4
Likely
0.9 ± 19.0 (-15.2; 20.1) 0.06 (Trivial)
40/27/33
Unclear
8.3 ± 17.4 (-7.8; 27.1) 0.51 (Small)
70/18/12
Unclear
87% vs. non-responders % difference (90% CI) Effect size (Rating)
% chances for 87% values to have
better/similar/poorer results Rating 87% vs. non-responders
13.6 ± 100.0 (-43.2; 127.1)
0.73 (Moderate)
72/9/19
Unclear
22.4 ± 15.7 (5.7; 41.7) 1.76 (Large)
97/1/2
Very likely
15.7 ± 23.4 (-6.3; 42.7)
0.79 (Moderate)
82/11/7
Unclear
21.5 ± 15.6 (5.1; 40.4) 1.51 (Large)
97/2/1
Poulos, N. et al.: COMPLEX TRAINING AND COUNTERMOVEMENT JUMP...
83 Kinesiology 50(2018) Suppl.1:75-89
Ta bl e 4 . T im e co ur se m od
el – m
ax im um c on ce nt ri c i m pu ls e N ot e. N = n um be r o f s ub je ct s; R es ul ts fo r a bs ol ut e a nd re lat iv e st re ng th a re p re se nt ed a s m ea n va lu es ± S D ; ∆ = % d iff er en ce in g ro up m ea ns ± S D (l ow er ; u pp er c onf id en ce li m its ); ES = e ffe ct s iz e (ra tin g) ( qu al ita tiv e o ut co m e, s ee “ M et ho ds ” f or t hr es ho ld s u se d) ; M ag ni tu de o f t he b et w ee n g ro up d iff er en ce s ( ++
) = % c
ha nc es ( 90 % C I) f or v al ue s t o h av
e a b
et te r, s im ila r o r p oo re r r es ul t ( ra tin g). Ju mps O nl y 65 % 1 -R M In ten si ty 87 % 1 - R M I nt en si ty M ode l n M od el (r² ) A bs ol ut e S tre ng th (k g) R el at iv e S tre ng th (k g/ bw) n M od el (r² ) A bs ol ut e S tre ng th (k g) R el at iv e S tre ng th (k g/ bw) n M od el (r² ) A bs ol ut e S tre ng th (k g) R el at iv e S tre ng th (k g/ bw) A B 3 .74 21 6.
0 ± 2
2.
5
M
od
el B v
s. C
∆ = 1
1.
0 ± 3
5. 0 (-1 7. 7; 4 9. 9) E.
S. = 0
.5 ( Sm al l) ++ 6 7/1 6/1 7 (U nc le ar) M od
el B v
s. N
o
M
od
el
∆ = 1
6.
7 ± 1
8. 4 (-1 .4 ; 3 8. 2) E.
S. = 1
.1 (M od er at e) ++ 9 1/ 5/ 4 (L ik ely ) 2.
2 ± 0
.3
M
od
el B v
s. C
∆ = 2
.0 ± 4
4. 2 (-4. 5; 4. 7) E.
S. = 0
.1 ( Tr iv ia l) ++ 4 9/ 21/ 30 (U nc le ar) M od
el B v
s. N
o
M
od
el
∆ = 3
.6 ± 1
4. 4 (-9. 5; 1 8. 5) E.
S. = 0
.3 ( Sm al l) ++ 5 3/2 6/2 0 (U nc le ar) 3 .81 19 1.
1 ± 2
.9
M
od
el B v
s. N
o
M
od
el
∆ = 0
.6 ± 1
0. 3 (-8.7 ; 1 1. 0) E.
S. = 0
.1 ( Tr iv ia l) ++ 3 6/ 36/2 8 (U nc le ar) 2.
3 ± 0
.5
M
od
el B v
s. N
o
M
od
el
∆ = 7
.7 ± 4
1. 6 (-2 3. 9; 52 .4 ) E.
S. = 0
.4 ( Sm al l) ++ 6 0/ 18 /2 2 (U nc le ar) 2 .8 19
7.1 ± 1
1.
5
M
od
el B v
s. N
o
M
od
el
∆ = 1
2.
9 ± 1
5. 3 (-2. 1; 3 2. 2) E.
S. = 1
.1 (M od er at e) ++ 8 9/6 /5 (L ik ely ) 2.
2 ± 0
.1
M
od
el B v
s. N
o
M
od
el
∆ = 9
.4 ± 1
9. 2 (-8. 2; 3 0. 3) E.
S. = 0
.6 (M od er at e) ++ 7 3/1 6/1 1 (U nc le ar) C 3 .7 3 19 6.
2 ± 3
8.
3
M
od
el C v
s. N
o
M
od
el
∆ = 1
0.
0 ± 2
4. 5 (-1 1. 6; 3 7. 0) E.
S. = 0
.6 (M od er at e) ++ 7 3/1 4/1 2 (U nc le ar) 2.
2 ± 0
.4
6
M
od
el C v
s. N
o
M
od
el
∆ = 8
.5 ± 2
3. 9 (-1 2.4 ; 3 4.4 ) E.
S. = 0
.5 ( Sm al l) ++ 6 7/1 8/1 6 (U nc le ar) 2 .7 5 21
6 ± 1
5.
3
M
od
el C v
s. B
∆ = 1
2.
9 ± 3
7. 8 (-1 8; 5 5. 5) E.
S. = 0
.3 (S m al l) ++ 6 5/ 28 /7 (U nc le ar) M od
el C v
s. N
o
M
od
el
∆ = 1
3.
6 ± 1
8. 6 (-4. 2; 3 4. 8) E.
S. = 0
.9 (M od er at e) ++ 8 7/ 7/ 6 (U nc le ar) 2.
4 ± 0
.1
M
od
el C v
s. B
∆ = 4
.8 ± 3
9. 8 (-2 5; 4 6. 5) E.
S. = 0
.2 ( Sm al l) ++ 5 1/2 4/2 6 (U nc le ar) M od
el C v
s. N
o
M
od
el
∆ = 1
2.
8 ± 1
2. 2 (0 .5 ; 2 6. 6) E.
S. = 1
.0 (M od er at e) ++ 9 2/ 5/ 3 (L ik ely ) 6 .8 20 7. 0 ± 23. 4 M od
el C v
s. B
∆ = 4
.5 ± 1
5. 7 (-9.7 ; 2 1. 0) E.
S. = 0
.4 ( Sm al l) ++ 6 5/ 18 /9 (U nc le ar) M od
el C v
s. N
o
M
od
el
∆ = 2
0.
4 ± 1
3. 3 (6. 3; 3 6. 4) E.
S. = 1
.4 ( La rg e) ++ 9 8/ 2/1 (V er y L ik ely ) 2.
2 ± 0
.2
M
od
el C v
s. B
∆ = 1
.5 ± 1
5. 7 (-1 2. 3; 1 7. 5) E.
S. = 0
.2 ( Sm al l) ++ 4 9/ 21/ 30 (U nc le ar) M od
el C v
s. N
o
M
od
el
∆ = 1
4.
1 ± 1
7. 7 (-3 .0 ; 3 4. 2) E.
S. = 0
.8 (M od er at e) ++ 8 5/ 10 /5 (L ik ely ) N o M od el 9 18 7.
9 ± 2
3.
5
2.
2 ± 0
.3
10
19
2.
2 ± 3
1.
43
2.
1 ± 0
.3
7
18
4.
5 ± 3
0.
7
2.
13 ± 0
.5
Tab
le
4
. T
ime
co
ur
se
mo
de
l –
ma
xi
mum
co
nce
nt
ric i
m
pul
se
Jum ps O nl y 65% 1 -R M I nt en sit y 87% 1 - R M I nt en sit y M odel n M
odel (r²)
Abs ol ut e S tr eng th (k g) Rel at iv e S tr eng th (k g/ bw ) n M
odel (r²)
Abs ol ut e St reng th (k g) Rel at iv e S tr eng th (k g/ bw ) n M
odel (r²)
Abs ol ut e Stre ng th (kg ) Rel at iv e S tr eng th (k g/ bw )
A B
3 .74 216. 0 ± 22. 5 M od el B vs . C ∆ = 11. 0 ± 35. 0 (-17. 7; 49. 9) E.S . = 0 .5 (S mal l) ++ 67/ 16/ 17 (Un cle ar) M od el B vs . No M od el ∆ = 16. 7 ± 18. 4 (-1. 4; 38. 2) E.S . = 1 .1 (M oder at e) ++ 91/ 5/ 4 (L ike ly ) 2. 2 ± 0. 3 M od el B vs . C ∆ = 2. 0 ± 44. 2 (-4. 5; 4. 7) E.S . = 0 .1 (T rivi al ) ++ 49/ 21/ 30 (Un cle ar) M od el B vs . No M od el ∆ = 3. 6 ± 14. 4 (-9. 5; 18. 5) E.S . = 0 .3 (S mal l) ++ 53/ 26/ 20 (Un cle ar) 3 .81 191. 1 ± 2. 9 M od el B vs . No M od el ∆ = 0. 6 ± 10. 3 (-8. 7; 11. 0) E.S . = 0 .1 (T rivi al ) ++ 36/ 36/ 28 (Un cle ar) 2. 3 ± 0. 5 M od el B vs . No M od el ∆ = 7. 7 ± 41. 6 (-23. 9; 52. 4) E.S . = 0 .4 (S mal l) ++ 60/ 18/ 22 (Un cle ar) 2 .8 197. 1 ± 11. 5 M od el B vs . No M od el ∆ = 12. 9 ± 15. 3 (-2. 1; 32. 2) E.S . = 1 .1 (M oder at e) ++ 89/ 6/ 5 (L ike ly ) 2. 2 ± 0. 1 M od el B vs . No M od el ∆ = 9. 4 ± 19. 2 (-8. 2; 30. 3) E.S . = 0 .6 (M oder at e) ++ 73/ 16/ 11 (Un cle ar)
Tab
le
4
. T
ime
co
ur
se
mo
de
l –
ma
xi
mum
co
nce
nt
ric i
m
pul
se
Jum ps O nl y 65% 1 -R M I nt en sit y 87% 1 - R M I nt en sit y M odel n M
odel (r²)
Abs ol ut e S tr eng th (k g) Rel at iv e S tr eng th (k g/ bw ) n M
odel (r²)
Abs ol ut e St reng th (k g) Rel at iv e S tr eng th (k g/ bw ) n M
odel (r²)
Abs ol ut e Stre ng th (kg ) Rel at iv e S tr eng th (k g/ bw )
A B
Poulos, N. et al.: COMPLEX TRAINING AND COUNTERMOVEMENT JUMP...
84
Kinesiology 50(2018) Suppl.1:75-89
Ta bl e 5 . T im e c ou rs e m od
el – j
um p h ei gh t N ot e. N = n um be r o f s ub je ct s; R es ul ts fo r a bs ol ut e an d re la tiv e st re ng th a re p re se nt ed a s m ea n va lu es ± S D ; ∆ = % D iff er en ce in g ro up m ea ns ± S D (l ow er ; u pp er c on fid en ce li m its ); E. S. = e ffe ct s iz e (ra tin g) ( qu al ita tiv e o ut co m e, s ee “ M et ho ds ” f or t hr es ho ld s u se d) ; M ag ni tu de o f t he b et w ee n g ro up d iff er en ce s ( ++
) = % c
ha nc es ( 90 % C I) f or v al ue s t o h av
e a b
et te r, s im ila r o r p oo re r r es ul t ( ra tin g). Ju mps o nl y 65 % 1 -R M i nt en si ty 87 % 1 -R M i nt en si ty M ode l n M od el (r² ) A bs ol ut e s tre ng th (k g) R el at iv e s tre ng th (kg /B W ) n M od el (r² ) A bs ol ut e s tre ng th (k g) R el at iv e s tre ng th (kg /B W ) n M od el (r² ) A bs ol ut e s tre ng th (k g) R el at iv e s tre ng th (kg /B W ) A 1 19 0.1 2. 2 1 23 7. 6 2.7 B 5 .71 20 4.
3 ± 2
2.
7
M
od
el B v
s. C
∆ = 4
.9 ± 4
2. 6 (-26 .4 ; 49 .6 ) E.
S. = 0
.2 3 (S m al l) ++ 5 2/2 1/2 7 (U nc le ar) M od
el B v
s n
o
m
od
el
∆ = 0
.0 ± 1
4. 8 (-5. 0; 2 5. 2) E.
S. = 0
.6 (M od er at e) ++ 77 /1 5/ 8 (U nc le ar) 2.
3 ± 0
.3
M
od
el B v
s. C
∆ = 7
.4 ± 4
5. 6 (-2 6. 2; 5 6. 4) E.
S. = 0
.3 3 (S m al l) ++ 5 8/ 19 /2 3 (U nc le ar) M od
el B v
s. n
o
m
od
el
∆ = 1
4.
0 ± 1
4. 3 (-0. 2; 3 0. 3) E.
S. = 0
.9 6 (M od er at e) ++ 9 1/ 6/ 3 (L ik ely ) 2 .7 2 20 8.
4 ± 2
6.
0
M
od
el B v
s. n
o
m
od
el
∆ = 1
4.
9 ± 3
6. 7 (-1 5. 9; 57 .1 ) E.
S. = 0
.8 1 (M od er at e) ++ 7 8/9/ 12 (U nc le ar) 2.
4 ± 2
.2
M
od
el B v
s. n
o
m
od
el
∆ = 1
3.
3 ± 1
7.1 (-3 .2 ; 3 2. 7) E.
S. = 1
.0 8 (M od er at e) ++ 8 9/6 /6 (U nc le ar) C 3 .7 2 19 6.
2 ± 3
8.
3
M
od
el C v
s. n
o
m
od
el
∆ = 3
.9 ± 3
4. 2 (-2 2. 6; 3 9. 5) E.
S. = 0
.1 8 (Tr iv ia l) ++ 4 9/2 3/2 9 (U nc le ar) 2.
2 ± 0
.6
M
od
el C v
s. n
o
m
od
el
∆ = 6
.1 ± 4
5. 6 (-2 7.1 ; 5 4. 5) E.
S. = 0
.2 7 (S m al l) ++ 5 4/2 0/2 5 (U nc le ar) 5 .7 3 20 8.
6 ± 2
1.
9
M
od
el C v
s. B
∆ = 0
.1 ± 8
7. 6 (-46 .7 ; 8 7.7 ) E.
S. = 0
.0 (Tr iv ia l) ++ 4 0/ 21 /3 9 (U nc le ar) M od
el C v
s. N
o
M
od
el
∆ = 1
5.
0 ± 1
5. 0 (0 .0 ; 3 2. 2) E.
S. = 0
.9 5 (M od er at e) ++ 9 1/ 6/ 3 (L ik ely ) 2.
4 ± 0
.4
M
od
el C v
s. B
∆ = 2
.1 ± 2
1. 3 (-1 5. 8; 2 3. 9) E.
S. = 0
.1 3 (Tr iv ia l) ++ 4 6/2 5/ 3-(U nc le ar) M od
el C v
s. N
o
M
od
el
∆ = 1
5.
7 ± 1
9. 1 (3. 5; -3. 4) E.
S. = 0
.8 6 (M od er at e) ++ 8 7/9/ 5 (L ik ely ) 7 .8 3 19 4.
6 ± 2
3.
9
M
od
el C v
s. n
o
m
od
el
∆ = 2
.9 ± 1
4. 3 (-1 0. 0; 1 7. 6) E.
S. = 0
.1 9 (Tr iv ia l) ++ 4 9/2 8/2 2 (U nc le ar) 2.
2 ± 0
.2
M
od
el C v
s. n
o
m
od
el
∆ = 3
.9 ± 1
4. 9 (-9. 6; 1 9. 3) E.
S. = 0
.2 5 (S m al l) ++ 5 4/2 7/ 19 (U nc le ar) N o m od el 7 18 8.
2 ± 2
7.1
2.
1 ± 0
.3
7
18
2.
7 ± 2
9.
3
2.
0 ± 0
.3
7
18
9.
7 ± 2
8.
0
2.
1 ± 0
.4
Tab
le
4
. T
ime
co
ur
se
mo
de
l –
ma
xi
mum
co
nce
nt
ric i
m
pul
se
Jum ps O nl y 65% 1 -R M I nt en sit y 87% 1 - R M I nt en sit y M odel n M
odel (r²)
Abs ol ut e S tr eng th (k g) Rel at iv e S tr eng th (k g/ bw ) n M
odel (r²)
Abs ol ut e St reng th (k g) Rel at iv e S tr eng th (k g/ bw ) n M
odel (r²)
Abs ol ut e Stre ng th (kg ) Rel at iv e S tr eng th (k g/ bw )
A B
3 .74 216. 0 ± 22. 5 M od el B vs . C ∆ = 11. 0 ± 35. 0 (-17. 7; 49. 9) E.S . = 0 .5 (S mal l) ++ 67/ 16/ 17 (Un cle ar) M od el B vs . No M od el ∆ = 16. 7 ± 18. 4 (-1. 4; 38. 2) E.S . = 1 .1 (M oder at e) ++ 91/ 5/ 4 (L ike ly ) 2. 2 ± 0. 3 M od el B vs . C ∆ = 2. 0 ± 44. 2 (-4. 5; 4. 7) E.S . = 0 .1 (T rivi al ) ++ 49/ 21/ 30 (Un cle ar) M od el B vs . No M od el ∆ = 3. 6 ± 14. 4 (-9. 5; 18. 5) E.S . = 0 .3 (S mal l) ++ 53/ 26/ 20 (Un cle ar) 3 .81 191. 1 ± 2. 9 M od el B vs . No M od el ∆ = 0. 6 ± 10. 3 (-8. 7; 11. 0) E.S . = 0 .1 (T rivi al ) ++ 36/ 36/ 28 (Un cle ar) 2. 3 ± 0. 5 M od el B vs . No M od el ∆ = 7. 7 ± 41. 6 (-23. 9; 52. 4) E.S . = 0 .4 (S mal l) ++ 60/ 18/ 22 (Un cle ar) 2 .8 197. 1 ± 11. 5 M od el B vs . No M od el ∆ = 12. 9 ± 15. 3 (-2. 1; 32. 2) E.S . = 1 .1 (M oder at e) ++ 89/ 6/ 5 (L ike ly ) 2. 2 ± 0. 1 M od el B vs . No M od el ∆ = 9. 4 ± 19. 2 (-8. 2; 30. 3) E.S . = 0 .6 (M oder at e) ++ 73/ 16/ 11 (Un cle ar)
Tab
le
4
. T
ime
co
ur
se
mo
de
l –
ma
xi
mum
co
nce
nt
ric i
m
pul
se
Jum ps O nl y 65% 1 -R M I nt en sit y 87% 1 - R M I nt en sit y M odel n M
odel (r²)
Abs ol ut e S tr eng th (k g) Rel at iv e S tr eng th (k g/ bw ) n M
odel (r²)
Abs ol ut e St reng th (k g) Rel at iv e S tr eng th (k g/ bw ) n M
odel (r²)
Abs ol ut e Stre ng th (kg ) Rel at iv e S tr eng th (k g/ bw )
A B
Poulos, N. et al.: COMPLEX TRAINING AND COUNTERMOVEMENT JUMP...
85 Kinesiology 50(2018) Suppl.1:75-89
2009). Tillin and Bishop (2009) suggested that fol-lowing a conditioning stimulus, an optimal recov-ery time is required to diminish fatigue and realize a PAP effect. However, evidence is inconsistent in support of this theory due to the variety of protocols used in the PAP and CT literature. The magnitude of fatigue and PAP responses, generated by the con-ditioning stimulus, may also directly be related to the strength level of athletes. Seitz and Haff (2016) have suggested that the time course of a PAP ef-fect appears to be dictated by a strength level with stronger individuals expressing the greatest PAP re-sponse 5-7 min following a conditioning stimulus, while weaker individuals achieve a maximal PAP response after at least 8 min of recovery.
While globally we have found that CMJ perfor-mance using the current CT protocol was enhanced across the 10 sets using either intensity (65% 1-RM or 87% 1-RM) compared to performing only CMJs,
it is unknown whether similar benefits could be real -ized using shorter or longer intra- complex recovery periods or higher or lower intensities. In addition, there is an absence of research literature reporting the cumulative effect of performing multiple, alter-nating sets of dynamic MVCs (e.g., heavy load back squats) and plyometric activity (e.g., CMJs), typi-cal of CT practices in an applied setting in terms of the intricate balance between fatigue and any po-tential PAP effect. We found, however, that it was almost certain that similar CMJ performance out-comes were obtained in maximum concentric im-pulse whether the athletes were exposed to load or performed only CMJs. As our athletes were elite volleyball players, jump height is a crucial factor in overall performance in the sport. Impulse is the product of force and the time during which the force is imparted also described as the product of an ob-ject’s mass and a change in its velocity (Koziris, 2012). Kirby, Mcbride, Haines and Dayne (2011) re-cently examined the effect of different squat depths on relative net vertical impulse, jump height, peak force and peak power, during the concentric phase of the body weight CMJs and static jumps (SJ’s). The researchers found that in both jumps, a great-er squat depth produced a greatgreat-er relative net vgreat-er- ver-tical impulse (impulse applied above body weight and expressed per kilogram of body mass), greater peak velocity and greater jump height. Correlations also suggested that relative net vertical impulse was a strong predictor of jump height in both types of jumps regardless of jump height (Kirby et al., 2011;
Koziris, 2012). Concentric impulse by definition is
the area under the force time curve from the point of maximum displacement (zero velocity) to the instant of takeoff. Given that similar performance outcomes were presented globally across the 10 sets of CT compared with performing CMJs only irre-spective of intensity, it may be suggested that the
PAP effect influenced the entire movement (eccen -of improvement in jump height when CMJs were
performed across 10 sets of a squat – CMJ CT pro-tocol using an intensity of 87% 1-RM compared to non-responders. However, this was unclear using an intensity of 65% 1-RM. Also, the subjects with a greater relative strength possessed a likely moderate or very likely large chance of improvement in maxi-mum concentric impulse during CMJs performed across 10 sets of a squat – CMJ CT protocol using an intensity of 65% and 87% 1-RM, respectively, compared to non-responders
(3) The individual modelling of jump perfor-mance across the 10 sets of CT revealed the high-ly individual responses of each athlete. It appears that a time course for performance is more likely to be established in the athletes with a greater ab-solute or relative strength although the majority of the athletes in our investigation did not conform to any model applied.
Effect of intensity on global performance
The present study investigated performance outcomes during CT across multiple sets, which is typical of an applied training session in elite male athletes. While several studies have found increases in CMJ height following heavy load back squats, no study has investigated the performance outcomes of undertaking a complex pair of exercises involving a conditioning stimulus (e.g., heavy load back squats) and plyometric activity (e.g., CMJs) over multiple sets in elite athletes using different load intensities.
Our findings demonstrated that mean jump height
might be enhanced across 10 sets of CT using the protocol prescribed in elite male volleyball players irrespective of the load used in our investigation (65% 1-RM or 87% 1-RM back squat). In contrast, Andrews et al. (2011) found a 2.0 cm (3.7%) de-crease in CMJ performance across three sets of CT involving 75% 1-RM back squat coupled with CMJs as a complex pair in college-aged female athletes. It
is difficult to compare the results of Andrews et al.
Poulos, N. et al.: COMPLEX TRAINING AND COUNTERMOVEMENT JUMP...
86
Kinesiology 50(2018) Suppl.1:75-89
tric and concentric phases) and there was less of an effect on the maximum concentric impulse. While not investigated in our study, it may be suggested
that the CT protocol utilized influenced eccentric
mechanisms and potentially had acute effects on changing muscle-tendon architecture. Reardon et al. (2014) were unable to demonstrate a PAP response using a moderate intensity (MI) (75% 1-RM) back squat protocol involving 3 sets x 10 repetitions or a high intensity (HI) (90% 1-RM) protocol involving 3 sets x 3 repetitions on CMJ performance using a similar intra-complex recovery period of three minutes in resistance trained men. However, mus-cle architecture responses appeared to be sensitive to the different CT protocols with the MI protocol demonstrating to have the greatest effect of muscle cross sectional area and pinnation angle in the rec-tus femoris and vasrec-tus lateralis. It is recommended that further research investigates the PAP effect in the eccentric phase and associated potential acute changes in muscle-tendon architecture.
Responders versus non-responders
While acknowledging that analysis of respond-ers vrespond-ersus non-respondrespond-ers may have limitations due to a low number of subjects, the present results may be used as a starting point toward understanding in-dividual responses to CT. Importantly however, the statistical analysis utilized is well suited for
quan-tifying the magnitude of differences in the specific
variables between groups of small sample size. The hypothetical model of the relationship between PAP and fatigue following a pre-conditioning contrac-tion protocol, as previously presented by Tillin and Bishop (2009), suggests that when conditioning vol-ume is low, PAP is more dominant than fatigue and the PAP effect in subsequent performance may be realized immediately (window 1). As the condition-ing volume increases, fatigue becomes dominant, negatively effecting subsequent performance. Fol-lowing the conditioning contraction, fatigue dissi-pates at a faster rate than PAP and a potentiation of subsequent performance may be realized at some point during the recovery period (window 2). It ap-pears that the intricate balance between fatigue and any PAP effect is highlighted in the individual re-sponses to the CT protocol provided in our study. As suggested by Weber et al. (2008), one char-acteristic that seems to promote PAP to the greatest extent includes greater relative strength of the in-dividual (Duthie, et al., 2002). The female athletes in the Andrews et al. (2011) investigation exhibited a substantially lower relative strength in the back squat (relative strength: 1.49 ± 0.30 BW) than those in our study, which may have been a contributing factor to the performance decrement observed. The athletes in our study demonstrated higher absolute and relative lower body strength results following 1-RM back squat assessment (absolute strength:
189.22 ± 27.53 kg; relative strength: 2.14 ± 0.35 BW). Despite the variations in protocols in CT lit-erature, it appears that initial strength levels are
one of many individual characteristics influencing
a possible acute PAP effect on subsequent perfor-mance following a conditioning stimulus (Chiu, et al., 2003; Duthie, et al., 2002; Gourgoulis, et al., 2003; Ruben, et al., 2010). It also appears that ini-tial strength levels of our subjects may be a con-tributing factor to the observed increases in mean jump height performance (Table 2) across 10 sets of a complex pairing of heavy load squats and CMJs. While we chose to investigate acute performance response across multiple sets, our results are con-sistent with previous research investigating CMJ re-sponses to heavy load back squat (Esformes, et al., 2010; Gourgoulis, et al., 2003; Kilduff, et al., 2008; McCann & Flanagan, 2010; Mitchell & Sale, 2011; Rixon, et al., 2007; Smilios, et al., 2005; Young, et al., 1998) (e.g., 2.9% increase in CMJ height (Mitch-ell & Sale, 2011)). Gourgoulis et al. (2003) observed a 4% increase in jump height immediately
follow-ing five sets of back squats in subjects able to squat
> 160 kg, while Ruben et al. (2010) found that
in-dividuals who could squat ≥ 2.0 BW produced a significantly greater PAP effect than weaker indi -viduals (<1.7 BW).
As supported by Seitz et al. (2016) and Crewther et al. (2011), the responses found in our study may be explained by the fact that stronger individuals develop fatigue resistance to heavier loads (Chiu, et al., 2003; Jo, Judelson, Brown, Coburn, & Dabbs, 2010; Parry, 2008) after near or maximal efforts (Chiu, et al., 2003; Parry, 2008). The stronger ath-letes (> 2.2 BW) in our investigation may have ex-pressed fatigue resistance to heavier loads and dis-sipated fatigue earlier following each set of the CT protocol outlined. While it is unknown how the balance between any PAP effect and fatigue mani-fested itself across multiple alternating sets of the CT protocol prescribed, it certainly appears that the stronger individuals in our study were able to exhibit a PAP response across 10 alternating sets
of our specific CT protocol.
As supported by a number of researchers (Crewther, et al., 2011; Hamada, et al., 2000; Parry, 2008; Tillin & Bishop, 2009), another explanation for individual responders in our study may be that stronger individuals displayed elevated mysosin light chain phosphorylation and tend to have
larg-er and stronglarg-er type II muscle fibres (Hamada, et al,
2000; Tillin & Bishop, 2009). Furthermore, type II