ABSTRACT
Manuscript type: Research paper
Research aims: This study examines firms’ adherence to the pecking order in deficit and surplus situations by comparing firms in India and China. It also examines the extent of debt issues and redemption when the deficits and surpluses are relatively large in amount.
Design/Methodology/Approach: This study analyses the data of the Bombay Stock Exchange (BSE) 500 index and the Shanghai Stock Exchange (SSE) 380 index firms. It uses Ordinary Least Square (OLS) regression to examine the effect of deficit and surplus on debt issuance and redemption.
Research findings: The findings indicate that deficit firms in India as well as China adhere to the pecking order by issuing large amounts of debt. The debt issues (short-term debt) are exceptionally higher among Chinese firms whereas Indian firms issue more long-term debts. In addition, Chinese firms prefer to utilise new funds to redeem the existing debts because most of their debts are short term whereas Indian firms use a major chunk of their proceeds to finance deficits. Chinese surplus firms do not retain sizeable funds, an overwhelming proportion of these funds is used to redeem their existing short-term debts. In contrast, Indian surplus firms are
Adherence to the Pecking Order in Deficit
and Surplus Conditions: A Comparative
Study of Firms in India and China
Vandana Bhama*, P.K. Jain and Surendra S. Yadav
* Corresponding author: Vandana Bhama is an Assistant Professor of Finance at the Fortune Institute of International Business, Vasant Vihar, New Delhi, 110057, India. E-mail: vandana. [email protected] and [email protected]
P. K. Jain is an Emeritus Professor of Finance at the Department of Management Studies, Indian Institute of Technology, Hauz Khas, New Delhi, 110016, India. E-mail: [email protected]. ac.in
Surendra S. Yadav is a Professor of Finance at the Department of Management Studies, Indian Institute of Technology, Hauz Khas, New Delhi, 110016, India. E-mail: [email protected]
reluctant to retire debts at a fast pace because of the existing low debt to equity ratios. Indian firms also have more long-term debts in their capital structure.
Theoretical contribution/Originality: This study extends on previous works on the pecking order theory in developing countries by splitting the analysis into two: deficit firms and surplus firms.
Practitioner/Policy implications: This study provides insights into the financing practices of the two developing economies. It also high-lights the differences in corporate financing of these two countries. Research limitations/Implications: This study is confined to only Indian and Chinese firms. It mainly focusses on dataset that have been accumulated over a period of 12 years only. Future studies may consider adding the financing cost aspect so as to generate a more impressive analysis of firms’ adherence to the pecking order theory.
Keywords: Pecking Order Theory, Financing, Deficit, Surplus, Debt, Equity
JEL Classification: Q14, G32
1. Introduction
flow of surplus funds1, preference is given to retire debts (Myers, 2001; Serrasqueiro & Caetano, 2015). Therefore, the whole theory of pecking order revolves around debt issues and redemptions.
In view of the above, the first objective of the present study is to examine firms’ adherence to the pecking order by comparing firms in India and China during two conditions: deficit and surplus. This study is closely related to the work of Bhama, Jain and Yadav (2016) who focused on Indian firms in an earlier study. A reference on the pecking order theory recognises that majority of studies had been derived from those conducted in the context of developed economies (Shyam-Sunder & Myers, 1999; Frank & Goyal, 2003; Fama & French, 2005; Leary & Roberts, 2010; Jong, Verbeek, & Verwijmeren, 2010; Lemmon & Zender, 2010; Denis & Mckeon, 2012). It appears that literature detailing empirical evidences of the pecking order theory of emerging economies, from various aspects, is still lacking. Several studies examining the debt and equity structure across different countries stress the role of country-specific factors such as institutional frameworks and national culture, which are likely to differ across developed and emerging markets (Acedo-Ramírez & Ruiz-Cabestre, 2014; Belkhir, Maghyereh, & Awartani, 2016). Most of the firms in emerging markets still possess characteristics that distinguish them from the typical developed economy, which may prevent the generalisation of prior works on developed markets. As the two fastest growing economies in the world, both India and China clearly serve as good research grounds for researchers to investigate their respective financial systems. Undoubtedly, the financial system of both countries differ due to their diverse institutional structures. Therefore, it would be interesting to explore the extent to which firms from both economies adhere to the pecking order theory during deficit and surplus conditions. The theory focuses on internal financing, then debt and equity as a last choice. This study primarily focuses on internal financing and debt. Access to equity financing is limited in both countries.
The rationale to test the pecking order of deficit and surplus firms separately is motivated by the works of Shyam-Sunder and Myers (1999) and Jong, Verbeek and Verwijmeren (2010). Shyam-Sunder and Myers (1999), for instance, tested the pecking order theory by using
an empirical regression model for all the firms where the deficits/ surpluses were regressed on net debt issues. They found a common homogenous pecking order coefficient value. Following their work, Jong, Verbeek and Verwijmeren (2010) used a similar methodology of net debt issues to generate their results for deficit and surplus firms separately. The review of literature confirms several observations: (i) A common coefficient exhibits a distorted picture of the pecking order results, hence it is difficult to find the extent of a firm’s debt issuance during deficiency and the extent of a firm’s debt redemptions during surplus. (ii) The implications of the pecking order coefficient for deficit and surplus firms are different, hence focus should be given to debt issues during deficiency conditions and to debt redemptions during surplus conditions. In view of this, our study emphasises on gross debt issues during deficit conditions and on gross debt redemptions during surplus conditions.
The second objective of this study is to ascertain and compare the extent to which Indian and Chinese firms retire their existing debts in deficit situations and the extent to which they issue new debts during surplus situations. It has been noted that many Indian firms retire their existing debts during deficit conditions and they raise more debts during surplus conditions. Similarly, it has been observed that Chinese firms either redeem old debts substantially or they raise new debt proceeds which are significantly higher than the amount of their deficits and surpluses. Based on this, our study aims to examine if excessive debt issues are being used to retire existing debt during deficiency. We also aim to examine if the new debt proceeds are used to redeem debts or to retain funds for future investments and other needs during surplus conditions.
Since there is a literature gap in the comparative analysis of the financial system of emerging countries, it is hoped that the outcome generated from this study can contribute to filling this gap. To the best of the our knowledge, the current study is the first of its kind which examines and compares the new parameters of the extended model of the pecking order theory for firms in emerging economies during deficit and surplus conditions. The remainder of this paper is organised into five sections. Section 2 reviews the relevant literature. Section 3 describes the data and methodology. Section 4 discusses the empirical findings and Section 5 summarises and concludes the paper.
2. Review of Literature
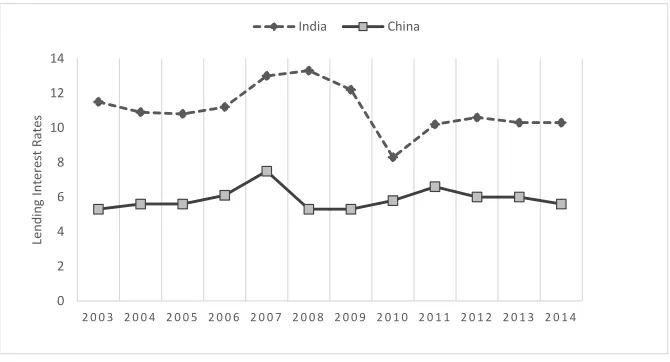
2.1 Debt and Equity Structure in the Financial Markets of India and China Since the 1990s, India and China have made significant efforts to expand their financial system. To begin with, the Indian financial system con-stitutes primarily of debt markets followed by a limited role of equity markets (Saggar, 2005). In previous years, the share of bond markets has been virtually less (Dawar, 2014). It was noted that corporate financing in India is mostly covered by debts in the form of borrowings from banks and financial institutions (Ganguli, 2013) but Rastogi, Jain and Yadav (2006) maintained that India’s debt financing profile has changed significantly over the years. Indian firms give more preference to short-term debts than long-short-term debts (Jain & Yadav, 2005; Jain, Singh, & Yadav, 2013). In contrast, Saggar (2005) asserted that Indian firms rely more on long-term debts to finance fixed investments than on short-term debts to finance short-term needs. It seems that there is homogeneity on the usage of long-term debts among Indian firms (Majumdar, 2010). Lending interest rates in the form of cost of debt financing is also high (8.3 to 13.3 per cent in Figure 1) in India.
Capital markets are not the primary drivers of economy in India (Didier & Schmukler, 2013), making the role of equity markets limited. However, equity markets are more developed than bond markets (Komera & Lukose, 2014). Large firms are the ones that raise funds from these markets. Thus far, share repurchasing is not yet a normal practice among Indian firms, unlike developed economies.
low interest rates ranging from 5.3 to 7.5 per cent (in Figure 1). During the period of study, capital markets were an insignificant source of financing in China (Didier & Schmukler, 2013). This was accentuated by the weak corporate bond market and its over-dominated banking industry (Pessarossi & Weill, 2013). In view of the above scenario, firms in China have only one primary source of debt, i.e., short-term debt. The reason is because Chinese firms employ less amount of long-term debts in their capital structure (Bhabra, Liu & Tirtiroglu, 2008). Due to a major reliance on a single source of debt, Chinese firms maintain low level debt ratios (Faulkender & Petersen, 2006; Fan, Titman, & Twite, 2012). Figure 1 illustrates.
As far as China’s unregulated capital markets are concerned, firms do not rely highly on equity financing. This is because these firms have greater reliance on debt funds (Tong, 2005; Fan, Rui, & Zhao, 2008). In China, there is a fixed quota for specific numbers of firms to go public. When firms become public in mainland China, they continue to face other regulatory barriers for raising funds through equity capital (Jiang & Kim, 2013). It is not surprising that firms more often than not issue equity because Chinese markets are highly unregulated. Equity issuance requires prior approval, which is subjected to quotas and other pre-requisites. As far as equity repurchasing is concerned, there is little evidence to highlight the role of equity buy-back in China, a practice that has only been allowed recently.
Figure 1: Lending Interest Rates of India and China, 2003-2014 0
2 4 6 8 10 12 14
2 0 0 3 2 0 0 4 2 0 0 5 2 0 0 6 2 0 0 7 2 0 0 8 2 0 0 9 2 0 1 0 2 0 1 1 2 0 1 2 2 0 1 3 2 0 1 4
Le
nd
in
g
In
te
re
st
Rate
s
2.2 The Pecking Order Theory and the Need for Extension
For the first time, Shyam-Sunder and Myers (1999) provided the statis-tical power of the pecking order model to assess financing hierarchy through regression equations. This model states that firm’s financing deficit should match dollar for dollar by a change in the firm’s debt. Chirinko and Singha (2000) questioned the regression test of the pecking order model developed by Shyam-Sunder and Myers (1999). They maintained that simple tests generate misleading inferences while evaluating the plausible patterns of external financing. They then confirmed that the pecking order coefficient value can be lower than one, even if firms followed the financing hierarchy as prescribed by the pecking order theory. The rationale is that during large deficits, firms might be constrained into issuing more debts. These firms have to finance the remainder of their deficits with equity issues. Such constraints are painfully higher for firms with high leverage ratios. Therefore, alternative tests that can identify various capital structure determinants are needed. This can also be seen in Adedeji’s (1998) criticism who places doubt on firms’ motivation to raise funds externally when experiencing deficiency in their internal funds.
Bontempi (2002) proposed a ‘modified pecking order model’ in which both the trade-off and pecking order models are fitted. The modified pecking order follows when firms adhere to the guidelines of both the pecking order and the trade-off theory. It is difficult for firms to strictly adhere to a single theory. Pure pecking order model and pure trade-off model do not work well. Vasiliou, Eriotis, and Daskalakis (2009) suggested that researchers should carefully shape the pecking order theory as the methodology can be misleading. Their findings revealed that the negative relation between leverage and profitability could not be taken to mean that the pecking order financing hierarchy persists. They claimed that analysis should not rest solely on the mean of the oriented regression results when testing the pecking order theory, hereby referred to as distinct hierarchy.
2.3 Mixed Evidence on the Pecking Order Theory
issues do not have any significant relationship with deficits. Frank and Goyal (2003) as well as Fama and French (2005) noted that net equity issues tracked the financing deficits more closely than the net debt issues. Leary & Robert (2010) further observed that only 20 per cent of firms adhere to the pecking order theory.
Extending the pecking order model by splitting firms into deficit and surplus groups, Jong, Verbeek and Verwijmeren (2010) were of the view that net debt issues provide an excellent fit for surpluses (0.90), which is a reasonable fit for small and medium deficits (0.74). However, it was an extremely poor fit for large deficits (0.09). Observing the pecking order behaviour in emerging economies, Seifert and Gonence (2009) stressed that firms in these economies mainly financed their deficits with equity issues.
Didier and Schmukler (2013) noted that capital markets are not a significant source of financing deficits in India and China. From the perspective of India, Dutta (2013), Komera and Lukose (2014), and Chaklader and Chawla (2016) disagreed that Indian firms follow the pecking order theory. Both the pecking order theory and the trade-off theory jointly explain Indian firm’s financing decisions (Chakraborty, 2010; Majumdar, 2010).
Looking at China, Tong and Green (2005) and Chong, Law and Zou (2012) supported the pecking order theory due to China’s over dominated bank financing. In contrast, Ni and Yu (2008) observed that there was no evidence to support the pecking order theory among Chinese firms. Others (Feng & Cui 2007) found that the capital structure of Chinese firms was more in tune with their trade-offs. Chen (2004) and Zou and Xiao (2006) noted that the Chinese firms follow a “new pecking order” which includes retained earnings, equity and long-term debts. The pecking order theory and the trade-off theory are not mutually exclusive among Chinese firms (Yue, 2011).
3. Data and Methodology
Bhama et al., 2016) for India while China does not have any financial firms on the SSE index. We further excluded firms with missing values of any variable, either in cash flow statement or balance sheet. Firms with at least one year of data availability were included in our study as the deficits and surpluses have been calculated each year and were independent of the values of other years. In total, 405 Indian firms and 312 Chinese firms have data availability. Initially, we split the firms as deficit and surplus firms (using a conceptual framework mentioned below) for each year as per the equation below, Equation (1).
SURt = Ct – It (1)
where,
SURt = Positive or negative surplus in year t;
Ct = Net cash from operating activities (adjusted) of firm i in
year t;
It = Net capital investments of firm i in year t;
In Equation (1), the positive value indicates surplus with a firm (referred as surplus firms), whereas, negative value denotes fund deficits (referred as deficit firms). These deficits and surplus values were calculated for each year. They are independent from the values
of another year. Our approach aims to test2 this theory in deficit
and surplus conditions by using gross debt issues and gross debt redemptions. As both the models (pecking order and trade-off) do not work well (Bontempi, 2002), there was a need to remodel the pecking order theory because researchers have mentioned that previous methodology provided misleading inferences (Vasiliou et al., 2009).
The division of firms (deficit and surplus) would provide a better picture of firms’ financing decisions in both situations. Equity issues and repurchases have been ignored in the regression equations in both
situations due to negligible values. They had been tested by Bhama et al. (2016) who used net debt issues. Their results were weak in comparison to the results noted by Jong et al. (2010). Nonetheless, their results were in tune with previous findings of the Indian and Chinese contexts. Due to these fragile results, we thus changed the approach for testing the pecking order theory by using gross debt issues and redemptions in this paper.
3.1 Pecking Order Tests of Deficit and Surplus Firms
Deficit Situation
The pecking order theory suggests the issuing of debt first, during deficiency (Myers, 2001). For testing the same in our study, the following equation was formulated:
DIit = α + βpoDEFit + it (2)
where, DIit is the gross debt issued by firm i in year t, βpo is the pecking
order coefficient of deficit firms, DEFit is the actual deficit (negative
surplus) of firm i in year t, εit is the error term.
Surplus Situation
For estimating firm’s propensity to redeem debt from available surplus funds, the following equation is used:
DRit = α + βpoSURit + εit (3)
where, DRit is the debt redemption by firm i in year t, βpo is the pecking
order coefficient of surplus firms, SURit is the surplus of firm i in year t,
and εit is the error term.
3.2 Pecking Order Model – The Extension
on debt issues and the availability of surplus and new debt issues on debt redemptions through Equations 4 and 5. Regressing total fund requirement on gross debt issues is a better measure as it explains how deficit firms are able to redeem the existing debts even when they are in need of more funds. Likewise, in the case of surplus firms, adding new debt issues in surpluses indicates the extent to which firms redeem the existing debts by using new debt proceeds together with the existing surpluses. This is to examine firms’ further debt issues and redemptions in deficit and surplus conditions.
Deficit Situation
During deficiency, firm’s total funding requirements3 (deficit +
redemp-tion of existing debt) are regressed on debt issues by considering the following model:
DIit = α + βpoTFRit + εit (4)
where, DIit is the gross debt issued by firm i in year t, βpo is the pecking
order coefficient of deficit firms, TFRit is the total funds required (deficit
+ debt redemption) for firm i in year t, and εit is the error term.
Surplus Situation
In this context, the results are based on surpluses and debt funds (surplus + issue of new debt) during surplus conditions. We employed the following model:
DRit = α + βpoSDFit + εit (5)
where, DRit is the debt redemption by firm i in year t, βpo is the pecking
order coefficient of surplus firms, SDFit is the availability of surplus and
debt funds (surplus + issue of new debt) for firm i in year t, and εit is the
error term.
Ordinary Least Square (OLS) regression was used to derive the co-efficient values. The mean value of debt equity ratios was also calculated for understanding firms’ pecking order, at varying levels of debts.
3 Ideally, equity buy back should be added to calculate the value of total funding requirements
4. Results
Table 1 compares the percentage of deficit and surplus firms from India and China, for the period 2003-2014. The analysis indicates that the percentage of Indian deficit firms varied from 43 to 68. The percentage of Chinese deficit firms varied from 55 to 74. It is evident from the statistics that the percentage of firms having fund deficiency is relatively more in the case of China. As far as surplus firms are concerned, the percentage of Indian firms varied from 32 to 57 per cent whereas the Chinese firms varied from 25 to 45 per cent, indicating that the percentage of firms having surpluses were relatively more in the case of India.
Table 1: Percentage of Deficit and Surplus Firms
Deficit Firms Surplus Firms
% of Indian % of Chinese % of Indian % of Chinese Firms Firms Firms Firms
2003 42.73 61.37 57.27 38.63
2004 49.79 62.08 50.21 37.92
2005 51.97 69.20 48.03 30.80
2006 62.21 69.80 37.79 30.20
2007 66.15 67.61 33.85 32.39
2008 68.48 59.77 31.52 40.23
2009 60.27 60.23 39.73 39.77
2010 53.44 55.08 46.56 44.92
2011 60.48 66.54 39.52 33.46
2012 63.08 74.70 36.92 25.30
2013 56.67 62.31 43.33 37.69
2014 59.22 61.62 40.78 38.38
Note: The table reports the percentage of Indian and Chinese firms having deficits and surpluses each year.
Year
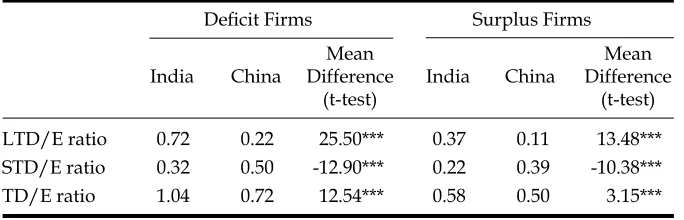
far as the composition of the total debt is concerned, the TD/E ratio is satisfactory for Indian and Chinese firms in both conditions (the ratios are 1.04 and 0.72 in deficit conditions and 0.58 and 0.50 in surplus conditions). This outcome is indicative of the fact that firms in India as well as China, follow the outlines of trade-off theory by keeping their debt ratios in safe zones (Feng & Cui, 2007).
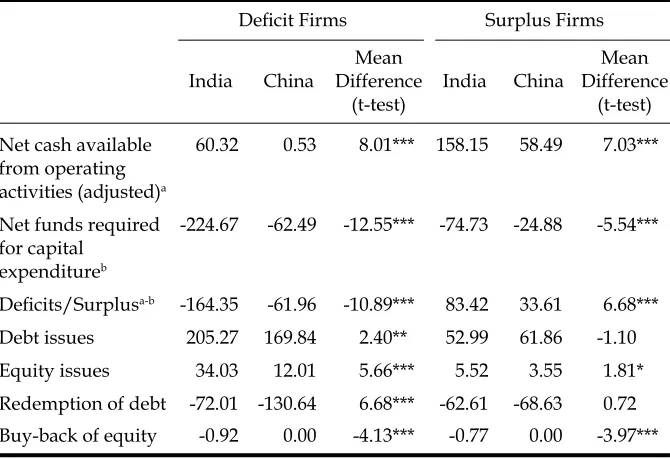
Table 3 compares the mean value of pecking order variables of firms in India and China in both conditions. From the mean values noted, it seems evident that there are statistical differences for the deficit firms from India and China. Although the percentage of Chinese deficit firms was more (as indicated in Table 1), the deficit amount was significantly higher among the Indian firms (164.35 USD millions) as compared to Chinese firms (61.96 USD millions). While the fund deficiency in Indian firms was attributable to the requirement of financing their huge capital investment (224.67 USD millions) needs (Bhama et al., 2016), the fund deficiency of Chinese firms was due to the negligible cash flows accruing from operating activities (Poncet et al., 2010).
It was observed that the new debt issues were exceptionally large in amount among the Chinese deficit firms (thrice the amount of their deficits). This is because firms inevitably retire their existing short-term debts due for redemption so as to keep their debt ratios low (Faulkender & Petersen 2006; Fan et al., 2012). In contrast, the debt redemptions were of lower amount for the Indian deficit firms. With most of the debts being long-term, the firms liked to redeem debts at the time of maturity (Bhama, Jain & Yadav, 2017). Although the equity issues were modest in sum, equity buy-backs were almost zero for both countries.
Table 2: Mean Values of Debt Ratios
Deficit Firms Surplus Firms
Mean Mean
India China Difference India China Difference
(t-test) (t-test)
LTD/E ratio 0.72 0.22 25.50*** 0.37 0.11 13.48***
STD/E ratio 0.32 0.50 -12.90*** 0.22 0.39 -10.38***
TD/E ratio 1.04 0.72 12.54*** 0.58 0.50 3.15***
Looking at the surplus firms, it can be seen that the surplus amount for firms in India was significantly more. This is because of the large amounts of cash flow acquired from operating activities and the relatively lower capital expenditures in Indian firms. Despite surplus availability, the Indian firms, in general, compensated debts with low amounts. Indian firms retained an overwhelming portion of surpluses and new debt issues for future use so as to avoid the high cost of debt financing. In contrast, Chinese firms redeemed debts that were twice the amount of their surpluses. The redemption of such magnitude was possible due to the new debt proceeds. In operational terms, the new debts generally replace the existing short-term debts.
Table 3: Mean Differences between Firms in India and China
Deficit Firms Surplus Firms
Mean Mean
India China Difference India China Difference
(t-test) (t-test)
Net cash available 60.32 0.53 8.01*** 158.15 58.49 7.03*** from operating
activities (adjusted)a
Net funds required -224.67 -62.49 -12.55*** -74.73 -24.88 -5.54*** for capital
expenditureb
Deficits/Surplusa-b -164.35 -61.96 -10.89*** 83.42 33.61 6.68***
Debt issues 205.27 169.84 2.40** 52.99 61.86 -1.10
Equity issues 34.03 12.01 5.66*** 5.52 3.55 1.81*
Redemption of debt -72.01 -130.64 6.68*** -62.61 -68.63 0.72 Buy-back of equity -0.92 0.00 -4.13*** -0.77 0.00 -3.97***
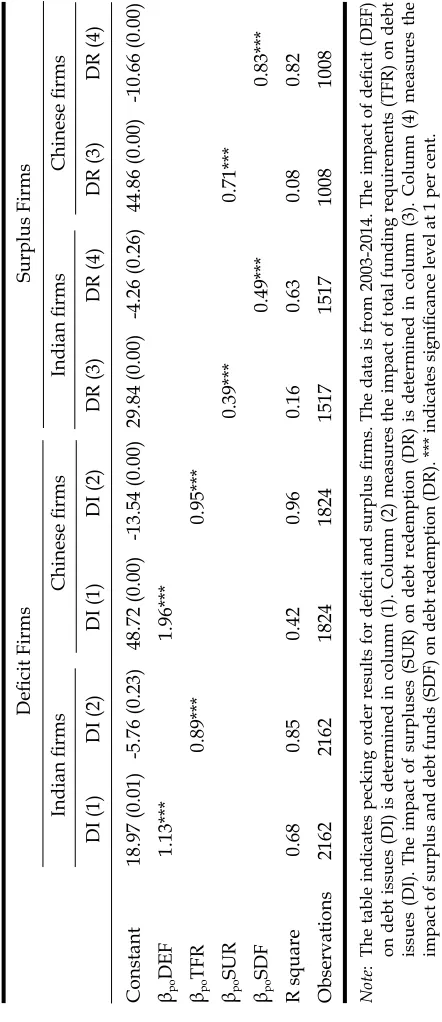
Comparing the coefficient values of the pecking order test of firms in India and China, it was observed that the deficit firms in both countries issued large amount of debts during deficiency condition, as presented in Table 4. The coefficient values (in column 1) were 1.13 and 1.96 for Indian and Chinese firms, respectively. Accordingly, the pecking order behaviour to a marked extent, existed among the deficit firms. The debt issues were substantially large among Chinese firms owing to their heavy reliance on borrowings, in the form of short-term debts (on account of low interest rates) in their capital structure. In contrast, the cost of debt financing in India is relatively high during the period of study. Therefore, Indian firms raised debts to the extent of their deficiencies. Despite debt issues, firms in both countries restricted themselves to keeping their debts in safe limits (Table 2), indicating the adherence to the trade-off theory.
When looking at surplus conditions, the results appeared to be different for both sets of firms. firms. The coefficient value (in column 3) is robust for Chinese firms (0.71) and Indian firms (0.39). Accordingly, Chinese firms use the overwhelming portion of surpluses to retire debt owing to the short time span of most of their debts (to avoid the credit risk). In contrast, Indian firms retained most of their surpluses because they already have low debt ratios in surplus conditions.
Further, by regressing surpluses and new debt issues on debt redemption, marginal improvements were observed in the coefficient values (Column 4). This proves that Indian firms redeem debt to a partial extent while considering the surpluses and new debt issues. In comparison, Chinese firms made most use of their funds to retire the existing debt. Therefore, it can be concluded that pecking order adherence is strong for Chinese surplus firms in comparison to Indian surplus firms.
Table 4: Pecking Order Tests of Deficit and Surplus Firms Deficit Firms Surplus Firms Indian firms Chinese firms Indian firms Chinese firms DI (1) DI (2) DI (1) DI (2) DR (3) DR (4) DR (3) DR (4) Constant 18.97 (0.01) -5.76 (0.23) 48.72 (0.00) -13.54 (0.00) 29.84 (0.00) -4.26 (0.26) 44.86 (0.00) -10.66 (0.00) βpo DEF 1.13*** 1.96*** βpo TFR 0.89*** 0.95*** βpo SUR 0.39*** 0.71*** βpo SDF 0.49*** 0.83*** R square 0.68 0.85 0.42 0.96 0.16 0.63 0.08 0.82 Observations 2162 2162 1824 1824 1517 1517 1008 1008 Note : The table indicates pecking order results for deficit and surplus firms. The data is from 2003-2014. The impact of deficit (DEF) on debt issues (DI) is determined in column (1). Column (2) measures the impact of total funding requirements (TFR) on debt issues (DI). The impact of surpluses (SUR) on debt redemption (DR) is determined in column (3). Column (4) measures the
Firms with Different Levels of Deficit and Surpluses
Table 5 indicates the mean value of debt equity ratio of Indian and Chinese firms with varying levels of deficits and surpluses. The table reports that Indian firms have different deficit levels. Generally, they borrow more from the long-term debt sources. For instance, firms with large or very large deficits have relatively high LTD/E ratio (0.75 and 1.11). Owing to the large portions of finances emerging from the
long-Table 5: Debt Equity Ratios of Firms with Various Levels of Deficits and Surpluses
Deficit Firms Surplus Firms
Mean Mean
India China Difference India China Difference
(t-test) (t-test)
Long-Term Debt to Equity Ratio
Firms with small 0.45 0.15 9.85*** 0.45 0.14 -7.64*** deficits/surpluses
Firms with medium 0.59 0.17 -12.91*** 0.43 0.12 7.00*** deficits/surpluses
Firms with large 0.75 0.23 14.31*** 0.32 0.08 -7.57*** deficits/surpluses
Firms with very large 1.11 0.32 15.61*** 0.24 0.07 4.98*** deficits/surpluses
Short-Term Debt to Equity Ratio
Firms with small 0.30 0.47 -5.89*** 0.28 0.41 4.24*** deficits/surpluses
Firms with medium 0.33 0.48 5.60*** 0.20 0.40 -6.81*** deficits/surpluses
Firms with large 0.32 0.53 -7.00*** 0.21 0.33 3.87*** deficits/surpluses
Firms with very large 0.33 0.51 -6.64*** 0.18 0.38 -5.32*** deficits/surpluses
Total Debt to Equity Ratio
Firms with small 0.75 0.62 3.07*** 0.73 0.55 -3.33*** deficits/surpluses
Firms with medium 0.92 0.65 -5.84*** 0.63 0.52 1.99** deficits/surpluses
Firms with large 1.07 0.75 6.36*** 0.53 0.42 -2.32** deficits/surpluses
Firms with very large 1.43 0.83 9.91*** 0.42 0.46 -0.64 deficits/surpluses
term debt sources, the TD/E ratio is near 1 for all deficit groups except firms with very large deficits (1.43). Contrary to this, Chinese firms employed comparatively more short-term debts in their capital structure (0.47 to 0.53) unlike Indian firms (0.30 to 0.33). Despite high deficiencies, the TD/E ratio of Chinese firms is not more than 1 for all deficit firms.
During surplus conditions, the mean value indicates that firms employed reasonably low debts in their capital structure as the level of surplus increases. Despite low debt ratios, Indian firms borrowed relatively more from the long-term debt sources (the LTD/E ratio is from 0.24 to 0.45); the ratio tends to decline as firms gain more surpluses. Thus, firms attempt to pay back the existing debt that may be expensive or is due for redemption. While the LTD/E ratio of Chinese firms was very low (0.07 to 0.14), their short-term debt financing was relatively higher than the Indian firms. The TD/E ratio was not more than 0.73 and 0.55 for the Indian and Chinese surplus groups.
Table 6 illustrates the comparison of the empirical evidence between Indian and Chinese firms with different deficit quantum. Here, it is noted that Indian firms with small and medium deficits issued debts which amounted to more than their deficits (coefficient values being 2.36 and 1.45). The findings supported the pecking order theory, which states that pecking order works better for firms without any debt capacity constraints (Komera & Lukose 2014). These firms issued new debts to pay back the existing debt which may be expensive or are due for repayment; (the coefficient values decline significantly from 2.36 to 1.09 for small deficits and 1.45 to 0.87 for medium deficits), or the firms may add funds if they expect a deficit in the future.
In contrast, Chinese firms with small and medium deficits, issued exceptionally high amount of debts that is more than their deficits (coefficient values being 5.54 and 5.28). The extraordinary size of the debt issues among these firms were typically based on two reasons. First, these firms have positive cash flows with low investment needs. This results in the low amount of deficiencies (Appendix A). Second, the existing debt ratios of these firms are in safe limits (Table 5). These firms utilised most of the new debt proceeds to compensate the existing debts because they were of shorter-tenure where the coefficient values declined significantly from 5.54 to 0.98 for firms with small deficits and from 5.28 to 1.03 for firms with medium deficits (column 2).
Table 6: Pecking Order Tests of Firms with Various Levels of Deficits
Indian Firms Chinese Firms
DI (1) DI (2) DI (1) DI (2)
Firms with Small Deficits
Constant 30.88 (0.00) 5.19 (0.29) 36.76 (0.00) -0.83 (0.66)
βpoDEF 2.36*** 5.54***
βpoTFR 1.09*** 0.98***
R2 0.43 0.83 0.18 0.96
Number of Observations 534 534 465 465
Firms with Medium Deficits
Constant -3.14 (0.59) 0.46 (0.92) -21.96 (0.05) -15.14 (0.00)
βpoDEF 1.45*** 5.28***
βpoTFR 0.87*** 1.02***
R2 0.56 0.69 0.51 0.96
Number of Observations 516 516 447 447
Firms with Large Deficits
Constant 10.01 (0.40) -11.63 (0.14) -35.68 (0.01) -17.99 (0.00)
βpoDEF 1.11*** 3.33***
βpoTFR 0.85*** 0.96***
R2 0.66 0.85 0.56 0.97
Number of Observations 532 532 442 442
Firms with Very Large Deficits
Constant -29.94 (0.06) -28.36 (0.01) 24.82 (0.04) -21.74 (0.00)
βpoDEF 1.09** 1.41***
βpoTFR 0.90*** 0.88***
R2 0.81 0.91 0.66 0.91
Number of observations 545 545 448 448
Note: The table indicates pecking order results of Indian and Chinese firms with different deficit levels. The data is from 2003-2014. Firms are sorted yearly into quartiles using scaling of deficits by total assets. The impact of deficit (DEF) on debt issues (DI) is determined in column (1). Column (2) measures the impact of total funding requirements (TFR) on debt issued (DI). *** indicates significance level at 1 per cent.
and very large deficit Indian firms, respectively, and 3.33 and 1.41 for Chinese large and very large deficit firms, respectively. Accordingly, firms with large amounts of deficiencies continue to raise more debts because their debt ratios are not significantly high (less than or equi-valent to 1 in Table 5). Indian firms with large amounts of deficiencies utilised most of their funds to finance deficits only; they utilise new debt issues to compensate the existing debts which are negligible (Appendix B). In comparison, Chinese firms with large amounts of deficiencies utilised new proceeds to retire the existing debts which were of shorter tenure. Firms with very large amounts of deficiencies, however, do not pay back the existing debts but instead, they issue new debts to finance their deficits.
The pecking order results of the small versus large surpluses are reported in Table 7. This study had expected a high coefficient value to retire the debt for firms with small and medium surpluses. This is due to the relatively large debts in their capital structure (Table 5) and the relatively weak coefficients for firms with large surpluses, on account of low debts to equity ratios.
The results indicated that the coefficient values for Indian firms with small and medium amounts of surpluses are 2.98 and 1.46 (column 1) respectively. Accordingly, these firms used their entire surpluses to reduce their debt levels; thereby indicating adherence to the pecking order. We further observed the reduced coefficient values of 0.72 and 0.69 for these firms (column 2) which corroborates with the fact that firms used surpluses as well as new debt issues up to a level of 72 and 69 percent (as the existing surpluses are not adequate to retire the entire debt). The remaining portion of new debt proceeds were retained by these firms. In comparison, the coefficient values were exceptionally high for Chinese firms with small (7.14) and medium surpluses (4.78). Accordingly, these firms redeemed more debts than their available surpluses, thereby indicating their adherence to the pecking order hypo-thesis. These excessive redemptions were reinforced by new debt issues as shown by the reduced coefficient values of 0.95 from 7.14 and 0.90 from 4.78 (in column 2). The retentions were negligible for these firms.
Table 7: Pecking Order Tests of Indian and Chinese Firms with Various Levels of Surpluses
Indian Firms Chinese Firms
DR (1) DR (2) DR (1) DR (2)
Firms with Small Surpluses
Constant 6.49 (0.17) 2.04 (0.48) 25.05 (0.00) -0.46 (0.82)
βpoSUR 2.98 *** 7.14***
βpoSDF 0.72*** 0.95***
R2 0.28 0.70 0.24 0.95
Number of Observations 377 377 258 258
Firms with Medium Surpluses
Constant 5.77 (0.52) -3.81 (0.41) -3.85 (0.78) -9.99 (0.00)
βpoSUR 1.46*** 4.78***
βpoSDF 0.69*** 0.90***
R2 0.38 0.82 0.29 0.96
Number of Observations 370 370 242 242
Firms with Large Surpluses
Constant 0.83 (0.94) -19.28 (0.00) 10.27 (0.08) -0.11 (0.98)
βpoSUR 0.70*** 0.97***
βpoSDF 0.59*** 0.59***
R2 0.26 0.78 0.23 0.60
Number of Observations 370 370 239 239
Firms with Very Large Surpluses
Constant 10.93 (0.08) 6.39 (0.29) 25.89 (0.00) 2.93 (0.54)
βpoSUR 0.21 *** 0.22***
βpoSDF 0.21*** 0.39***
R2 0.25 0.29 0.06 0.42
Number of Observations 373 373 248 248
Note: The table indicates pecking order results of Indian and Chinese firms with different surplus levels. The data is from 2003-2014. Firms are sorted yearly into quartiles using scaling of surpluses by total assets. The impact of surpluses (SUR) on debt redemption (DR) is determined in column (1). Column (2) measures the impact of surplus and debt funds (SDF) on debt redemption (DR). *** indicates significance level at 1 per cent.
5. Conclusion and Implication
The present study had examined and compared the pecking order results of Indian and Chinese firms, which had been segregated into deficit and surplus groups. The findings conveyed that Indian as well as Chinese firms issued large amounts of debts during an increase in deficiency, thereby indicating their adherence to the pecking order hypothesis. However, the debt issues were exceptionally higher than the deficits for China. This is because Chinese firms do not have adequate amounts of internal cash flows for financing their investment needs. Among external financing, it seems that equity and bond markets in China were inefficient due to their limited roles. Thus, Chinese firms only considered debts as a major source to finance their deficits. If we consider just the debt amounts, it can be said that the figures for the debts amounts in India were quite high.
Evidently, Chinese firms preferred more short-term debts in their capital structure because of their limited financing options and also the favourable interest rates offered by banks and institutions. In comparison, Indian firms generally kept more long-term debts in their capital structure. Despite large debt issues, Indian and Chinese firms kept themselves in safe zones (the debt equity ratio is near 1). Thus, both sets of firms, during deficit conditions, followed a ‘modified pecking order’, where both the pecking order and trade-off theory were adhered to. A major chunk of new debt proceeds was used to finance deficits only in the case of India, whereas, Chinese firms redeemed debts faster (using new debt proceeds) because of their short tenure.
In surplus conditions, adherence to the pecking order adherence was strong among Chinese firms but weak among Indian firms. Chinese firms necessarily compensated old debts (short-term debt) faster to avoid the credit risk. Chinese firms do not retain sizeable funds. The overwhelming proportion of these funds was more often utilised to compensate the existing debts. In contrast, Indian firms were reluctant to retire debts at a fast pace even during surplus conditions. This is because surplus firms typically have low debts to equity ratios. Second, due to more long-term debts in their capital structure, firms may prefer to redeem debts at the time of maturity. In that regard, they retained most of the funds for future investments to avoid the external financing costs.
defi-cits also adhered to the pecking order. The pecking order is robust for Chinese firms with different deficit levels and most of the new proceeds were used to retire the old debts. As far as the quantum of surpluses was involved, the results were robust for all surplus groups for firms India and China, except those with very large amounts of surpluses.
This study has implications for corporate managers. Managers in India should redeem more debts during surplus conditions whereas managers in China should opt for more long-term debts in their capital structure. This can help to reduce their high liquidity risks and to incorporate equity financing so as to balance their capital structure. From the bankers’ perspective, liquidity risks among Chinese firms should be assessed carefully while granting additional loans because these firms do not have significant reliance on other sources of financing such as long-term debts and equities.
The findings also contribute to the existing literature by distinguishing itself from previous studies. This has been achieved through the comparative analysis model used in the context of Indian and Chinese firms. This kind of comparison (with the extension of model) has not been performed so far in the literature.
Definitions
1. Net cash available from operating activities (adjusted)a = Net
cash from operating activities1 in year t (i.e. Earnings after taxes
+ Depreciation + Amortization + Other non-cash adjustments
+ Change in non-cash current assets2 + Change in operating
liabilities + Change in short-term borrowings – Dividends paid).
2. Net funds required for capital expenditureb = Net capital
investments in year t (i.e. Purchase of fixed assets – Sale of fixed assets + Purchase of investments – Sale of investments + other long term investments).
3. Deficits/Surplusa-b = Net cash available from operating
activi-ties (adjusted)a – Net funds required for capital expenditureb.
4. Debt issues = Gross debt issues in financing activity of cash flow statement.
5. Equity issues = Equity issues in financing activity of cash flow statement.
7. Buy-back of equity = Equity buy back in financing activity of cash flow statement.
8. Total Funding Requirements = deficit and debt redemptions.
References
Acedo-Ramírez, M.A., & Ruiz-Cabestre, F.J. (2014). Determinants of capital structure: United Kingdom versus Continental European countries. Journal
of International Financial Management & Accounting, 25(3), 237-270. http://
dx.doi.org/10.1111/jifm.12020
Adedeji, A. (1998). Does the pecking order hypothesis explain the dividend payout ratios of firms in the UK? Journal of Business Finance & Accounting, 25(9-10), 1127-1155. http://dx.doi.org/10.1111/1468-5957.00230
Adedeji, A. (2002). A cross-sectional test of pecking order hypothesis against static
trade-off theory on UK Data. Retrieved from http://ssrn.com/abstract=302827
Allen, F., Qian, J., Shan, S.C., & Zhu, J.L. (2015, May). The best performing economy with the worst performing market: Explaining the poor performance of the Chinese
stock market. Paper presented at Fourth Symposium on Emerging Financial
Markets: China and Beyond, New York, U.S.A.
Bhabra, H.S., Liu, T., & Tirtiroglu, D. (2008). Capital structure choice in a nascent market: Evidence from listed firms in China. Financial Management, 37(2), 341-364. http://dx.doi.org/10.1111/j.1755-053X.2008.00015.x
Bhama, V., Jain, P.K., & Yadav, S.S. (2016). Testing the pecking order theory of deficit and surplus firms: Indian evidence. International Journal of Managerial
Finance, 12(3), 335-350. http://dx.doi.org/10.1108/IJMF-06-2014-0095
Bhama, V., Jain, P.K., & Yadav, S.S. (2017). Firms’ financing decisions in deficit and surplus situations: Survey-based evidence from India. The IUP Journal of Applied Finance, 23(2), 27-45.
Belkhir, M., Maghyereh, A., & Awartani, B. (2016). Institutions and corporate capital structure in the MENA region. Emerging Markets Review, 26(March), 99-129. http://dx.doi.org/10.1016/j.ememar.2016.01.001
Bontempi, M.E. (2002). The dynamic specification of the modified pecking order theory: Its relevance to Italy. Empirical Economics, 27(1), 1-22. http://dx.doi. org/10.1007/s181-002-8356-9
Briozzo, A.E., Vigier, H., & Martinez, L.B. (2016). Firm-level determinants of the financing decisions of small and medium enterprises: Evidence from
Argentina. Latin American Business Review, 17(3), 245-268. http://dx.doi.
org/10.1080/10978526.2016.1209081
Chakraborty, I. (2010). Capital structure in an emerging stock market: The case of India. Research in International Business and Finance, 24(3), 295-314. http://dx.doi.org/10.1016/j.ribaf.2010.02.001
Journal of Business Perspective, 20(4), 267-277. http://dx.doi.org/10.1177/ 0972262916668700
Chen, J.J. (2004). Determinants of capital structure of Chinese listed companies.
Journal of Business Research, 57(12), 1341-1351. http://dx.doi.org/10.1016/
S0148-2963(03)00070-5
Chirinko, R.S., & Singha, A.R. (2000). Testing static trade off against pecking
order models of capital structure: A critical comment. Journal of Financial
Economics, 58(3), 417-425. http://dx.doi.org/10.1016/S0304-405X(00)00078-7
Chong, T.T-L., Law, D.T.-Y., & Zou, L. (2012). Long-term adjustment of capital structure: Evidence from Singapore, Hong Kong and Taiwan. The Singapore
Economic Review, 57(4), 1-22. http://dx.doi.org/10.1142/S0217590812500270
Dawar, V. (2014). Agency theory, capital structure and firm performance: Some Indian evidence. Managerial Finance, 40(12), 1190–1206. http://dx.doi. org/10.1108/MF-10-2013-0275
Denis, D.J., & Mckeon, S.B. (2012). Debt financing and financial flexibility: Evidence from proactive leverage increases. The Review of Financial Studies, 25(6), 1897-1929. http://dx.doi.org/10.1093/rfs/hhs005
Didier, T., & Schmukler, S.L. (2013). The financing and growth of firms in China and India: Evidence from capital markets. Journal of International
Money and Finance, 39(December), 111-137. http://dx.doi.org/10.1016/j.
jimonfin.2013.06.021
Donaldson, G. (1961). Corporate debt capacity: A study of corporate debt policy and
the determination of corporate debt capacity. Washington, DC: Beardbooks.
Dutta, A. (2013). Lemon problem and pecking order theory: An investigation on Indian corporate sector. Vilakshan-XIMB Journal, 10(2), 73-82.
Fama, E.F., & French, K.R. (2005). Financing decisions: Who issues stock?
Journal of Financial Economics, 76(3), 549–582. http://dx.doi.org/10.1016/j.
jfineco.2004.10.003
Fan, J.P.H., Rui, O.M., & Zhao, M. (2008). Public governance and corporate finance: Evidence from corruption cases. Journal of Comparative Economics, 36(3), 343-364. http://dx.doi.org/10.1016/j.jce.2008.05.001
Fan, J.P.H., Titman, S., & Twite, G. (2012). An international comparison of capital structure and debt maturity choices. Journal of Financial and Quantitative
Analysis, 47(1), 23-56. http://dx.doi.org/10.1017/S0022109011000597
Faulkender, M., & Petersen, M.A. (2006). Does the source of capital affect capital structure? The Review of Financial Studies, 19(1), 45-79. http://dx.doi.org/ 10.1093/rfs/hhj003
Feng, Y., & Cui, Y. (2007, August 20-22). On dynamic partial adjustment of corporate
capital structure: Evidence from Chinese listed companies. Paper presented
at International Conference on Management Science and Engineering, Harbin, China. http://dx.doi.org/10.1109/ICMSE.2007.4422111
Frank, M.Z., & Goyal, V.K. (2003). Testing the pecking order theory of capital
structure. Journal of Financial Economics, 67(2), 217-248. http://dx.doi.org/
Ganguli, S.K. (2013). Capital structure – does ownership structure matter? Theory and Indian evidence. Studies in Economics and Finance, 30(1), 56-72. http://dx.doi.org/10.1108/10867371311300982
Jain, P.K., Singh, S., & Yadav, S.S. (2013). Financial management practices: An
empirical study of Indian corporates. India: Springer.
Jain, P.K., & Yadav, S.S. (2005). Financial management practices: A study of
public sector enterprises in India. New Delhi, India: Hindustan Publishing
Corporation.
Jiang, Z., & Kim, K.A. (2013). Financial management in China. Journal of
Multi-national Financial Management, 23(3), 125-133. http://dx.doi.org/10.1016/
j.mulfin.2013.03.007
Jong, A.D., Verbeek, M., & Verwijmeren, P. (2010). The impact of financing surpluses and large financing deficits on tests of the pecking order theory.
Financial Management, 39(2), 733-756.
http://dx.doi.org/10.1111/j.1755-053X.2010.01090.x
Komera, S., & Lukose, J.P.J. (2014). Capital structure choice, information asymmetry, and debt capacity: Evidence from India. Journal of Economics
and Finance, 39(4), 807-823. http://dx.doi.org/10.1007/s12197-014-9285-3
Leary, M.T., & Roberts, M.R. (2010). The pecking order, debt capacity, and
information asymmetry. Journal of Financial Economics, 95(3), 332-355.
http://dx.doi.org/10.1016/j.jfineco.2009.10.009
Lemmon, M.L., & Zender, J.F. (2010). Debt capacity and tests of capital structure
theories. Journal of Financial and Quantitative Analysis, 45(5), 1161-1187.
http://dx.doi.org/10.1017/S0022109010000499
Majumdar, R. (2010). The determinants of corporate debt maturity: A study of Indian firms. The IUP Journal of Applied Finance, 16(2), 70-80.
Myers, S.C. (1984). The capital structure puzzle. The Journal of Finance, 39(3), 575-592. http://dx.doi.org/10.1111/j.1540-6261.1984.tb03646.x
Myers, S.C. (2001). Capital structure. Journal of Economic Perspectives, 15(2), 81-102. http://dx.doi.org/10.1257/jep.15.2.81
Ni, J., & Yu, M. (2008). Testing the pecking-order theory: Evidence from Chinese
listed companies. The Chinese Economy, 41(1), 97-113. http://dx.doi.org/
10.2753/CES1097-1475410105
Pessarossi, P., & Weill, L. (2013). Choice of corporate debt in China: The role
of state ownership. China Economic Review, 26(September), 1-16. http://
dx.doi.org/10.1016/j.chieco.2013.03.005
Poncet, S., Steingress, W., & Vandenbussche, H. (2010). Financial constraints in China: Firm level evidence. China Economic Review, 21(3), 411-422. http:// dx.doi.org/10.1016/j.chieco.2010.03.001
Rastogi, A.K., Jain, P.K., & Yadav, S.S. (2006). Debt financing in India in public, private and foreign companies. Vision: The Journal of Business Perspective, 10(3), 45-58. http://dx.doi.org/10.1177/097226290601000305
Seifert, B., & Gonenc, H. (2009). Pecking order behavior in emerging markets.
Journal of International Financial Management and Accounting, 21(1), 1-31.
http://dx.doi.org/10.1111/j.1467-646X.2009.01034.x
Serrasqueiro, Z., & Caetano, A. (2015). Trade-off theory versus pecking order theory: Capital structure decisions in a peripheral region of Portugal.
Journal of Business Economics and Management, 16(2), 445-466. http://dx.doi.
org/10.3846/16111699.2012.744344
Shyam-Sunder, L., & Myers, S.C. (1999). Testing static trade off against pecking
order models of capital structure. Journal of Financial Economics, 51(2),
219-244. http://dx.doi.org/10.1016/S0304-405X(98)00051-8
Tong, D.C. (2005). Corporate governance and securities regulation in mainland China. China: China Securities Regulatory Commission Research.
Tong, G., & Green, C.J. (2005). Pecking order and trade-off hypothesis? Evidence on the capital structure of Chinese firms. Applied Economics, 37(19), 2179-2189. http://dx.doi.org/10.1080/00036840500319873
Vasiliou, D., Eriotis, N., & Daskalakis, N. (2009). Testing the pecking order
theory: The importance of methodology. Qualitative Research in Financial
Markets, 1(2), 85-96. http://dx.doi.org/10.1108/17554170910975900
Yue, H-Y. (2011). Determinants of corporate capital structure under different debt maturities. International Research Journal of Finance and Economics, 66, 99-106.
Zou, H., & Xiao, J.Z. (2006). The financing behaviour of listed Chinese firms.
The British Accounting Review, 38(3), 239-258. http://dx.doi.org/10.1016/j.
Appendix A Mean Differences of Pecking Order Variables Firms with Various Levels of Deficits Firms with Firms with Firms with Firms with Small Deficits Medium Deficits Large Deficits
Very Large Deficits
India China MD India China MD India China MD India China MD (t-test) (t-test) (t-test) (t-test)
Net cash available
95.55 22.55 6.12*** 56.27 12.47 -6.37*** 39.43 -4.95 4.77*** -6.38 -30.27 1.604 from operating (0.109) activities (adjusted) a
Net funds required
-119.85 -31.81 -6.19*** -112.89 -40.87 7.40*** -210.33 -59.58 -7.54*** -349.12 -109.26 -7.095***
for capital expenditure
b Deficits a-b -24.30 -9.26 -4.44*** -56.62 -28.40 6.56*** -170.90 -64.53 -7.23*** -355.50 -139.53 -7.198*** Debt issues 88.23 88.10 0.01 79.03 127.94 3.54*** 199.72 178.96 0.83 360.51 221.90 3.617*** Equity issues 11.84 3.48 3.12*** 7.71 6.12 -1.04 31.31 13.54 3.39*** 53.41 18.32 4.934***
Redemption of debt
-51.70 -81.74 2.73*** -34.04 -111.19 -7.24*** -78.17 -139.69 3.62*** -76.78 -137.04 3.893***
Buy back of equity
-0.69 0.00 -3.24*** -0.25 0.00 2.63*** -1.11 0.00 -2.51*** -0.61 0.00 -2.511*** Note
: *** indicates significance level at 1 per cent; figures are in
Appendix B Mean Differences of Pecking Order Variables of Firms with Various Levels of Surpluses Firms with Firms with Firms with Firms with Small Surpluses Medium Surpluses Large Surpluses
Very Large Surpluses
India China MD India China MD India China MD India China MD (t-test) (t-test) (t-test) (t-test)
Net cash available
83.54 31.96 -3.29*** 104.94 47.78 3.83*** 146.52 49.32 -4.84*** 176.91 76.68 4.205***
from operating activities (adjusted)
a
Net funds required
-74.24 -26.22 3.18*** -66.55 -29.26 -3.58*** -65.08 -18.54 4.17*** -18.76 -11.81 -0.858
for capital expenditure
b Surplus a-b 9.30 5.74 -3.17*** 38.39 18.51 3.66*** 81.44 30.79 -4.94*** 158.15 64.87 4.835***
Redemption of debt
-34.19 -66.02 -3.61*** -61.72 -84.69 1.42 -57.99 -40.26 1.23 -43.94 -39.89 -0.460
Buy back of equity
-0.16 0.00 2.65*** -0.44 0.00 -2.24** -0.72 0.00 2.48*** -1.54 0.00 -2.326** Debt issues 35.03 64.07 3.21*** 56.51 75.26 -1.19 49.51 37.80 -0.78 18.45 30.98 -2.155** Equity issues 5.23 2.36 -1.86* 2.60 4.45 -1.52 5.97 2.27 -1.83* 3.55 2.06 0.982 Note
: ***, ** and * indicate significance level at 1, 5 and 10 per c