INCREASING THE LOADABILITY AND
MINIMIZING THE LOSSES USING
UPFC
P. VIJAYARPIYA* SELECT, VIT, Thiruvalam Road Vellore, Tamilnadu, 632014 , India
M. KOWSALYA SELECT, VIT, Thiruvalam Road Vellore, Tamilnadu, 632014 , India
J. RAJU
SELECT, VIT, Thiruvalam Road Vellore, Tamilnadu, 632014 , India
Dr. D. P. KOTHARI, Fellow IEEE VIT, Thiruvalam Road Vellore, Tamilnadu, 632014 , India
Abstract :
This paper focuses on increasing stability and maximum loadability of a system and minimizing the losses in the power system network by optimal placement of Unified Power Flow Controller (UPFC). Unified Power Flow Controller (UPFC) is one of the versatile FACTS devices which has shown great potential in enabling power system engineers to maintain the required level of security of a large interconnected power systems by controlling the active and / or reactive power flow through any lines(s) in the system. Identification of a suitable location for installation of this costly device is a vital task. Several criteria are to be satisfied before selecting the best location. In this paper the best location for UPFC placement is identified and analyzed based on minimizing the losses and increasing the loadability of the line. The analyses used are viz., Small Signal Stability (SSS), Time Domain Analysis, Power flow, using Power System Analysis Toolbox (PSAT). By placing UPFC in a particular line connected to most critical bus, losses are minimized, loadability is increased and stability can be maintained .
Keywords: Losses, PSAT, UPFC, Voltage stability.
1. INTRODUCTION
In the power market scenario, control of active and reactive power flow in a transmission line becomes a very critical aspect due to the possibility of dynamically changing bilateral transactions. Entry of more power generation companies has increased the need for enhanced secured operation of power systems, which are facing the threat of voltage instability leading to voltage collapse. Also the optimal operation of the power system networks have been based on economic criterion. Now other criteria such as: improving voltage profile, minimizing power loss of transmission line, etc. have been considered. Power system operators ensure the quality and reliability of supply to the customers by maintaining the load bus voltages in their permissible limits. Any changes to the system configuration or in power demands can result in higher or lower voltages in the system. The two main objectives are
(1) To improve the voltage profiles. (2) To minimize the system losses.
A tool to assist the system operator for coordinated control of these variables is presented in this paper based on Power Electronic components. Nowadays, FACTS (Flexible AC transmission Systems) technology based on power electronic components forms an attractive tool for the control of power flows, providing the possibility of operating the transmission grid with increased flexibility and efficiency. The most comprehensive device that emanated from the FACTS technology is the Unified Power Flow Controller (UPFC) [1], [2].
For the last few years, the focus of research in the FACTS area is mainly on UPFC. This has resulted in many useful contributions in the areas of modeling of UPFC [3] – [5], effective control strategy for UPFC [6], [7] and the system stability enhancement using UPFC[8], [9]. However, to achieve the good performance of UPFC, proper placement of UPFC is a very important task. There are several methods for finding the locations of UPFC in vertically integrated systems but little attention has been devoted to the two fold task of increasing the loadability and reducing the losses [10].
In this paper, the selection of the best possible location for installation of an UPFC is carried out with an objective of reducing the losses and increasing the loadability of the bus thereby improving their voltage profiles in IEEE 9-bus and 14-bus systems using PSAT (Power System Analysis Toolbox) software by using different analysis techniques such as Small Signal Stability (SSS), Hopf Bifurcation, Time Domain Analysis.
Section 2 presents brief introduction of each of the techniques mentioned above, Section 3 briefs the study on IEEE 9 –bus system and its analysis, Section 4 study on IEEE 14 –bus system and its analysis and Section 5 presents the conclusion
2. Over View of Analysis
2.1. Small Signal Stability Analysis
It is the ability of a power system to maintain synchronism when subjected to small disturbances. The stability analysis can be carried out by calculating the eigen – values and participation factor.
The Eigen-Values can be real or complex and depending upon the nature of the Eigen values the basic stability criteria are as follows:
• Real Eigen: If the Eigen values are real and lie at the left half of the s- plane, then the system is stable otherwise unstable.
• Complex Eigen: The real part gives damping and the imaginary part gives the frequency. The more the magnitude of the negative Eigen, the more the damping. In case of Positive real part, it gives oscillations of increasing amplitude.
The elements of the Eigen- vectors are dependent on the scaling and units of the state variables [8]. To overcome this problem, a matrix called the participation factor (P), which combines the right and left Eigen vectors is introduced as a measure of the association between state variables and modes.
PSAT allows computing and plotting the Eigen values and the participation factors of the system, once the power flow has been solved. The Eigen values can be computed from the state matrix of the dynamic system, and from the power flow Jacobian matrix (sensitivity analysis). Unlike other softwares, such as PST and Simulink-based tools, Eigen values are computed using analytical Jacobian matrices, thus ensuring high-precision results..
2.2. Time Domain Analysis
The differential equations to be solved in power system stability analysis are nonlinear ordinary equations with known initial values:
f(x,t) dt
dx
where x is the state vector of n dependent variables and t is the independent variable (time). Our objective is to solve x as a function of t, with the initial values of x and t equal to x0 and t0 respectively.
Numerical Integration methods are applied to solve equations of above form. There are two types of integration methods:
(1) Explicit integration method (2) Implicit integration method
2.3. Hopf Bifurcation
complex plane. Voltage stability is basically a non-linear phenomenon and it is natural to use non-linear analysis techniques such as bifurcation theory to study voltage collapse. Bifurcation theory assumes that the power system parameters vary slowly and predicts how a power system becomes unstable. Bifurcation occurs at a point where, due to some slow changes of parameter, the characteristics of the system change. Bifurcation points indicate the zones where the system changes from stable to unstable, from stationary to oscillatory, or from order to chaos occur and they are the most interesting points in voltage stability studies. These changes may take place simultaneously. Usually, only one parameter, e.g. load demand, is changed at once, in which case there is a possibility to achieve either saddle node or Hopf bifurcation. At the saddle node bifurcation, the stable and unstable equilibrium coincide and disappear and the Jacobian matrix becomes singular. Thus one of the Eigen values must be zero at this point. The saddle node point is a limiting point between stable and unstable areas. The complex conjugate Eigen value pair is located at the imaginary axis at the Hopf bifurcation, in which case oscillation arises or disappears
2.4. Principle of Operation of UPFC
The UPFC is the most versatile FACTS controller developed so far, with all encompassing capabilities of voltage regulation, series compensation, and phase shifting. It can independently and very rapidly control both real and reactive power flows in a transmission line. It is configured as shown in Fig2.1 and comprises of two VSC’s coupled through a common DC terminal. One VSC- converter 1- is connected in shunt with the line through a coupling transformer; the other VSC – converter 2- is inserted in series with the transmission line through an interface transformer. The dc voltage for both converters is provided by a common capacitor bank. The series converter is controlled to inject a voltage phasor Vs, in series with the line, which can be varied from 0o to 360o. In this process, the series converter exchanges both real and reactive power with the transmission line. Although the reactive power is internally generated/absorbed by the series converter, the real-power generation/absorption is made feasible by the DC energy storage device-that is, the capacitor [7] [11].
The shunt-connected converter 1 is mainly used to supply the real power demand of converter 2, which it derives from the transmission line itself. The shunt converter maintains constant voltage of the dc bus. Thus the net real power from the AC system is equal to the two converters and their coupling transformers. In addition, the shunt converter functions like a STATCOM and independently regulate the terminal voltage of the interconnected bus by generating/absorbing a requisite amount of reactive power.
Fig.2.1 Block Diagram of UPFC Fig.2.2 Phasor Diagram where:
s i
i V V
V'
' i i
V V
r
where r varies from 0 ≤ r ≤ rmax
γ varies from 0 ≤ γ ≤ 2π
3. Case Study - WSCC 9 – Bus System
Fig 3.1 Single Line diagram of IEEE 9 bus system
Fig 3.2 Critical Buses Fig 3.3 Network Visualization
UPFC was placed to the lines connected to these three most critical busses and voltage profile was monitered. It was observed that when UPFC was placed between bus 9 and bus 8, reduction in losses was more when compared to others. This can be proved by the Table 3.1.
Table 3.1 Real power loss With and Without UPFC Table 3.2 Eigen value analysis result
3.1. Eigen Value Analysis
Eigen Value analysis is performed in order to determine the stability of the system and to determine the position of placement of UPFC in the system. By placing UPFC between the lines critical buses and performing eigen value analysis, the result are tabulated in Table 3.2
It is evident from the table3.2 that the dynamic order of the system increases after incorporating UPFC in the system. UPFC increases the stability of the system, as the nos. of negative Eigen values increases after incorporating the UPFC in the system. The real part of a complex Eigen value gives the damping rate of the UPFC b/w
bus nos.
Total Generation [p.u.]
Total Load [p.u.] Real Power Losses [p.u.]
REAL REAC
TIVE REAL REAC
TIVE
No UPFC 3.1996 0.3488 3.15 1.15 0.04955
8 - 9 3.1728 0.63124 3.15 1.15 0.02281 4 - 9 3.1971 0.5254 3.15 1.15 0.04706
5 - 6 3.1836 0.70349 3.15 1.15 0.03359
5 - 4 3.1981 0.51225 3.15 1.15 0.04811 7 - 8 3.1948 0.49714 3.15 1.15 0.04479 6 - 7 3.1991 0.56993 3.15 1.15 0.04914
No UPFC
UPFC Between
9-4 9-8 5-4 5-6 7-6 7-8
σ(max) -5.5 5.6 -5.6272 -5.43 -5.45 -5.55 -5.57
Dynamic order
24 27 27 27 27 27 27
Pos. Eigen 0 1 0 1 0 1 1
Neg. Eigen 22 24 25 24 25 24 24
Complex Pair
8 8 8 8 8 8 8
remaining two options, if UPFC is placed between 9 – 8 then the damping is also more and selected for placing UPFC. Thus, this analysis also gives the point of optimum location of UPFC for minimum losses and also increased stability.
3.2. Time Domain Analysis
When time domain analysis was carried out using PSAT, it verify the above result it was found that bus 9 is the most critical bus having lowest bus voltage followed by bus 5 and then bus 7. UPFC is placed at various transmission lines connecting to 3 most critical busses to analyze the reduction in losses.
Table 3.3 Time domain analysis report
From report it can be analyzed that real power loss is 0.04641 p.u without incorporating UPFC. When UPFC was incorporated in transmission lines connecting in these busses it can be analyzed that it is connected between bus 9 & 8, real power loss was reduced to the maximum when compared to other locations.
Hence by all analysis it can be inferred that UPFC should be incorporated between bus 9 & 8 for reduction in losses and improvement in the stability of the system
4. Case Study - IEEE 14 – Bus System
Analysis was continued with IEEE 14 bus , single line diagram is shown in Fig 4.1
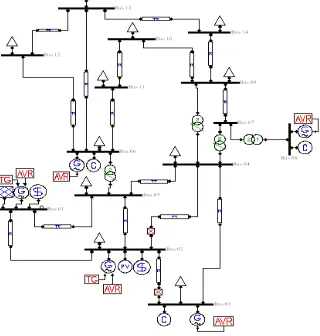
Fig 4.1 Single Line diagram of IEEE 14 bus system
Power flow is run under maximum loading condition to find the most critical bus. Fig4.2 represents three lowest bus voltage magnitudes at bus 14, bus 9 and bus 13
4.1. Eigen Value Analysis
Without UPFC in the system the eigen value analysis revealed two positive eigen values which may lead to system instability as shown in Fig 4.3. With UPFC connected to the system the result from eigen value analysis were tabulated as shown in Table 4.1
UPFC B/W
BUS NO. Pgen (p.u) Qgen (p.u) Pload (p.u) Q load (p.u)
Plosses
(p.u) Qlosses (p.u)
No UPFC 3.1964 0.2284 3.15 1.15 0.04641 -0.9216
9 & 8 3.1775 0.53138 3.15 1.15 0.02148 -.061862
5& 6 3.1875 0.60598 3.15 1.15 0.03151 -.54402
7 & 8 3.192 0.38599 3.15 1.15 0.04201 -.76401
9 & 4 3.1939 0.41903 3.15 1.15 0.04389 -0.73097
5 & 4 3.1949 0.40396 3.15 1.15 0.0449 -.74604
Fig 4.2 Critical Buses Fig. 4.3 Eigen value analysis without UPFC
It is evident from the table that the dynamic order of the system increases after incorporating UPFC in the system. UPFC increases the stability of the system, as the nos. of negative Eigen values increases after incorporating the UPFC in the system. Bus nos. 14 is the most critical bus, thus the damping of this bus is more than any other bus. We cannot place UPFC between buses 9-7 as Eigen value is positive. Here, 14-13 and 14-9 have no positive Eigen values. But, when UPFC is placed between bus 14-9 then the magnitude of damping is more and hence improves stability of the system. It was also observed that the loading limit on 14th bus was 17.5% without UPFC but with the UPFC incorporated in the system, the loading limit was enhanced upto 41.89%. Thus the system has become more stable with UPFC installed
Table 4.1 Eigen value analysis results Table 4.2 Real power losses with and without UPFC
4.2. Time Domain Simulation
To identify the location for minimizing the losses UPFC is placed various transmission lines connecting to 3 most critical busses and time domain analysis were carried out to find the reduction in losses and the results are tabulated in Table 4.2
From report it can be analyzed that real power loss is 0.27392 p.u. without UPFC in the system. When UPFC was connected between bus 14 & 9, real power loss was reduced to 0.22904 p.u. When UPFC was incorporated in between other busses, the real power loss was not that significant as compared between bus 14 & 9. So it can be inferred from above that UPFC should be incorporated between bus 14 & 9 for reduction in losses and improvement in the stability of the system
5 Conclusion
The loadability and stability of a system is increased using UPFC, the losses are minimized and the optimum location of the UPFC in IEEE 9-bus and 14-bus systems using PSAT (Power System Analysis Toolbox) software is obtained using different power flow analyses techniques such as Small Signal Analysis (SSS), Hopf Bifurcation, Time Domain Analysis.
It was also observed that in the 14- Bus system, with no UPFC the loadability is only 17.5%,whereas in case of UPFC the loadability is increased to 41.89%.
UPFC B/W BUS NO.
Pgen (p.u)
Qgen (p.u)
Pload (p.u)
Q load (p.u)
Plosses (p.u)
Qlosses (p.u)
No UPFC 3.1964 0.2284 3.15 1.15 0.04641 -0.9216 9 & 8 3.1775 0.53138 3.15 1.15 0.02148 -.061862
5& 6 3.1875 0.60598 3.15 1.15 0.03151 -.54402 7 & 8 3.192 0.38599 3.15 1.15 0.04201 -.76401 9 & 4 3.1939 0.41903 3.15 1.15 0.04389 -0.73097 5 & 4 3.1949 0.40396 3.15 1.15 0.0449 -.74604 7 & 6 3.1962 0.46162 3.15 1.15 0.04616 -0.68838 No
UPFC
UPFC Between
14-13 14-9 9-7 9-10 13-12
σ(max) 93.283 -51.353 -85.92 -83.96 -82.99 -81.51 Dynamic
order 55 58 58 58 58 58 Pos.
Eigen 2 0 0 1 0 0
Neg.
Eigen 52 57 57 57 57 57 Complex
Pair 11 11 12 7 12 11 Zero
This paper has immense potential for future studies. The exact distance between bus and UPFC for optimum location of UPFC can be found out. The methods to increase the loadability of the buses even further, keeping in mind its stability after incorporating UPFC can be studied in the future.
References
[1] Federico Milano. “An open source power system analysis tool box”, IEEE Trans Power System, Vol.20, No 3, pp. 1191-1206, Aug
2005.
[2] K. K. Visakha D,'Thukaram ' Lawrence Jenkins H.P.Khincha, “Selection of UPFC Suitable Locations for System Security Improvement Under Normal and Network Contingencies”, TENCON 2003. Conference on Convergent Technologies for Asia-Pacific Region , Oct. 2003
[3] Claudio Canizares, W. Rosehart, A. Berizzi and C. Bovo. “Comparison of Voltage Security Constrained Optimal Power Flow Techniques”.Proc.2001 IEEE-PES Summer Meeting, Vancouver, BC, July 2001
[4] S. K. Mena Kodsi and C. A. Cañizares, “Modeling and Simulation of IEEE 14 Bus System With FACTS Controllers”. Available: http://www.power.uwaterloo.ca
[5] Introduction to PSAT: A toolbox for Computer Methods in Electric Power Engineering Luigi [email protected], Rensselaer
Polytechnic Institute, EPOW-6890 Computer Methods in Electric Power Engineering, Spring 2006.
[6] Using UPFC in order to Power flow control Maryam Hashemi Namin Power Electrical Engineer Iran University of science and Technology Tehran University T.R.E.C
[7] Power system analysis operation and control” by Abhijit Chakrabarti & Sunita Halder.
[8] I.J. Nagrath and D.P. Kothari, Modern power system analysis. India: 3rd edition Tata McGraw-Hill, 2003.
[9] H. Saadat, Power system analysis. USA: McGraw-Hill Higher Education, 2002 [10] Hingorani “Understanding FACTS”