PREDICTION OF GROUND
VIBRATIONS IN OPENCAST MINE
USING NONLINEAR REGRESSION
ANALYSIS
Dr.Y.SEETHARAMA RAO,
Dept of Mechanical Engg, G.V.P College Of Engineering,
Visakhapatanam, PIN:530048 Andhrapradesh, India [email protected] Abstract:
The present work deals with the prediction of ground vibrations in Opencast mine by using Nonlinear regression analysis. It is very important to control the influence of various blast design parameters in the prediction of ground vibrations. Predictions from Non linear regression analysis have been compared with actual values observed from the field and are very close with the field values. Three cases have been considered and the ground vibrations are predicted. In the second case, the obtained results matched very closely with the measured values from the field data. Thus the Nonlinear regression model can be applied for analyzing the prediction of ground vibrations in Opencast mine.
Keywords: Ground Vibrations, Blast Design Parameters, Peak Particle Velocity and Nonlinear Regression Analysis
1.Introduction:
Ground vibrations induced by blasting are one of the fundamental problems in the mining industry and may cause severe damage. Rock blasting results in ground shock and vibration which may cause damage to the surrounding structures such as buildings, bridges, dams, tunnels etc. Therefore, blast induced ground shocks and their propagation in rock mass have been drawing more and more attention[1].
The vibration level at any particular site has being affected by the most at a given distance are the charge weight per delay, vibration frequency and, to a lesser extent, the method of initiation. The same total charge weight which would result in damage can often be shot in a series of delays with no damage. Other factors affecting vibration level such as rock type, rock density, presence or absence of rock layering, slope of layers, nature of the terrain, blast hole conditions also affect then transmission of vibrations but are beyond control. In order to effectively control vibration related problems, the development of a reliable vibration monitoring system and the proper assessment of attenuation characteristics of various vibrations are essential[2].
As the ground motion is the most important environmental effect of blasting operations, some regulations related with ground motion to structural damage have been developed[3]. The regulations are primarily based on the Peak Particle Velocity (PPV) resulting from blasting operations. Many scientists and engineers investigated on PPV prediction and published their findings. The first significant PPV predictor equation was proposed by the United States Bureau of Mines (USBM) [4]. There are also modified predictors from other researchers or institutions such as Ambraseys and Hendron [5], Langefors and Kihlstorm [6], Ghosh and Daeman [7], Roy [8], Singh et al. [9] etc. By considering the data from Khandelwal M and Singh TN [10] the prediction of ground vibrations in opencast mine were calculated.
2.Methodology:
explosive and Density of explosive were considered. In Case3, Hole diameter, Hole depth, Explosive per hole, V.O.D of explosive were considered. In the nonlinear regression analysis approach, the above three cases were considered and the second case shows the predicted output parameters from nonlinear regression analysis is closer to the measured field data taken from Khandelwal and Singh [10].
In this method by using the variables considered in case 1, by using PPV and frequency equations, the regression coefficients are calculated and predicted the Peak Particle Velocity (PPV) and frequency of the ground vibrations, and then generated an output file which consists of the predicted PPV and frequency. The same procedure is continued for the cases 2 & 3. To know the group of combination of parameters which will produce lesser ground vibrations the total blast design parameters are classified into three cases.
3. Nonlinear Regression Analysis:
Equations used for Nonlinear Regression Analysis:
Case 1:
The variables used are Hole Diameter, Hole Depth, Burden, Spacing, Charge Length, Explosive per hole, V.O.D. of Explosive, Density of Explosive.
PPV =(0.2246E+19)(Hole Diameter)-5. 94( Hole depth)-24. 55(Burden)12.56
(Spacing)1 .335 ( Charge length)21. 07( Explosive per hole)-3. 854 ( VOD of explosive)-1. 473 ( Density of explosive) -7. 597
Frequency = (1500)(Hole Diameter)-0. 3652( Hole depth)-4. 355(Burden)-0.8449E-01
(Spacing)2 .090( Charge length)3. 33( Explosive per hole)-0. 5188( VOD of explosive)0. 6487 (Density of explosive)-5. 638
Case 2:
The variables used are Hole Diameter, Hole Depth, Burden, Explosive per hole, V.O.D. of Explosive, Density of Explosive.
PPV = (2.2)(Hole Diameter)-0. 6243( Hole depth)0. 4927(Burden)2. 618
( Explosive per hole)-0. 2502E-0 ( VOD of explosive)-1. 078 ( Density of explosive)-6. 928
Frequency = (5.369)(Hole Diameter)-0. 4529E-01( Hole depth)0. 6794(Burden)-
0. 6006
( Explosive per hole)-0. 6610E-01 ( VOD of explosive)0. 9538 ( Density of explosive)-5. 966
Case 3:
The variables used are Hole Diameter, Hole Depth, Explosive per hole, V.O.D of Explosive. PPV = (1.526)(Hole Diameter)0. 4248( Hole depth)2. 163 (Explosive per hole)-0. 5593 (V.O.D of explosive)-1.483 Frequency = (5.355)(Hole Diameter)0. 3833( Hole depth)0. 6221 (Explosive per hole)-0.5140(V.O.D of explosive) 0. 8092 The variables used are Hole Diameter, Hole Depth, Explosive per hole, V.O.D of Explosive.
PPV = (1.526)(Hole Diameter)0. 4248( Hole depth)2. 163 (Explosive per hole)-0. 5593 (V.O.D of explosive)-1.483 Frequency = (5.355)(Hole Diameter)0. 3833( Hole depth)0.6221 (Explosive per hole)-0. 5140(V.O.D of explosive) 0. 8092
For the case 1, the value of the constant and nonlinear regression coefficients for the ppv were obtained as
follows:
c = 0.2246e +19
a1 = -5.940 a2 = -24.55
a3= 12.56 a4= 1.335
a5= 21.07 a6= -3.854
a7= -1.473 a8= -7.597
C = 1500
For the case 2, the value of the constant and nonlinear regression coefficients for the ppv were obtained as follows:
C = 2.200
A1 = -0.6243 A2 = 0.4927
A3= 2.618 A4= -0.2502E – 01
A5= -1.078 A6= -6.928
For the case 2, the value of the constant and nonlinear regression coefficients for the ppv were obtained as follows:
C = 0.2246E +19
A1 = -5.940 A2 = -24.55
A3= 12.56 A4= 1.335
A5= 21.07 A6= -3.854
A7= -1.473 A8= -7.597
For the case 3, the value of the constant and nonlinear regression coefficients for the frequency were obtained as follows:
C = 1500
A1 = -0.3652 A2 = -4.355
A3= -0.8449E – 01 A4= 2.090
A5= 3.330 A6= -0.5188
A7= 0.6487 A8= -5.638
For the case 3, the value of the constant and nonlinear regression coefficients for the ppv were obtained as follows:
C = 2.200
A1 = -0.6243 A2 = 0.4927
A3= 2.618 A4= -0.2502E – 01
A5= -1.078 A6= -6.928
A1 = -0.3652 A2 = -4.355
A3= -0.8449E – 01 A4= 2.090
A5= 3.330 A6= -0.5188
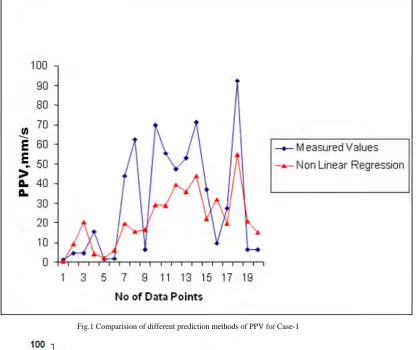
Fig. 1 to Fig.3 shows the variation of PPV from nonlinear regression analysis and the measured values with the dataset. In Fig. 1 (case-1), very few predicted values only will be closer to the measured values. The average deviation and the standard deviation obtained for this case-1 as 35.41 and 42.0. In Fig.3.2 (case-2), larger variations of the predicted PPV values were found because of the nonlinearity relationship existed between the variables to be considered. The average deviation and the standard deviation obtained for this case-2 as 109.4 and 180.4. In Fig.3 (case-3), the predicted values of the data points from 1 to 5 will be closer to the measured values. The average deviation and the standard deviation obtained for the case-3 as 44.21 and 52.62.
Fig.1 Comparision of different prediction methods of PPV for Case-1
Fig.3 Comparison of different prediction methods of PPV for Case-3
Fig.4 to Fig.6 shows the variation of frequency from nonlinear regression analysis and the measured values with the data set. In Fig.4 (case-1), the predicted values from nonlinear regression analysis between the data points 1to 10 is closer to the measured values. The average deviation and standard deviation obtained for this case-1 as 25.67 and 31.22. In Fig.5 (case-2), the predicted values from nonlinear regression analysis between the data points 10 to 20 is closer to the measured values. The average deviation and standard deviation obtained for this case-2 as 31.53 and 37.02. In Fig.6 (case-3), the predicted values from nonlinear regression analysis between the data points 8 to 12 is closer to the measured values. The average deviation and standard deviation obtained for this case-3 as 44.21 and 52.62.
Fig.5 Comparison of different prediction methods of Frequency for Case-2
Fig.6 Comparison of different prediction methods of Frequency for Case-3
Fig.7 illustrates the comparison of predicted PPVfor the three cases by using nonlinear regression analysis with
measured PPV from field. Here nonlinear regression analysis for case-1shows very few data points only of the
PPV predicted from nonlinear regression analysis matches with the measured field data of PPV. But in case-2 and case-3 the variations were so high due to the nonlinearity relationship between the variablesconsidered in the prediction of ground vibrations.
Fig.7 Comparison of predicted PPV by NLR with measured values.
Fig.8 Comparison of predicted Frequency by NLR with measured values
5.Conclusions:
The following conclusions are drawn from the present work.
1. The present work demonstrates the use and adaptability of the Non linear regression analysis to predict the output parameters of the ground vibrations such as Peak particle velocity and Frequency.
2. Considered Case2 gives the closed predicted values as compared to the field values for few data points. Because of the less number of data points and the more number of input parameters the errors obtained for PPV and Frequency is high.
3. The present study helps to predict the ground vibrations by means of developing the logarithmic relations between the variables.
4. The average deviation and standard deviations found for the prediction of Peak Particle Velocity for the case 1 are 35.41 and 42.0 and for the case2 are 109.4 and 180.4 and for the case 3 are 44.21 and 52.62.
5. The average deviation and standard deviations found for the prediction of Frequency for the case 1 are 25.67 and 31.22 and for the case2 are 31.53 and 37.02 and for the case 3 are 44.21 and 52.62.
References
[1] Wu Yk, Ha OH, Zhou YX, Chong K. Propagation characteristics of blast induced shock waves in a Jointed rock mass. Journal of Soil
Dynamics and Earthquake Engineering,1998,Vol.17,pp 407-412.
[2] Kim DS,Lee JS.Propagation and attenuation characteristics of various ground vibrations.Journal of Soil Dynamics and Earthquake
Engineering,2000,Vol.19,pp 115-126.
R.I.5968,1962.
[5] Ambraseys NR, Hendron AJ. Dynamic behaviour of rockmass.In:Proceedings of the rock mechanics in Engineering Practices,London
1968,pp.203-207.
[6] Langefors U,Kihlstorm B.The modern technique of rock blasting,New York:John Willey:1978.
[7] Ghosh A,Daemen JK.A simple new blast vibration predictor of ground vibrations inducedpredictor.In:Proceedings of the 24th
U.S.Symposism on rock mechanics,Texas,1983.
[8] Roy PP.Vibration control in an Opencast Mine based on improved blast vibration predictors.Journal of Mining Science and
Technology 1991.Vol. 12,pp.157-165.
[9] Singh T N,Amit P,Saurabh P,Singh PK.Prediction of explosive charge for efficient mining operation.In:Proceedings of the rock
engineering problems and approaches in under ground construction,Seoul,22-24 July,2002.
[10] Khandelwal M and Singh T N.,Predictions of Blast Induced ground vibrations and frequency in Opencast Mine:A Neural network