3160
COLOR IMAGE COMPRESSION BASED on DCT,
DIFFERENTIAL PULSE CODING MODULATION, and
ADAPTIVE SHIFT CODING
ENAS KH. HASSAN1, LOAY E. GEORGE2, FAISAL G. MOHAMMED2 1 Department of computer science, College of science, University of Baghdad, Baghdad, Iraq
2 Department of Remote Sensing and Geographic Information's, college of science, University of Baghdad, Baghdad, Iraq.
Emails:[email protected], [email protected]2,[email protected]2
ABSTRACT
In this study a color image compression scheme was introduced, the proposed scheme was applied to images in RGB and YCbCr color models for the issues of comparison in performance; each plane was partitioned into 16x16 blocks and 1-D DCT was used to transform the image planes to frequency domain instead of 2-D DCT (typically applied to images) for the purpose of compression/ decompression time reduction; the implementation time was reduced by 47:1 for the DCT step only. An adaptive scalar quantization step is applied on all image planes in RGB color model, but for YCbCr color model the quantization parameters where reduced by half for the chrominance plane while it is the same for the luminance planes to preserve the image quality, the zigzag scan was used to rearrange the data from non-zero low frequency coefficients to high frequency coefficients, where the adaptive shift coding was applied that performs Differential Pulse Coding Modulation on the DC coefficients for the entire image and Run Length Encoding for the AC coefficients for the entire image; the shift optimizer was applied to these coefficients to produce the exact number of bits needed to represent each one of them . The attained compression results indicated good efficiency in terms of compression gain while keeping the fidelity level above the acceptable level.
Keywords
:
Color Conversion, DPCM, Lossy Image Compression, Zigzag Scan, Run Length Encoding, DCT Compression.1.INTRODUCTION
As the existence of low-priced and distinct cameras, the demand for new techniques for processing the images has further grown [1]. The image data is compressed before storage and/or transmission. The reason for compressing data is to eliminate the excessive redundancy from the original image signal. Therefore, the amount of binary bits required to represent the image data contained within the original signal will be condensed. To obtain the ultimate compression ratio, there is a demand to understand the nature of the original signal in its binary representation, and also knowing the way that humans elucidate the binary information that the signal signifies [2].
Image compression is typically achieved in various representations which differ from their original domains. These domains are mostly spatio-frequency [1]. Approaches for digital image compression are of supreme importance in today’s wireless telecommunication and multimedia systems, where bandwidth is a significant commodity. Therefore, image compression
approaches are highly significant for reducing the amount of bits needed to represent an image sequence during transmission. This procedure supposed to be implemented without affecting the subjective quality of the transmitted image sequence [2]. The quality is requisite to reconstruct images according to their intended applications such as medical diagnosis and some other scientific fields. It is desirable that the reconstructed images be a perfect copy of the original image, this approach should be reversed as an information-preserving schemes. Such compression is called lossless compression.
Other applications may allow a certain amount of information loss such as motioned picture, video conference and television (TV). These types of compression referred to as lossy-compression [3].
3161 an edge block (a blocks that contains vital image data) the compression ratio is decreased to prevent loss of data, while in a non-edge block (a smooth blocks which does not have vital data), a high
compression ratio is attained. The new proposed block classification is used instead of the zigzag scan.
YAO et al. [5] have introduced image compression algorithm that depending on human visual system contrast characteristics where the image is converted into the YCbCr color space. Afterwards, the discrete cosine transform was applied, three quantization matrices are constructed to quantize the frequency spectrum coefficients of the images by combining the contrast sensitivity characteristics of human visual system (HVS). Finally Huffman coding is used to encode the quantized data.
Sun et al. [6] proposed a scheme for color image compression based on Laplacian Transparent Composite Model by developing a new probability model (LPTCM) to be applied to DCT coefficients, and also a hard decision quantization (HDQ) and soft decision quantization were designed based on (LPTCM).
Boucetta et al. [7] proposed an image compression approach based on DWT and generic algorithm where the correlations between RGB planes were reduced using generic algorithm to produce more suitable color space then the DWT was applied to each of the resultant plane from generic algorithm. Douak et al. [8] developed lossy image compression algorithm based on DCT combined with adaptive block scanning, after the conversion from RGB to YCbCr color space, the DCT transform was applied followed by an iterative phase (using the bisection method) including thresholding; then the adaptive block scanning was applied using a corresponding (n n) vector containing the maximum possible run of zeros. Jain et al. [9] proposed a method for image compression based on DCT and adaptive Huffman coding, where the image was divided into 4 4 or 8 8 blocks that were modified to correspond DCT matrix ranges, and then the entropy encoding were applied. Lakshmi et al. [10] have introduced an image compression method based on visual pattern vector quantization and adaptive block scanning whereas vector quantization is applied to the image followed by DCT transform and four types of block scanning vertical, horizontal, zigzag, and Hilbert. Mulla et al. [11] developed a scheme for image compression based on zigzag scan, 3-D DCT, and LDPC coding where the 2-D gray images where converted to 3-D formation(cube) of 8 8 8, quantization and zigzag scan were applied to produce 1-D vector matrix to be suitable for encoding in LDPC. Ponomarenko et al. [12]
presented a scheme for image compression based on DCT and partition schemes where the rate-distortion-based modified horizontal-vertical partition scheme was applied to partition the image into different block sizes; the statistical redundancy of the DCT quantized coefficients was reduced by a bit-plane dynamical arithmetical coding with a sophisticated context modeling. Finally, the blocking artifacts were removed using post filtering.
2.THE PROPOSED IMAGE COMPRESSION SCHEME
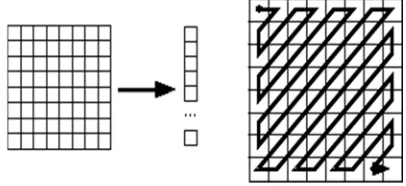
In the proposed image compression scheme, the original color image is an RGB color space image; the color space is converted to YCbCr to reduce the inter-pixel correlation, as a preprocessing step. Then the image is subdivided into 16 16 blocks, 1-D DCT is applied to compute the DCT coefficients for each block. Then, an adaptive scalar quantization is performed to produce the quantized DCT coefficients which are going to be scanned by zigzag scanning to reorder the coefficients from non-zero low frequency coefficients to high frequency coefficients. An adaptive shift encoder is used; it includes horizontal zigzag block scanning for the entire image; the DPCM is applied to encode the DC coefficients of the image, while Run length encoding is applied on AC coefficients. The final produced stream of bits is archived as the compressed image file; the inverse of each of the previously mentioned algorithms is used to reconstruct the image.
3162 While the conversion of YCbCr to RGB can be obtained using the following equations:
2.2 One-Dimensional Discrete Cosine Transform (1D_DCT)
1-D DCT is applied according to the equations listed below on each of 16 16 sub-blocks of the image. The output vector matrix consists of 256 DCT coefficients, which are arranged in a way such that the coefficients containing the important low frequency data lay on the top of the vector matrix, while those lay in the lower coefficients containing less useful information. The DCT coefficient at position (0) of the 1D vector matrix represents the average of the other 255 value in the vector matrix.
2.3 ADAPTIVE SCALAR QUANTIZATION
Quantization is the step at which the insignificant data is eliminated. The DCT is theoretically a lossless procedure. Where, the data can be recovered through the IDCT. During Quantization every element in the 16 16 DCT matrix is divided by a corresponding element Qs that is generated adaptively for each of the coefficients according to the following equation:
Where the Qs for RGB color model is calculated by the following equations:
And the Qs for YCbCr is calculated by the following equations for the luma band only, while the croma bands follow the (12) equation:
The quantization generated element enable the user to decide on quality and compression levels ranging from 1 to 8 for DC coefficients and 2 to 12 for AC coefficients multiplied by the scaling factor that ranging from 0.5 to 1, where the best quality gives the lowest compression ratio.
2.4 ZIGZAG SCAN
The zigzag is applied to convert the 16 x16 block from two dimension into one dimension by taking the value in the upper-left corner of location (0,0) and(0,1) then(1,0) and continue until the location (15,15) from 16x16 block as Fig that uses (8x8) block for illustration.
Fig. (1) Zigzag Scan operation illustration
2.5 ADAPTIVE SHIFT ENCODER
In adaptive shift encoder the DPCM is applied to DC coefficients to reduce their values for the overall image by performing the following equation:
Where, DCM is the vector matrix containing all the DC coefficients of the image. Then, run length encoding is applied to AC coefficients to reduce the number of values representing the image.
[image:3.612.315.518.328.421.2]3163 large code-words values of the input sequence elements. Using optimizer on each output stream coming from the previous stages makes the proposed system locally adaptive, because it considers as statistical attributes of the coming residue stream. The optimal values for these two code-words lengths should satisfy the criteria "they lead to the minimum total number of bits (TBits) needed to represent all sequence elements values". The applied shift coding optimizer uses the following equations to determine the total number of consumed bits.
2.6 FIDELITY CRITERIA
Quantifying the image quality is a challenging task, because numerous factors may affect the results. To conclude, estimate and compare image compression systems it is necessary to specify the quality of the reconstructed images. Since there are many factors that can affect the results, therefore, measuring the quality of vision is difficult and inaccurate. Four of the most evaluation criteria for image compression are Peak Signal to Noise Ratio (PSNR), Mean Square Error(MSE), Compression Gain(CG), and Compression Ratio (CR).
2.6.1 Mean Square Error (MSE)
For assessing the performance of lossy image compression method, the MSE was used as an important evaluation parameter to measure the quality of reconstructed image. It compares the original data with reconstructed data and then produces the level of distortion. The error function Er is calculated as a difference between the original and the reconstructed image
.
Where the MSE is defined as:
2.6.2 Peak Signal to Noise Ratio (PSNR)
Peak Signal to Noise Ratio (PSNR) can be computed by a logarithmic scale that depends on the mean squared error (MSE) between an original and the reconstructed image, relative to (2n −1)2 (the square of the highest-possible signal value in the image, where n is the number of bits per image sample).
2.7 COMPRESSION GAIN (CG)
The compression gain is calculated as:
Where the reference size is the size of the input sequence. Where the unit of the compression gain is called percent log ratio and is denoted by %.
2.8 COMPRESSION RATIO (CR)
It is crucial to know how much details can be castoff from the input image in order to preserve significant and vital information of the original data in the process of image compression. The Compression Ratio (CR) can be defined as:
CR is a measure of the reduction of input data size. It can be modified to get various qualities for the compressed image. The higher the CR can be applied, the more the details coefficients are discarded which means lower reconstruction quality of the image.
3. EXPERIMENTAL RESULTS AND DISCUSSION
The proposed scheme is tested on 3 different images (gray and true color); Table (1) shows the general characteristics for the tested images displayed in Fig.1; Table (2) shows the default quantization values: Q0 the quantization parameter for DC coefficients, Q1the quantization parameter for AC coefficients, and Alpha the scaling factor for AC coefficients also; applied to the tested images; the scheme compared with the results of applying the standard JPEG method on the same set of images shown in Fig.(2). The proposed algorithm was tested on a laptop computer with a Processor: Intel ® Core ™ i7 CPU Q740 @1.73 GHz, RAM 8.00 GB, x64-based processor). C# programming language was used to implement the proposed scheme.
a.Lena.bmp b.Barbara.bmp c.Peppers.bmp
3164
Table (1) the general characteristics for the tested images
Image Sample Lena Barbara Peppers
Bit Depth 24 8 24
Dimensions 256x256 256x256 256x256
Size (KB) 192 192 192
Table (2) the default values of the quantization step for the YCbCr proposed scheme
Parameter Default Values Range
Image Lena Gray Barbara Peppers
Q0 2 8 7 [1,8]
Q1 12 8 12 [2,12]
Alpha 0.9 0.8 1 [0.5, 1]
Block Size 16 16 16 [8,16]
Table (3) the default values of the quantization step for the RGB proposed scheme
Parameter Default Values Range
Image Lena Gray Barbara Peppers
Q0 1 1 7 [1,8]
Q1 6 5 12 [2,12]
Alpha 0.6 0.5 1 [0.5, 1]
Block Size 16 16 16 [8,16]
Where the effect of each parameter on compression ratio, PSNR, MSE, and Compression Gain along with compression and decompression time is shown in the following tables:
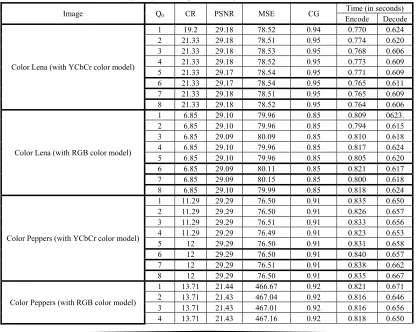
Table (4) The effect of Q0(DC quantization parameter) on fidelity criteria
Image Q0 CR PSNR MSE CG
Time (in seconds)
Encode Decode
Color Lena (with YCbCr color model)
1 19.2 29.18 78.52 0.94 0.770 0.624
2 21.33 29.18 78.51 0.95 0.774 0.620
3 21.33 29.18 78.53 0.95 0.768 0.606
4 21.33 29.18 78.52 0.95 0.773 0.609
5 21.33 29.17 78.54 0.95 0.771 0.609
6 21.33 29.17 78.54 0.95 0.765 0.611
7 21.33 29.18 78.51 0.95 0.765 0.609
8 21.33 29.18 78.52 0.95 0.764 0.606
Color Lena (with RGB color model)
1 6.85 29.10 79.96 0.85 0.809 0623.
2 6.85 29.10 79.96 0.85 0.794 0.615
3 6.85 29.09 80.09 0.85 0.810 0.618
4 6.85 29.10 79.96 0.85 0.817 0.624
5 6.85 29.10 79.96 0.85 0.805 0.620
6 6.85 29.09 80.11 0.85 0.821 0.617
7 6.85 29.09 80.15 0.85 0.800 0.618
8 6.85 29.10 79.99 0.85 0.818 0.624
Color Peppers (with YCbCr color model)
1 11.29 29.29 76.50 0.91 0.835 0.650
2 11.29 29.29 76.50 0.91 0.826 0.657
3 11.29 29.29 76.51 0.91 0.833 0.656
4 11.29 29.29 76.49 0.91 0.823 0.653
5 12 29.29 76.50 0.91 0.831 0.658
6 12 29.29 76.50 0.91 0.840 0.657
7 12 29.29 76.51 0.91 0.838 0.662
8 12 29.29 76.50 0.91 0.835 0.667
Color Peppers (with RGB color model)
1 13.71 21.44 466.67 0.92 0.821 0.671
2 13.71 21.43 467.04 0.92 0.816 0.646
3 13.71 21.43 467.01 0.92 0.816 0.656
[image:5.612.85.304.188.338.2] [image:5.612.99.515.411.743.2]3165
5 13.71 21.44 466.49 0.92 0.820 0.672
6 13.71 21.43 466.85 0.92 0.813 0.661
7 14.76 21.44 466.16 0.93 0.822 0.660
8 14.76 21.44 466.42 0.93 0.835 0.670
Gray Barbara (with YCbCr color model)
1 4 31.12 50.20 0.75 0.737 0.580
2 4 31.12 50.21 0.75 0.733 0.582
3 4 31.12 50.20 0.75 0.739 0.581
4 4 31.12 50.20 0.75 0.738 0.581
5 4 31.12 50.20 0.75 0.743 0.580
6 4 31.12 50.20 0.75 0.740 0.579
7 4 31.12 50.21 0.75 0.736 0.582
8 4 31.12 50.24 0.75 0.745 0.581
Gray Barbara(with RGB color model)
1 1.33 30.05 6j4.22 0.25 0.813 0.595
2 1.33 30.05 64.21 0.25 0.817 0.584
3 1.33 30.05 64.23 0.25 0.8813 0.593
4 1.33 30.05 64.21 0.25 0.820 0.589
5 1.36 30.05 64.21 0.26 0.824 0.590
6 1.36 30.05 64.23 0.26 0.814 0.590
7 1.36 30.05 64.23 0.26 0.813 0.591
8 1.36 30.05 64.27 0.26 0.819 0.589
Table(5) The effect of Q1(AC quantization parameter) on fidelity criteria
Image Q1 CR PSNR MSE CG
Time (in seconds)
Encode Decode
Color Lena (with YCbCr color model)
2 5.64 37.77 10.85 0.82 0.837 0.615
3 7.38 35.45 18.51 0.86 0.801 0.619
4 9.14 33.93 26.24 0.89 0.799 0.580
5 10.66 32.81 33.98 0.90 0.743 0.585
6 12.8 31.98 41.18 0.92 0.743 0.585
7 14.76 31.29 48.25 0.93 0.724 0.585
8 16 30.73 54.92 0.93 0.729 0.587
9 17.45 30.26 61.20 0.94 0.725 0.585
10 17.45 29.85 67.19 0.94 0.738 0.584
11 19.2 29.49 73.00 0.94 0.723 0.589
12 21.33 29.18 78.51 0.95 0.735 0.583
Color Lena (with RGB color model)
2 3.04 35.57 18.01 0.67 0.873 0.612
3 3.84 32.96 32.87 0.73 0.872 0.613
4 4.8 31.00 51.63 0.79 0.828 0.597
5 5.64 30.00 64.87 0.82 0.787 0.592
6 6.85 29.10 79.96 0.85 0.772 0.591
7 7.38 28.38 94.28 0.86 0.769 0.592
8 8.34 27.87 106.08 0.88 0.758 0.594
9 9.14 27.47 116.41 0.89 0.753 0.593
10 10.10 27.04 128.37 0.90 0.749 0.591
11 10.66 26.69 139.29 0.90 0.750 0.595
12 11.29 26.41 148.51 0.91 0.738 0.590
Color Peppers (with YCbCr color model) 2 3.2 37.85 10.64 0.68 0.890 0.609
3 4.26 35.33 19.05 0.76 0.870 0.595
4 5.48 33.65 28.00 0.81 0.810 0.593
5 6.62 32.51 36.47 0.84 0.783 0.590
6 7.11 31.60 44.98 0.85 0.775 0.594
7 8.72 30.85 53.45 0.88 0.773 0.588
8 9.6 30.23 61.54 0.89 0.769 0.595
9 10.66 29.74 68.95 0.90 0.766 0.595
10 11.29 29.29 76.50 0.91 0.765 0.594
11 12 28.88 83.98 0.91 0.757 0.592
3166 Color Peppers (with RGB color model)
2 3.09 23.72 275.89 0.67 0.850 0.615
3 4.36 23.35 300.58 0.77 0.844 0.604
4 5.33 22.83 338.74 0.81 0.790 0.591
5 6.62 22.46 368.92 0.84 0.765 0.592
6 7.68 22.11 399.46 0.86 0.766 0.589
7 8.72 22.00 410.24 0.88 0.756 0.588
8 9.6 21.71 437.92 0.89 0.743 0.589
9 10.66 21.63 446.52 0.90 0.739 0.586
10 12 21.49 461.03 0.91 0.735 0.589
11 12.8 21.47 463.15 0.92 0.731 0.587
12 14.76 21.44 466.16 0.93 0731. 0.585
Gray Barbara (with YCbCr color model)
2 1.68 40.44 5.87 0.40 0.855 0.598
3 2 37.60 11.28 0.5 0.811 0.588
4 2.28 35.70 17.46 0.56 0.823 0.587
5 2.66 34.32 23.99 0.62 0.770 0.585
6 3.04 33.25 30.74 0.67 0.766 0.582
7 3.36 32.40 37.37 0.70 0.758 0.588
8 3.76 31.72 43.75 0.73 0.743 0.581
9 4 31.12 50.21 0.75 0.747 0.587
10 4.57 30.58 56.85 0.78 0.749 0.586
11 4.92 30.14 62.93 0.79 0.735 0.581
12 4.92 29.75 68.78 0.79 0.739 0.581
Gray Barbara (with RGB color model)
2 0.70 35.41 18.70 -0.42 1.00 0.600
3 0.94 32.84 33.76 -0.06 0.889 0.596
4 1.14 31.20 49.31 0.12 0.868 0.595
5 1.33 30.05 64.22 0.25 0.816 0.587
6 1.52 29.13 79.38 0.34 0.818 0.592
7 1.77 28.43 93.14 0.43 0.798 0.587
8 1.93 27.86 106.36 0.48 0.785 0.590
9 2.20 27.35 119.56 0.54 0.777 0.586
10 2.46 26.91 132.22 0.59 0.772 0.588
11 2.56 26.53 144.33 0.60 0.756 0.584
12 2.90 26.21 155.57 0.65 0.748 0.584
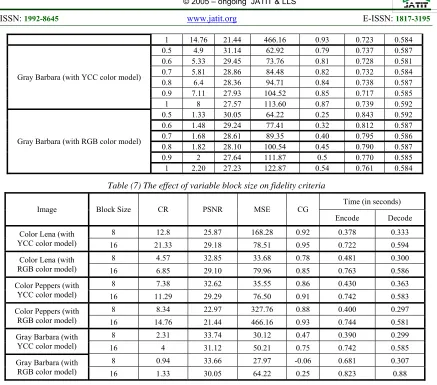
Table(6) The effect of (AC coefficients quantization scaling factor)on fidelity criteria
Image CR PSNR MSE CG Time (in seconds)
Encode Decode
Color Lena (with YCbCr color model)
0.5 14.76 31.21 49.16 0.93 0.769 0.597
0.6 14.76 30.55 57.26 0.93 0.746 0.596
0.7 17.45 30.01 64.75 0.94 0.766 0.597
0.8 19.2 29.56 71.85 0.94 0.725 0.589
0.9 21.33 29.18 78.51 0.95 0.721 0.586
1 21.33 28.84 84.92 0.95 0.722 0.588
Color Lena (with RGB color model)
0.5 5.81 29.95 65.75 0.82 0.766 0.592
0.6 6.85 29.10 79.96 0.85 0.768 0.592
0.7 7.38 28.50 91.69 0.86 0.764 0.585
0.8 8 28.06 101.57 0.87 0.749 0.585
0.9 8.34 27.59 113.20 0.88 0.748 0.588
1 9.14 27.28 121.53 0.89 0.743 0.586
Color Peppers (with YCbCr color model)
0.5 9.14 30.57 56.89 0.89 0.776 0.589
0.6 10.66 29.87 66.87 0.90 0.745 0.586
0.7 11.29 29.29 76.50 0.91 0.753 0.585
0.8 12.8 28.78 86.02 0.92 0.745 0.585
0.9 13.71 28.35 94.96 0.92 0.745 0.584
1 14.76 27.97 103.61 0.93 0.734 0.584
Color Peppers (with RGB color model)
0.5 8.34 22.12 398.39 0.88 0.744 0.591
0.6 9.6 21.77 432.04 0.89 0.742 0.590
0.7 10.66 21.66 443.24 0.90 0.742 0.588
0.8 12 21.62 447.45 0.91 0.740 0.585
3167
1 14.76 21.44 466.16 0.93 0.723 0.584
Gray Barbara (with YCC color model)
0.5 4.9 31.14 62.92 0.79 0.737 0.587
0.6 5.33 29.45 73.76 0.81 0.728 0.581
0.7 5.81 28.86 84.48 0.82 0.732 0.584
0.8 6.4 28.36 94.71 0.84 0.738 0.587
0.9 7.11 27.93 104.52 0.85 0.717 0.585
1 8 27.57 113.60 0.87 0.739 0.592
Gray Barbara (with RGB color model)
0.5 1.33 30.05 64.22 0.25 0.843 0.592
0.6 1.48 29.24 77.41 0.32 0.812 0.587
0.7 1.68 28.61 89.35 0.40 0.795 0.586
0.8 1.82 28.10 100.54 0.45 0.790 0.587
0.9 2 27.64 111.87 0.5 0.770 0.585
1 2.20 27.23 122.87 0.54 0.761 0.584
Table (7) The effect of variable block size on fidelity criteria
Image Block Size CR PSNR MSE CG Time (in seconds)
Encode Decode
Color Lena (with YCC color model)
8 12.8 25.87 168.28 0.92 0.378 0.333
16 21.33 29.18 78.51 0.95 0.722 0.594
Color Lena (with RGB color model)
8 4.57 32.85 33.68 0.78 0.481 0.300
16 6.85 29.10 79.96 0.85 0.763 0.586
Color Peppers (with YCC color model)
8 7.38 32.62 35.55 0.86 0.430 0.363
16 11.29 29.29 76.50 0.91 0.742 0.583
Color Peppers (with RGB color model)
8 8.34 22.97 327.76 0.88 0.400 0.297
16 14.76 21.44 466.16 0.93 0.744 0.581
Gray Barbara (with YCC color model)
8 2.31 33.74 30.12 0.47 0.390 0.299
16 4 31.12 50.21 0.75 0.742 0.585
Gray Barbara (with RGB color model)
8 0.94 33.66 27.97 -0.06 0.681 0.307
[image:8.612.91.528.60.445.2]3168
3169 The above results are conducted by changing the values of four parameters; where three of them are fixed and the value of the fourth parameter was changed to define its effectiveness on the compression scheme performance. The results listed in above tables indicate the following remarks:
The color space conversion from RGB to YCbCr shows better performance where the compression ratio was increased about 52% and the PSNR decreased about 9% (for the highest compression ratio encountered for each of the color models).
The Q0 (DC quantization parameter) is slightly affecting the system performance measures (compression ratio, compression gain, PSNR, and MSE).
Q1 and (AC quantization parameters) are causing an explicit change in all system performance measures that the greater their values are the higher the compression ratio and lower PSNR.
while the decrease of Block Size leads to
increase in the PSNR value, while the attainted compression gain is decreased insignificantly, the conducted results also show that an obvious reduction in encoding and decoding time when the block size was reduced.
Also, it is obvious that a tradeoff among system performance measures was achieved when Block sizeis set to (16).
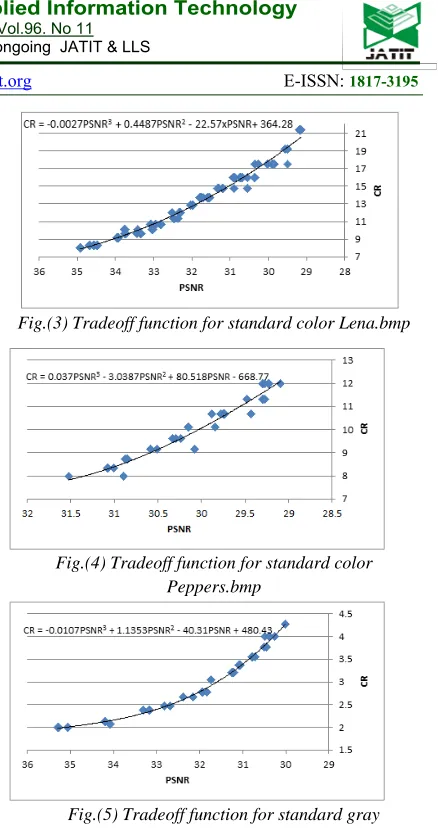
The conducted results have shown an obvious tradeoff between PSNR that represents the visual quality and compression ratio, the tradeoff function is shown in figures (3), (4), and (5) for the tested images Lena.bmp, Barbara.bmp, and Peppers.bmp respectively:
Fig.(3) Tradeoff function for standard color Lena.bmp
Fig.(4) Tradeoff function for standard color Peppers.bmp
Fig.(5) Tradeoff function for standard gray Barbrah.bmp
3.1 THE PROPOSED SCHEME CONDUCTED RESULTS COMPARED TO JPEG
The attained results of the proposed system are compared to the universal standard JPEG regarding compression ratio, visual quality measures, along with compression and decompression time as evaluation metrics, the results are shown in tables (8), (9), and (10) respectively:
Table (8) The proposed scheme compared to color Lena.bmp
DT ET MSE PSNR CR
Quality Method
Tested Image
0.902 0.063 54.44 30.77 23.35 20%
JPEG Standard
Color Lena
0.889 0.185 44.93 31.6 21.59 40%
0.838 0.064 22.72 34.56 10.32 80%
DT ET MSE PSNR CR
Q1 Q0
Block Size
Proposed Scheme 16 8 11 1 21.33 29.14 79.11 0.776 0.622
[image:10.612.312.531.38.453.2] [image:10.612.102.500.594.674.2]3170
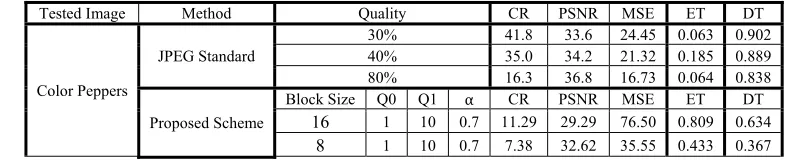
Table (9) The proposed scheme compared to color Peppers.bmp
DT ET MSE PSNR CR Quality Method Tested Image 0.902 0.063 24.45 33.6 41.8 30% JPEG Standard Color Peppers 0.889 0.185 21.32 34.2 35.0 40% 0.838 0.064 16.73 36.8 16.3 80% DT ET MSE PSNR CR α Q1 Q0 Block Size
Proposed Scheme 16 1 10 0.7 11.29 29.29 76.50 0.809 0.634
0.367 0.433 35.55 32.62 7.38 0.7 10 1 8
Table (10) The proposed scheme compared to gray Barbarah.bmp
DT ET MSE PSNR CR Quality Method Tested Image 0.888 0.082 53.74 30.82 6.5 30% JPEG Standard Gray Barbara 0.935 0.192 10.54 37.89 3.28 80% 0.899 0.149 3.53 42.65 2.35 90% DT ET MSE PSNR CR α Q1 Q0 Block Size
Proposed Scheme 16 8 0 0.8 5.33 29.71 69.47 0.785 0.622
0.382 0.635 64.12 30.06 4.75 1 12 8 8 4. CONCLUSIONS
In this paper an enhanced image compression scheme is presented using 1-D DCT, and the proposed adaptive shift coding. For image compression the time is one of the most important issues. The proposed technique reduced the compression and decompression time compared to standard JPEG, that the 2-D DCT transform is replaced by 1-D DCT that reduces the transform time performance significantly. A good compression ratio is achieved with the images containing low ratio of redundancy.
The proposed scheme was applied to images represented using RGB and YCbCr color models, the use of latter color model showed an overall enhancement in system performance measures. The use of 1-D DCT reduces the
compression/decompression time significantly, which reduces the processing time.
Using adaptive scalar quantization where the quantization step is adapted according to coefficients positions that lays lower values of quantization parameters to the coefficients containing higher details leads to rise the compression ratio and preserve the visual quality. Adaptive shift coding was modulated to obtain
the least number of bits to represent the coefficients, where:
a.Horizontal zigzag block scanning was applied on the tested image because the adjacent DC coefficients of each block is highly correlated so their values are close enough to be reduced by DPCM to give much less values than the original ones.
b.Using DPCM to DC coefficients reduces the high values of those coefficients which requires less bits to represent them.
c.Applying Run Length Encoding to AC coefficients reduces the number of bits to represent each value once and an associated number as the sequential run count of the same value instead of representing each coefficients individually.
d.The adaptive shift coding is applied to the three types of resultant array for each image plane (i.e.; DPCM manipulated DC coefficients array, AC non- sequentially repeated AC coefficients values, and the AC runs array that corresponds each value in the AC values array) to obtain the exact number of bits to represent each value in the previously mentioned arrays.
REFERENCES
[1] J. Mukhopadhyay, Image and Video Processing in the Compressed Domain, NY, USA: Taylor and Francis Group, LCC, 2011. [2] P. C. J. S. Lajos Hanzo, Video Compression
and Communications, Wiely, 2011.
[3] H. S. Yun Q. Shi, Image and Video Compression for Multimedia Engineering: Fundamentals, Algorithms, and Standards, CRC Press Francis and Taylor Groupe, 2008. [4] W. M. Abd-Elhafiez, U. S. Mohammed and
A. Kilicman, "On a high performance image compression technique," Science Asia, no. 39,
p. 416–422, 2013.
[image:11.612.104.500.105.187.2]3171 Visual Contrast Sensitivity Characteristics,"
PHOTONIC SENSORS , vol. 7, no. 1, pp.
72-81, 2017.
[6] C. Sun and E.-H. Yang, "An Efficient DCT-Based Image Compression System DCT-Based on Laplacian Transparent Composite Model,"
IEEE TRANSACTIONS ON IMAGE
PROCESSING, vol. 24, no. 3, pp. 886-900,
2015.
[7] A. Boucetta and K. E. Melkemi, "DWT Based-Approach for Color Image Compression Using Genetic Algorithm,"
Springer-Verlag Berlin Heidelberg, pp.
476-484, 2012.
[8] F. Douak, RedhaBenzid and NabilBenoudjit, "Color
imagecompressionalgorithmbasedontheDCTt
ransformcombinedto an
adaptiveblockscanning," Int.
J.Electron.Commun.(AEU¨ ), vol. 65, pp.
16-26, 2011.
[9] D. K. Jain, D. Gaur, K. Gaur and N. Jain, "Image Compression using Discrete Cosine Transform and Adaptive Huffman Coding,"
International Journal of Emerging Trends & Technology in Computer Science (IJETTCS),
vol. 3, no. 1, pp. 90-94, 2014.
[10] Lakshmi.H and M.A.P.Manimekalai, "Color Image Compression Using Visual Pattern Vector Quantization Combined To An Adaptive Block Scanning," in 2014 International Conference on Electronics and Communication Systems (ICECS -2014),
Feb.13 -14,2014, Coimbatore, INDIA, 2014.
[11] A. Mulla, J. Baviskar, A. Baviskar and C. Warty, "Image Compression Scheme Based on Zig-Zag 3D-DCT and LDPC Coding," in
International Conference on Advances in Computing,Communications and Informatics
(ICACCI), 2014.
[12] N. N. Ponomarenko, K. O. Egiazarian, V. V. Lukin and J. T. Astola, "High-Quality DCT-Based Image Compression Using Partition Schemes," IEEE SIGNAL PROCESSING