Impact of Foreign Presence on the Capital
Structure of Four Wheeler Companies in India
Vidyasagar Mani Thota Department of Management & Commerce Sri Sathya Sai Institute of Higher Learning,
Prasanthi Nilayam 515134, India
Dr. B.Sai Griridhar Head of the Department
Department of Management & Commerce Sri Sathya Sai Institute of Higher Learning,
Prasanthi Nilayam 515134, India
Abstract
Capital structure is one of the most complex decision in the area of corporate finance. Due to its Interrelationship with other financial decision variables and ability to influence the shareholder value, it becomes a critical area to study. It is a vast area consisting of different sources of capital, conflicting theories and an endless debate about the optimal mix. However, FDI as a source of capital in India is underexplored. Using a theoretical model, this paper analyses whether an increase in foreign presence, affects the leverage of domestic firms. The model is applied to explore the link between foreign presence and leverage with the help of secondary data.
This study also tests the determinants of capital structure in the passenger cars and utility vehicles segment of the Indian automobile industry. The variables considered to test were business risk, growth opportunities, profitability, and foreign presence. Using the OLS regression model, the empirical analysis reveals that foreign presence has a negative impact on the passenger cars and utility vehicles segment of the Indian automobile industry
Keywords: Capital structure, Foreign Presence, Spillovers.
1 INTRODUCTION
Capital structure is said to be the proportion of debt and equity on a firm’s balance sheet. A levered capital structure increases the profitability but comes with a considerable level of financial risk. Therefore an appropriate mix of debt and equity becomes crucial as it affects the bottom-line of the company. A financing mix which helps a firm to achieve its objective of wealth maximisation is known to be the firm’s optimum capital structure. There are various factors and sources of capital that affect this optimum level of capital structure which must be considered while the financing mix is being decided.
One of the sources of capital that is gaining importance in recent times in developing countries like India and world over is foreign capital. Foreign capital in the form of foreign direct investment (FDI) is being preferred due to the associated benefits that it provides to the companies of the host country. FDI means investment made by foreign investors directly in the operations of the business in another nation. In this form of investment, the investor gains a controlling stake or ownership in in the business in which the investment is made. These associated benefits with FDI in economics theory are known as spillovers. Spill overs are secondary effects that follow from a primary effect. Policy makers tend to believe that the host country benefits from FDI through knowledge transfer from a multinational firm which in turn helps to increase the performance and productivity of the domestic firms. Due to this reason, FDI is preferred by many countries and these countries draft policies in a way to attract higher FDI. They can be tangible like increased productivity due to better technology or intangible like patents, brand value, management skills etc. However spillovers need not always be positive in nature. Negative externalities can exist if FDI impacts the competition adversely.
1.1 Statement of the problem
The entry of foreign firms can lead to increased competition in the domestic country. This can affect the profitability of domestic firms by the foreign firms eating into their market share. Increased competition can also restrict the growth opportunities of domestic firms. Since, Profitability and growth opportunities are important determinants of capital structure of a firm, FDI can impact the capital structure of domestic firms. Therefore, this study attempts to explore and determine the relationship between the foreign direct investment (FDI) and the capital structure of domestic firms in the Indian automobile industry.
1.2 Scope of the study:
This study restricts to only the passenger cars and utility vehicles segment of the Indian automobile industry. The independent variables considered in the study are business risk, growth opportunities, profitability and foreign presence. The study was conducted for the period 2000-2014.
1.3 Objectives of the study:
The main objective of the study is to determine the impact of foreign direct investment (FDI) (referred as foreign presence) on the capital structure of the domestic firms in select segments of the automobile industry.
2 THEORETICAL MODEL
Assume an industry with a number of foreign firms operating in it. This is denoted by γ. The industry also consists of domestic firms. That means the proportion of domestic firms can be represented as 1- γ. Now, if a domestic firm with wealth (W), competing with a foreign firm in the same industry plans to expand its capacity. So, in order to increase the production at time 1, it would have to make an investment at time 0. The investment would be financed by a mix of reserves and debt. The debt (D) is the difference between the investment required and the existing reserves (W) with the firm. The production depends on the investment and the investment depends on the borrowing (D). Therefore, debt indirectly is a part of the production. This can be written in the form of an equation (I) = . This is referred to as the production function, where captures the effect of foreign presence (FDI) on domestic firms. The model assumes that foreign presence is a source of positive externality or have positive spill over effects on the domestic firms in the industry. If =0 it means that there are no foreign firms in the industry and hence there is no productivity spill over effect, whereas if =1 it implies that all firms are foreign. The basic assumption of this model is that 0< < 1. This can be justified because; if the level of foreign presence is less than 0 it is insignificant for the study. If the level of foreign presence is greater than 1 also, it implies that no domestic firms exist. In the production function, captures the influence of several other aspects that affect the production process. These can be labour availability, wage rates, level of technology of the domestic firms, industrial relations issues and so on.
An increase in would imply an increase in foreign direct investment. Also as increases the domestic firms tend to experience higher levels of positive externality. These spill overs can occur due to superior technology and management skills that the foreign firms generally tend to possess. Parameter A captures the impact of other factors that enter into (and affect) the production process, such as the level of domestic technology and so on.
After the production is completed, at a later date, say at time 2, the firm would sell the products produced and realise a cash flow of amount x. the firm then has the ability to pay a part or entire amount of debt taken depending on the size of the cash flow. In reality, cash flow is subject to fluctuations based on the market movements. For the purpose of theory, the model assumes the size of the cash flow to be uniformly distributed over the support (0, a). Therefore the cash flow x can be viewed as an annuity.
Debt (D) carries a deadweight cost (C) that is known as cost of distress or bankruptcy cost. Given this scenario, the firm would like to choose the level of debt (D) and investment (I) to maximise its value. This can be written as follows:
Maximise
with respect to I and D Subject to
By solving the above optimization problem, the required level of debt can be written as follows:
Equation 1.3-1
(1)
Equation (1) says that domestic firms prefer debt if the possibility of cash flow is high (i.e. a must be high). Therefore it can be said that debt and cash flow have a positive relationship.
From equation one, it can be said that must always be >1. This is because, if < 1 the value of increases and this means that debt is negative. This is not possible. Therefore > 1 is a required condition. Also the distress cost has a negative impact on debt only if > 1.
If = 0, it implies that D tends to be equal to a.
Because A>1, ; is always greater than one and hence the optimal debt is positive only if a > C. Therefore, cannot be greater than a.
Eq. (1) can be used to establish a relationship between foreign presence and the optimal debt of a domestic firm as follows:
Equation 1.3-2
Equation (2) shows that there is a positive relationship between foreign presence and optimal debt. This relationship is based on the impact of distress costs on debt. Equation (2) indicates that if the distress costs are low, foreign presence will have a lesser impact on debt.
Since production is dependent on the amount of investment, it is important to study the relationship between investment and debt. Subjecting to the constraint,
. , the relationship between debt and investment can be written as follows:
Equation 1.3-3
(3)
By differentiating Equation (3) with respect to γ, the relationship between foreign presence and optimal investment can be derived as follows:
Equation 1.3-4
(4)
Given that A > 1, Equation (4) suggests a positive relationship between foreign presence and investment made. To summarise, foreign presence leads to rise in the levels of debt as well as investment. This means that the impact of foreign presence on firm leverage is not clear.
However, if the increase in debt is greater than the increase in investment, it can be said that foreign presence leads to increase in leverage. In case, foreign presence leads to a higher increase in investment, it would mean that it has less impact on debt. If the impact of foreign presence is equal on both debt and investment, there is no change in the firm leverage.
Using equations (1) and (3), the optimal value of firm leverage can be written as follows:
Equation 1.3-5
(5)
Equation (5) indicates that impact of foreign presence on leverage is dependent on the various factors that determine the maximum possible cash flow (i.e. a) and the distress costs (C) related to debt (D). Therefore this relationship is sensitive to fluctuations. These factors are invisible and cannot be quantified easily. This brings in the importance of empirical evaluation of the relationship between foreign presence and firm leverage.
In order to empirically evaluate the impact of foreign presence on the leverage of domestic firms, Taylor's expansion is used and by linearizing Equation (5) at (A0, C0, W0, 0) Equation (6) is derived:
Equation 1.3-6
(6) Where, , , , , ,
| , ,
| , , ,
| , , ,
| , , , ,
And denotes the functional form of equation (5).Based on Equation (6), the following empirical model can be specified
Equation 1.3-7
(7)
3 LITERATURE REVIEW: 3.1 FDI and FDI linked spill overs:
The paper (Haskel, et al., 2007) seeks to answer two major questions:
1) Are there productivity spill overs from foreign direct investment to home firms?
2) If so, how much should the host countries be ready to pay to draw the foreign direct investment?
The findings for these two questions were that, there is a significant and positive relationship between a domestic plant’s productivity and the foreign portion of employment in that plant’s industry. But the per-job value of spill overs was found to be less than the per-job incentives given by the governments.
The channels of productivity spill overs for example, access to suppliers and labour market, turnover etc. are however to be studied in depth using direct spill over measures.
(Girma, et al., 2014) shows that direct effects vary in accordance with the fraction of foreign firms present in the cluster. Also, the spill over effects fluctuates through the clusters. The major finding of this study was that spill over effects on domestic as well as other foreign firms are negative up to a threshold level of 40%. After this level they become less negative or positive.
(Chaudhuri, et al., 2013)This paper establishes that FDI into India has increased significantly from the year 2000 and the major sectors which benefited from this were the automobiles, drugs and pharmaceuticals and the chemical industry. The FDI inflow was mostly domestic market driven, cost efficiency seeking and export oriented.
The results of this study also indicate that FDI is negatively impacted by tariffs, Import and R&D intensity but positively by concentration of market power.
Sectors with market imperfections and opportunities to exploit ownership advantages have attracted higher FDI. Sectors with high costs and import oriented were found to be less attractive to the foreign investors.
3.2 Capital structure:
The study (Bradley, et al., 2009)takes a more direct method to the concept of an optimal capital structure and is a complementary to many of the previous studies. The results have it that the optimal firm leverage is inversely related to the expected costs of financial distress and to the amount of non-debt tax shields. The study reveals the existence of evident industry influences across the firm leverage ratios. The study also verifies that Volatility of firm earnings is an important but inverse determinant of firm leverage. A somewhat puzzling finding is the strong direct relation between firm leverage and the relative amount of non-debt tax shields. This contradicts the theory that focuses on the substitutability between non-debt and debt tax shields.
The paper (Anwar & Sun, 2015) attempts to verify whether there is and measure the impact of foreign direct investment (FDI) on domestic firms. The FDI consequently results in a change in the capital structure of domestic firms because of its impact on profitability and growth of these firms. Due to increased competition from foreign firms, the domestic firms may choose to scale up their investment to increase productivity/output. Usually this increase in investment is done with the help of debt. Already known, cost of debt is cheap but is extremely risky in case of loss. So, the capital structure of a domestic firm changes regardless of the source of the additional investment. The effects of this change caused by the foreign presence are studied in this paper. This paper also examines the influence of foreign presence independently on private and state owned firms and also segregates the study based on different sectors. The findings of the study were that the foreign presence significantly impacted the leverage of domestic firms in a negative manner. This was especially strong for the private firms. However the sectorial study showed that different sectors had experienced different magnitudes of the impacts.
4 METHODOLOGY
4.1 Nature of the study:
This is an empirical study and uses the time series methodology. The time period for the study spans for a period of fifteen years from 2000 to 2014. The time period reflects the impact of the reforms made during the 1991 reforms. The study uses the ordinary least square (OLS) method of regression to check the impact of the selected variables in leverage.
4.2 Hypothesis:
In line with the objectives of the study, the following null hypothesis have been formulated to be tested at a 10% level of significance.
Ho1: Business risk does not affect the leverage of a company.
Ho2: Growth opportunities do not affect the leverage of a company. Ho3: Profitability does not affect the leverage of a company. Ho4: Foreign presence does not affect the leverage of a company.
Dependent variable:
Financial leverage: Financial leverage refers to the percentage of assets that are financed by debt. This is
measured by the debt to equity ratio (D/E) of the company. Higher debt would mean higher financial leverage and the interest expense will also increase as a result. Financial Leverage can do well and harm to a business subject to the economic cycle and performance of the company. If a company gives higher rate of return (ROI) than the interest rate (i.e. rate of return expected by the lenders) it is paying, the financial leverage is worth it. However, In the case of a downturn, higher leverage can take a business to a most awful situation like bankruptcy.
The table 4.2-1, provides a brief description of the variables and their expected impact on leverage.
Table 4.2-1 INDEPENDENT VARIABLES:
VARIABLE DESCRIPTION
EXPECTED SIGN (for both passenger
Cars and two and three wheelers)
Ln Business risk
(The natural log of business risk)
Business risk (volatility in earnings) implies uncertainty in profits or danger of loss and the events that could pose a risk due to some unforeseen events in future, which causes business to fail. This is measured by variation in EBIT. A firm with high business risk can suffer from low level of EBIT or operating profit and hence may not be able to meet the debt obligations and thus attracts very few or no lenders. Generally, it is expected to have a negative relationship with leverage.
-ve
Ln growth opportunities (The natural log of growth opportunities.)
Growth opportunities refer to the growth prospects of a firm. To exploit a growth opportunity available, the firm would need to make a significant investment and for this purpose funds are required in the right proportion to avoid agency costs (MYERS, 1977). Generally, high growth firms attract debt as returns can be high and debt is the cheapest source of capital. This variable is measured by change in the sales (year on year) of the company.
+ve
Ln profitability (The natural log of profitability.)
Profitability is a measure of the ability of a firm assets to generate profits. Firm profitability is expected to affect the leverage. The pecking order theory suggests that firms will generally tend to use internal sources of funds before opting for external sources to finance an investment (MYERS, 1984). So, according to this theory, high profitable firms will lean towards to having lower level of leverage than less profitable firms. It indicates investing profit. This is measured by the ratio of EBIT to total assets.
+ve
Ln foreign presence (The natural log of foreign presence.)
This variable measures the degree of foreign presence in the industry. Foreign presence refers to the share of assets owned by the foreign firms in the domestic firm. The entry of foreign firms also increases competition in the domestic market which can affect the profitability of domestic firms. Increased competition can also restrict the growth opportunities of domestic firms. Since, profitability and growth opportunities are important determinants of a firm’s capital structure, intuitively, FDI can impact the capital structure of domestic firms. It is measured by dividing the share of assets owned by the foreign firms to the total assets in the industry.
4.3 Sampling procedure and sample:
The Indian automobile industry is one of the high performing industries of the Indian economy and contributes around 7.1% to the country’s GDP. This has contributed largely in making India a prime destination for many international players in the automobile industry who wish to set up their businesses in India. The automobile industry in India was opened up to foreign investments in the year 1991. Since then, hundred percent Foreign Direct Investment (FDI) is allowed in the industry. This makes it a good option to study the impact of foreign firms. Also, the automobile industry has been in the top ten sectors attracting FDI into the country for more than the last 10 years.
Table 4.3-1 FDI IN AUTOMOBILE INDUSTRY 2006-2015 YEAR US $mn
2006-2007 276 2007-2008 675 2008-2009 1152 2009-2010 1236 2010-2011 1299 2011-2012 635 2012-2013 900
Figure 4.3-1 FDI IN AUTOMOBILE INDUSTRY 2006-2015
The study being consumer focused views the automobile product as a consumer durable and focuses only on the passenger cars and utility vehicles segment of the Indian automobile industry. The firms selected for the purpose of this study were on the basis of data available.
The time period for the study is fifteen years from 2000 to 2014. The time period chosen reflects the impact of LPG (liberalization, privatization and globalization) reforms made in 1991. The automobile industry began to grow during this period and attracted more FDI in the form of entry by many foreign players.
The firms analyzed include a mixture of both foreign and domestic firms. The firms selected for the study are given below.
Table 4.3-2 SAMPLE COMPANIES No. PASSENGER CARS and UTILITY VEHICLES
4.4 Data collection:
The data required for the purpose of this study was purely secondary in nature and was sought and compiled largely from the database of capitaline. Other sources of data included the websites of reserve bank of India (RBI), department of industrial promotion policy (DIPP) and foreign investment promotion board (FIPB).
4.5 Limitations of the study:
One of the key limitations of this study was Data availability. Many firms that reflected foreign presence and are significant contributors to the automobile industry were excluded for the reason of lack of data. While some of them entered India during the period of study, few exited during the period of study and thus were excluded from the sample.
Although the impact of the variables is different on the passenger cars and the utility vehicles, the study considers the company in its entire project range. The total risk of the company is seen rather than the differences in the nature of these two product categories. Also, the data cannot be sought separately for the two.
The study is limited only to the passenger cars and utility vehicles segment of the Indian automobile industry. The results of the study are not applicable to the two and three wheelers, Auto-Tractors, auto-ancillaries and the heavy commercial vehicles segments of the industry.
5 ANALYSIS
5.1 Results of unit root test
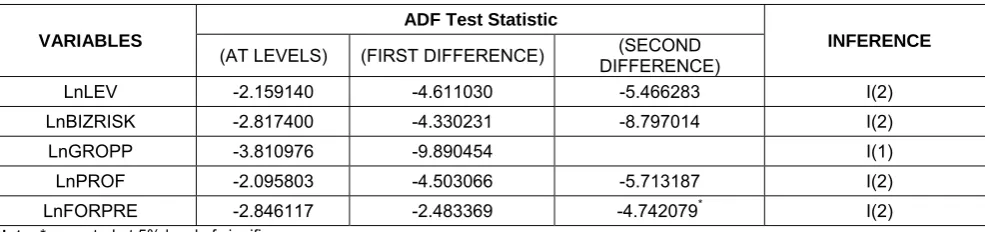
From the table 5.1-1 it can be established that all the variables are found to be non-stationary and all the variables are integrated of order 2 except LnGROPP; which is integrated at order 1. Notations and variables used for empirical analysis:
LEV = Leverage
BIZRISK = Business risk GROPP = Growth opportunities PROF = Profitability
FORPRE = Foreign presence
Table 5.1-1 ADF TEST RESULTS FOR THE PASSENGER VEHICLES AND THE UTILITY VEHICLES SEGMENT
VARIABLES
ADF Test Statistic
INFERENCE (AT LEVELS) (FIRST DIFFERENCE) DIFFERENCE) (SECOND
LnLEV -2.159140 -4.611030 -5.466283 I(2)
LnBIZRISK -2.817400 -4.330231 -8.797014 I(2)
LnGROPP -3.810976 -9.890454 I(1)
LnPROF -2.095803 -4.503066 -5.713187 I(2)
LnFORPRE -2.846117 -2.483369 -4.742079* I(2)
Note: * accepted at 5% level of significance
5.2 Impact of variables on the leverage:
Equation 5.2-1 Equation for the passenger cars and utility vehicles segment.
From the equation 5.2-1 for the passenger cars and utility vehicles, it can be observed that business risk has a negative or inverse relationship with leverage. This is consistent with the finance theory as, increase in business risk would reduce the ability of the firm to attract borrowed funds. Growth opportunities also shows a negative relationship with leverage which mean that although a firm has high growth opportunities, due to relatively higher business risk, it would borrow less amount of money. With high growth opportunities comes high business risk.
Profitability and leverage have an expected positive relationship. This means that, as firms become profitable, their credit worthiness increases as a consequence of increase in sales and subsequent rise in their cash flows. They become good opportunities for lenders of funds.
The last variable; foreign presence, indicates a negative relationship with the dependent variable, which means that an increase in the foreign presence would lead to decrease in leverage of a firm. Thus, it indicates that although a firm has high growth opportunities, due to relatively high business risk, it would borrow less/no amount of money and use the funds from coming due to foreign presence and if it becomes profitable in the process, its can resort to debt and leverage increases.
The R2 for this data is 0.86 which tells that the predictability of the model is good and the 2(adjusted R2) which
is 0.766 tells that 76% of the variation in the dependent variable i.e. leverage is explained by the explanatory or independent variables in the model. The DW statistic is 1.19. It may be acceptable as it is below 2 and but this means there may be an autocorrelation problem in the model.
5.3 Hypothesis test results:
Table 5.3-1 p-values FOR THE PASSENGER CARS AND UTILITY VEHICLES SEGMENTS
VARIABLES p-VALUES LnBIZRISK 0.2462 LnGROPP 0.9598 LnPROF 0.0422 LnFORPRE 0.0067
From the results of the equation 5.2-1 and table 5.3-1, it is concluded that, in the passenger cars and utility vehicles segment of the automobile industry, the foreign presence variable impacts the leverage of a firm significantly. The p-value for the foreign presence variable is 0.0067 which means that it is significant even at 1% level of significance. The second most significant variable is profitability with a p-value of 0.0422 and thus can be accepted at 5% level of significance. The business risk variable and the growth opportunities variable appear to be insignificant in this segment and may not be accepted even at a significance level of 10%.
Therefore, testing the variables for a significance level of 10%, it can be said that the null hypothesis for the foreign presence and profitability variables in the passenger cars and utility vehicles segment can be rejected. For the other variables the alternate hypothesis is rejected at a significance level of 10%.
CONCLUSIONS:
From the study, it was identified that foreign presence was a significant determinant of leverage (t-statistic:-1.195259) in the passenger cars and utility vehicles segment and although the hypothesis testing was carried out at significance level of 10%, this variable can be accepted even at 1% (p-value 0.0067).
With a p-value of 0.0422, Profitability is considered significant (Testing at 10% level of significance). It can be accepted at 5% level of significance also. Business risk and growth opportunities were found to be insignificant in this segment with high p-values of 0.24 and 0.95 respectively.
Therefore, it can be concluded that the foreign presence variable has a significant and negative impact on the leverage of the firms in the passenger cars and utility vehicles segment of the Indian automobile industry.
SCOPE FOR FUTURE RESEARCH:
BIBLIOGRAPHY
Anwar, S. & Sun, S., 2015. 15. CAN THE PRESENCE OF FOREIGN INVESTMENT AFFECT THE CAPITAL STRUCTURE OF DOMESTIC FIRMS?. Journal of corporate finance, Volume 30, pp. 32-43.
Bradley, M., Jarrell, G. A. & Kim, E. H., 2009. On the existence of an optimal capital structure: theory and evidence. The journal of finance, 39(3).
Chaudhuri, B. R., Pyne, P. K. & Chowdhury, A. R., 2013. Determinants of manufacturing FDI in India. The journal of induatrial statistics, 2(2), pp. 217-231.
Girma, S., Gong, Y., Görg, H. & Lancheros, S., 2014. 7. ESTIMATING DIRECT AND INDIRECT EFFECTS OF FOREIGN DIRECT INVESTMENT ON FIRM PRODUCTIVITY IN THE PRESENCE OF INTERACTIONS BETWEEN FIRMS, s.l.: s.n.
Haskel, J. E., Pereira, S. C. & Slaughter, M. J., 2007. Does inward foreign direct ionvestment boost the productivity of domestic firms?. The review of economics and statistics.
Jong, A. d., Kabir, R. & Nguyen, T. T., 2008. Capital structure around the world: The roles of firm- and country-specific determinants. Journal of banking and finance, Volume 32, pp. 1954-1969.
MYERS, S., 1977. DETERMINANTS OF CORPORATE BORROWING. JOURNAL OF FINANCIAL ECONOMICS, Volume 5, pp. 147-175.
MYERS, S., 1984. CAPITAL STRUCTURE PUZZLE. JOURNAL OF FINANCE, Volume 39, pp. 575-592.