Original Research Article
A cross sectional study on needle stick and sharp injuries among health
care providers in tertiary centers, Tamil Nadu
Archana Lakshmi P. A.
1, Ashrof Raja
2*, Meriton Stanly A.
3,
Christina Mary Paul
4, Gladius Jennifer H.
1INTRODUCTION
Needle stick injuries are neglected by many health care providers and it is the major route of transmission of serious blood borne diseases.
According to World Health Organization, 35.7 million health care workers in the world are exposed to the risk of Needle stick injuries, 2 million experience percutaneous exposures to infectious diseases each year and 4 needle stick injuries per worker within year in African, Mediterranean and Asian populations.1,2
ABSTRACT
Background: Health care workers are at risk of acquiring life threatening blood borne infections through needle stick and sharp injuries (NSSI) in their work place. This study was planned to highlight some important factors responsible for NSSI and possible measures to reduce it. The objective of the study was to assess the factors associated with NSSI and reasons for under-reporting.
Methods: A cross sectional study was done during November 2014 to April 2015 in two tertiary health care institutions. All health care providers (Doctors, nurses and lab technicians) who had more than one year experience and gave informed consent were included. Data collected by pretested structured questionnaire. Data analysis was done using SPSS 20v and summarized by descriptive statistics. Proportion and Chi-square was calculated at 5% α.
Results: Among 950 health care providers (HCPS), 649 (68.3%) had NSSI during their carrier, 335 (35.3%) in last one year. Females 225 (67.2%) experienced more NSSI. This study shows that, 98 (29.3%) HCPs had sustained injury once. Among the doctors, 51.4% Anaesthetist (p=0.001) and its more among the nurses (38.4%) followed by doctors (36.6%) (p=0.002). NSSI was more common among HCP who work between 30-40 hrs (p=0.00001). Majority of them sustained injury while performing the procedure 134 (40%), commonest place of injury was OT 149 (44.5%) and commonest item responsible was hypodermic needle 141 (42.1%). Only 50 (14.9%) reported to the concerned authority and follow up action was taken.
Conclusions: The study shows high prevalence of NSSI, emphasizing the need for safe measures for handling sharps to prevent transmission of infection.
Keywords: Needles stick injury, Sharp injury, Health care providers
Department of Community Medicine, 1Karpaga Vinayaga Institute of Medical Sciences and Research Centre, Madhuranthakam, Kancheepuram, 2Madha Medical College, Thandalam, 3Sri Ramachandra Medical College & RI, 4
ACS Medical College, Chennai, Tamil Nadu, India
Received: 01 February 2018
Revised: 18 February 2018
Accepted: 19 February 2018
*Correspondence:
Dr. Ashrof Raja,
E-mail: [email protected]
Copyright: © the author(s), publisher and licensee Medip Academy. This is an open-access article distributed under the terms of the Creative Commons Attribution Non-Commercial License, which permits unrestricted non-commercial use, distribution, and reproduction in any medium, provided the original work is properly cited.
It further notes that 37.6% of hepatitis B, 39% hepatitis C and 4.4% HIV/AIDS in health-care workers around the world were due to needle stick injuries.3 Other infections transmitted through needle sticks include syphilis, malaria, herpes etc.while 90% of the occupational exposures occur in developing countries and 40-75%goes underreported.4,5
The Health Protection Agency report (2012) on health care workers stated that injuries during occupational exposure among the medical and dental professions increased by 131% (100-231) from 2002 to 2011.6
Infections from each of these pathogens were potentially life threatening and preventable. The emotional impact of needle stick injury could be severe and long lasting, even when a serious infection was not transmitted. Not knowing infection status of patient among those injured can accentuate the stress. More than 80% of needle stick injuries can be prevented through the use of safer devices and effective safety programs.7 There not much of studies in south India, hence this study attempted.
The primary objective of the study was to assess the factors associated with NSSI. Secondary objective was reasons for under-reporting.
METHODS
A cross sectional study was done during November 2014 to April 2015 in two tertiary health care institutions in Chennai and Madurai, Tamil Nadu. Institutional Ethics committee approval was obtained. All the health care providers (Doctors, nurses and lab technicians) who had more than one year experience and gave informed consent were included in this study. Data were collected by pre tested structured questionnaire consisting of demographic details, years of experience, hours of work per day and time, place and item caused injuries.
Statistical analysis
Data was recorded in MS Excel sheet, analyzed using statistical software SPSS version 20. Mean, Standard Deviation, Frequency and Percentages were calculated. Chi square test calculated to find the difference between the variables at 5% level of significance.
RESULTS
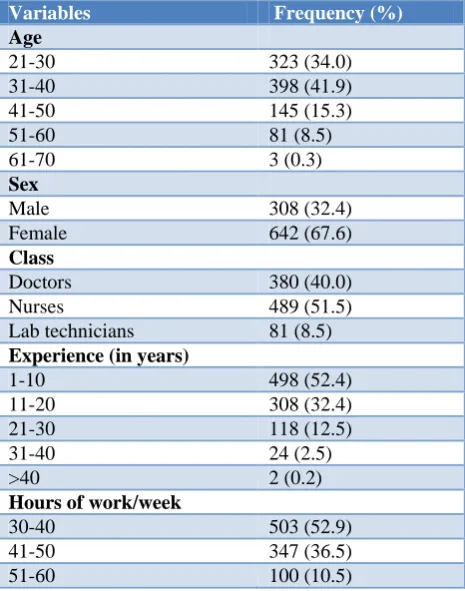
The total number of study participants was 950. Their age ranged from 21 to 70 years. Majority of them were females 642 (67.6%). There were 380 (40%) doctors, 489 (51.5%) nurses and 81 (8.5%) lab technicians. Majority of them have work experience between 1-10 years 498 (52.4%). Most of them 503 (52.9%) work for 30-40 hours per week (Table 1).
Among the 950 health care providers, 649 (68.3%) had NSSI during their carrier, 335 (35.3%) in last one year. It
also reveals that females 225 (67.2%) had experienced more than males 110 (32.8%) which not statistically significant (p=0.8). This study also shows that, 98 (29.3%) HCPs had sustained injury once, 173 (51.6%) had injury 2-5 times, 50 (14.9%) had injury 6-10 times, 9 (2.7%) had injury 11-15 times and 5 (1.5%) had injury >15 times in last one year. The number of pricks among HCPs range between 1–30 times.
Table 1: Demographic profile of the study participants
Variables Frequency (%)
Age
21-30 323 (34.0)
31-40 398 (41.9)
41-50 145 (15.3)
51-60 81 (8.5)
61-70 3 (0.3)
Sex
Male 308 (32.4)
Female 642 (67.6)
Class
Doctors 380 (40.0)
Nurses 489 (51.5)
Lab technicians 81 (8.5)
Experience (in years)
1-10 498 (52.4)
11-20 308 (32.4)
21-30 118 (12.5)
31-40 24 (2.5)
>40 2 (0.2)
Hours of work/week
30-40 503 (52.9)
41-50 347 (36.5)
51-60 100 (10.5)
Table 2: Distribution of needle stick and sharp injuries among health care providers.
Health care providers Frequency (%)
Doctors* 139 (36.6)
Physician (n=146) 32 (21.9)
Surgeon (n=150) 69 (46.0)
Anaesthetist (n=37) 19 (51.4)
OG (n=47) 19 (40.4)
Nurses 188 (38.4)
Lab technicians 8 (9.9)
Table 2 describes that, Among the doctors, 51.4% anaesthetist had NSSI followed by surgeons 46% and OG 40.4% which was statistically significant (p=0.001). Similarly, NSSI was more among the nurses (38.4%) followed by doctors (36.6%), which was also statistically significant (p=0.002).
HCPs working between 11-20 years 122 (36.4%) which was not significant (p=0.3). It provides evidence that there was decreased trend as age advances (Figure 1).
Figure 1: Trend of years of experience and NSSI among study participants.
Table 3: Distribution of hours of work and NSSI.
Hours of work
NSSI
Significance Yes (%) No (%)
30-40 215 (64.2) 288 (46.8)
Chi sq=19.51 P=0.00001
41-50 91 (27.2) 256 (41.6)
51-60 29 (8.6) 71 (11.6)
Total 335 (35.3) 615 (64.7)
Table 3 explains that NSSI was more common among HCP who work between 30-40 hours and their differences was found significant (p=0.00001).
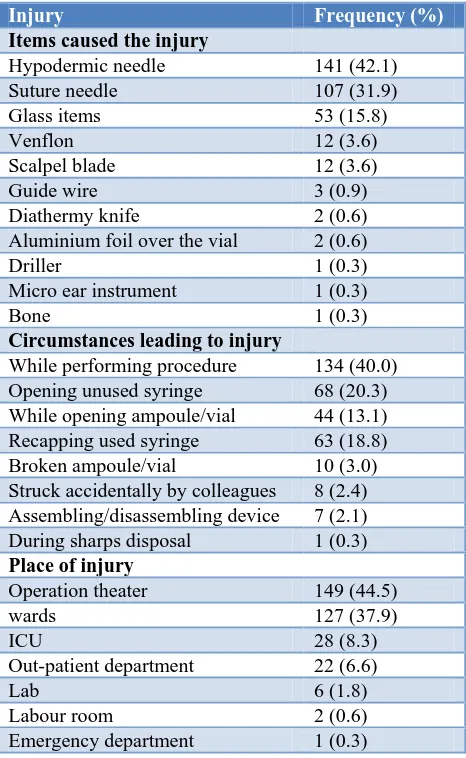
Table 4 describes that, Majority of them sustained injury while performing procedures 134 (40%), commonest place of injury was operation theaters 149 (44.5%) and commonest item responsible for the injury was hypodermic needle 141 (42.1%). Fingers were most commonly affected 332 (99.1%), followed by hand 3 (0.9%).
Figure 2: Reasons for not reporting about.
Figure 2 shows that, among 335 HCPs who had injury, only 50 (14.9%) reported to the concerned authority and
follow up action was taken. The reason most of them reported was concerned patients not infectious (40%).
Table 4: Distribution of items, circumstances and place of injury.
Injury Frequency (%)
Items caused the injury
Hypodermic needle 141 (42.1)
Suture needle 107 (31.9)
Glass items 53 (15.8)
Venflon 12 (3.6)
Scalpel blade 12 (3.6)
Guide wire 3 (0.9)
Diathermy knife 2 (0.6)
Aluminium foil over the vial 2 (0.6)
Driller 1 (0.3)
Micro ear instrument 1 (0.3)
Bone 1 (0.3)
Circumstances leading to injury
While performing procedure 134 (40.0)
Opening unused syringe 68 (20.3)
While opening ampoule/vial 44 (13.1)
Recapping used syringe 63 (18.8)
Broken ampoule/vial 10 (3.0)
Struck accidentally by colleagues 8 (2.4) Assembling/disassembling device 7 (2.1)
During sharps disposal 1 (0.3)
Place of injury
Operation theater 149 (44.5)
wards 127 (37.9)
ICU 28 (8.3)
Out-patient department 22 (6.6)
Lab 6 (1.8)
Labour room 2 (0.6)
Emergency department 1 (0.3)
DISCUSSION
In the present study, 68.3% had NSSI during their carrier which was comparable with the study done by Afridi et al (64%).8 The proportion of NSSI in this study was 35.3% during last one year and females (67.2%) had experienced more NSSI which was comparable with the study done by Kebede et al showed prevalence of 30.8% and NSSI was reported more among females.8,9 NSSI was more among the nurses (38.4%) which was similar to the other studies.10-13
In present study, 29.3% HCPs had sustained injury once, 173(51.6%) had injury 2-5times in last one year. No of pricks among HCPs range between 1-30. The results were higher than the study done by Voide et al shows 9.7% had sustained at least one NSSI during the preceding twelve months. Of these, 171 (65.8%) had sustained one NSSI, 60 (23.1%) had sustained two and 29 (11.1%) more than two. The number of NSSIs/ respondent varied from 1 to 10.10
323 220 87 18 1 173 122 35
4 1
0 50 100 150 200 250 300 350
1.-10 11.-20 21-30 31-40 >40
life time last one year 114 58 51 46
5 5 3 2 1 Concerned patient not infectious
Needle not used in patients
Injury was mild
Too busy to report
Laziness
Need for reporting not known
Not aware of how/whom to report
Majority of them sustained injury while performing the procedure 134 (40%), commonest place of injury was operation theaters 149 (44.5%) and whereas in other studies, the most common place of occurrence of NSSIs was ward and in study done by Bhattarai et al most of injuries were (35.6%) occurred while manipulating needle into patients.12,14,15
Commonest item responsible for the injury was hypodermic needle 141 (42.1%) which was similar to the other studies.8,12,13,15
Fingers were most commonly affected 332 (99.1%), followed by hand 3 (0.9%) whereas in a study done by showed hands were the most affected body parts.12
Among the doctors, 51.4% anaesthetist had NSSI followed by surgeons 46% and OG 40.4% whereas study done by Sharma et al greater prevalence of needle stick injuries was observed in the medicine department as compared to the surgery department.14
Only 14.9% reported to the concerned authority and follow up action was taken, which was almost similar to the study done by Ziad et al and Bhattarai et al, the reporting rate was 13.84% and 11.4% respectively.12,15 The reason for underreporting in the present study was concerned patients not infectious (40%) whereas study done by Voide et al, the principal reasons for not reporting were 1) self estimation that the NSSI was low risk with respect to blood-borne virus transmission (87.1%) and 2) perceived lack of time (34.3%).10 The results were in favor of fact that Needle stick injuries go unreported.
Recommendations
Even though training programs had been conducted periodic reinforcement of infection control programs are needed for safety of various levels of health care providers.
CONCLUSION
The study shows high prevalence of NSSI, which is inevitable; efforts should be taken to reduce it. Though it cannot be prevented completely, HCPs should be constantly aware that it can happen at any time and extra measures should be taken to prevent it as far as possible.
Funding: No funding sources Conflict of interest: None declared
Ethical approval: The study was approved by the Institutional Ethics Committee
REFERENCES
1. Rapiti E, Prüss-Üstün A, Hutin Y. Sharps injuries: assessing the burden of disease from sharps injuries to health-care workers at national and local levels.
Geneva, World Health Organization. WHO Environmental Burden of Disease Series, 2005: 11. 2. Michalsen A, Delchos GL, Felknor SA, Davidson
AL, Johnson PC, Vesley D. Compliance with universal precautions among physicians.J. Occupational environment medicine. 1997;39:130-7.
3. World Health Organization. The World Health Report. Protecting health-care workers - preventing needlestick injuries. 2002. Available at: http://www.who.int/occupational_health/topics/need injuries/en. Accessed on 1 Feb 2018.
4. Centres for the disease control and prevention. Division of health care quality promotion. Surveillance of health care personnels with HIV/AIDS as of December 2001. 2003. Available at: http://www.cdc.gov/ncidod/hip/BLOOD/ hivpersonnel.htm. Accessed on 2 Feb 2018.
5. Tetali S, Choudhury PL. Occupational exposure to sharps and splash: Risk among healthcare providers in three tertiary hospitals in south India. Indian J Occupational Environ Med. 2006;10(1):35-40. 6. Health Protection Agency Eye of the Needle: United
Kingdom Surveillance of Significant Occupational Exposure to Blood borne Viruses in Healthcare Workers. 2008. Available at: www.hpa.org.uk/ webc/HPAwebFile/ HPAweb_C/1227688128096. Accessed on 1 February 2018.
7. National Institute for Occupational Safety and Health Releases Guidelines On Preventing Needle Sticks. AIDS Alert. 2000;15:1–2.
8. Afridi AAK, Kumar A, Sayani R. Needle Stick Injuries– Risk and Preventive Factors: A Study among Health Care Workers in Tertiary Care Hospitals in Pakistan. Glob J Health Sci. 2013;5(4):85–92.
9. Kebede G, Hardeep MM, Sharma R. Needle stick and sharps injuries among health care workers in Gondar city, Ethiopia. Safety Sci. 2012;50(4):1093-7.
10. Voide C, Darling KE, Kenfak-Foguena A, Erard V, Cavassini M, Lazor-Blanchet C. Underreporting of needlestick and sharps injuries among healthcare workers in a Swiss University Hospital Swiss Med Wkly. 2012;142:135-23.
11. Cho E, Lee H, Choi M, Park SH,Il Yoo Y, Linda H. Aiken. Factors associated with needlestick and sharp injuries among hospital nurses: A cross-sectional questionnaire survey. International journal of nursing studies. 2013;50(8):1025-32.
12. Ziad A, Abdullah M, Assiri MM, Hathout EHM, Alzoman H, Undaya M. Risk analysis of needle stick and sharp object injuries among health care workers in a tertiary care hospital (Saudi Arabia) Journal of epidemiology and Global Health. 2013;3(3):123-9.
care workers in a Portuguese hospital. Science Accid Anal Prev. 2012;47:11-5.
14. Sharma A, Gur R, Bhalla P. Study on prevalence of needle stick injury among health care workers in a tertiary care hospital in New Delhi: A two-year review. Indian J Public Health 2012;56:101-3 15. Bhattarai S, Smriti KC, Pradhan PMS, Lama S,
Rijal S. Hepatitis B vaccination status and Needle-stick and Sharps-related Injuries among medical
school students in Nepal: a cross-sectional study BMC Res Notes. 2014;7:774.
Cite this article as: Archana LPA, Ashrof R, Meriton SA, Christina MP, Gladius JH.A cross sectional study on needle stick and sharp injuries among health care providers in tertiary centers, Tamil Nadu. Int J Community Med Public Health