Disaster Debris Detection and Management
System using WSN & IoT
M Chaitra
Department of Telecommunication Engineering, Dr. Ambedkar Institute of Technology, Bangalore-56 Email: [email protected]
Dr. B Sivakumar
Department of Telecommunication Engineering, Dr. Ambedkar Institute of Technology, Bangalore-56 Email: [email protected]
---ABSTRACT---Disasters like earthquake, landslide, flood etc. typically generate enormous amount of debris in the disaster struck area. As a result of these disasters, there will be destruction of properties like home, public infrastructure which results in insecurity, loss of life and property and also interrupts public services. Wireless Sensor Networks play a vital role in disaster debris detection and management. Debris flows usually occurs in mountain regions having steep front. They comprise a huge congregation of solid matter like mud, soil are other waste generated due to earthquake, landslide etc. in water that flows down in the form of a wave. Landslides, earthquake and floods generate debris. They are amongst the foremost vulnerable natural disasters in mountainous torrents. Different factors are attributable to quality of debris flow: firstly their potentiality of transportation and deposition of enormous quantity of solid matters, which can additionally approach gigantic sizes, their sheer fronts, can attain huge meters of altitude and additionally their high speeds and depth of flow. To mitigate the effects of debris, a disaster debris management system is designed containing an different sensors, N-mote and an N-gateway to measure various parameters of debris flow and an alert is sent to the public and rescue team by using cloud services in advance so that there is less loss of life and property.
Keywords – cloud services, debris, n-gateway, n-mote, sensors.
--- Date of Submission: June 17, 2017 Date of Acceptance: July 03, 2017
---1. INTRODUCTION
W
ireless Sensor Network plays a vital role in detection and management of debris flow and helps in decreasing after effects of flow of debris. Debris flow systems for warning are divided as: advanced warning system and event warning system. The two classes incorporate various types of system sensors. Advance warning systems measures hydro meteorological procedures (commonly precipitation) and plan to generate a notice prior to occurrence of debris stream.Event warning scheme predicts the occurrence of debris in advance i.e. before a disaster is likely to occur. They utilize extremely shorter lead times but at the same time they also lead to erroneous cautions. Advance warning in debris stream utilizes sensors and systems to measure parameters of debris stream flow after it has occurred, it utilizes larger lead times and at the same time it does not lead to any erroneous cautions.
Event warning scheme incorporates distinct variety of sensors such as ultrasonic sensor, accelerometer sensors to measure ground vibration, video cameras, pendulums, moisture sensors etc. They have high robustness and the system employ the same sensors for detecting and warning. Debris flows are mass movement that releases extremely larger distribution of solid matter mixed in water that moves at intensely higher speeds and induce harmful effects on lives. Debris flow usually have sheer
fronts principally consists of huge rock which has turned smooth due to the effect of erosion.
By using distinct types of sensors for measuring different parameters of debris flow, a system is designed using an N-mote, N-gateway and cloud services, such that an alert is directed or forecast to the public and weather forecast department and rescue members before and after occurrence of event so that there will be less loss impact on life and property.
Qiu J, Xiao B, Lv K [1] proposed a system which is designed by incorporating Wireless Sensor Network for short term predicting and environment condition monitoring system in urban site applications. The system is branched to Architecture of system, required hardware, software and the system framework. WSN collects information from environment from urban special sites like airports and areas which are commercial in real time. The statistics of data received are then relayed to the SINK node, terminal and a special system for evaluating the received data. After processing the information is advertised to the public. This system encounters the demand for urban sits preventing and mitigating effects of disasters, promoting social works etc.
incurred because of change in climatic condition by governing the consignment of disaster in the disaster prone or disaster struck site while detecting a disaster. Based on perpetual parameters determined by the sensors incorporated, appropriate measures can be inculcated. Heterogeneous sensor networks is analyzed and utilized in this paper and the intensity of disaster and various sensors incorporated is discussed. For disaster detection and management a heterogeneous clustering algorithm is designed by means of wireless sensor networks. This clustering protocol extends the life of power constrained sensor mote. Distinct types of clustering protocols are used such as Stable election protocol (SEP), Distributed energy efficient protocol (DEEC), Enhanced developed distributed energy efficient protocol (EDEEC) and balanced energy efficient network protocols (BEENISH) are evaluated. EDEEC protocol can be applied for analyzing earthquake and disasters like storm, flood and volcano, BEENISH protocol can be adapted for analyzing disasters like Tsunami. These kinds of clustering protocols can be utilized competently in disaster struck areas to reduce loss of life and property.
Mittal R, Bhatia M P S [3] proposed a Wireless Sensor Network is introduced, when tis network is combined with various different networks will play a crucial role while evaluating the information related to water like water level, water contamination, environmental pollution and controlling of traffic. Owing to the tremendous growth of Wireless Sensor Network and its potentiality to trigger huge amount of data is attracting researchers to study on data mining proficiency. WSN in monitoring the activities of environment attracts greater interests and is challenging to find out the patterns through stupendous amount of information sets. The sensor nodes present at the emergency site generate data sets and some sensor motes are affixed with wildlife sanctuaries. WSN initiates contiguous data stream over different time intervals. Data mining technique has an important role in extracting data from the environment.
S. Sarah, M. Dilip, r. Rahul Aravindh [8] Due to geographic location and changes in environmental conditions, many of the countries are endangered to natural as well as manmade disasters. These countries lack efficient disaster planning and preparedness system to tackle natural disasters. Many tourists also face difficulty in locating a safer zone or shelter in case of emergency. For this reason, a disaster detection and management and evacuation system is designed for public using Google map is proposed in this paper. Due to burgeoning of smart mobiles in the world, the system is executed on android smart phones. An android phone with the disaster recovery app is installed, user can register through the app to send SMS in bulk notifying for help. By relaying the exact position acquired by GPS, the user can evacuate to safer place in short span of time.
II.
PROPOSED
SYSTEM
The main objective of this project is to set up a centralized cloud based platform which can be used by public for free and in case a disaster is likely to occur then pre disaster precautions can be taken to reduce loss of life and property.
The system is divided into two parts transmitter and receiver.
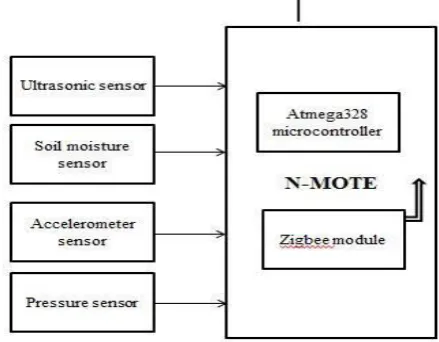
The transmitter circuit consists of Ultrasonic sensor to measure the depth of the debris flow, Soil moisture sensor to measure water content in the soil, Accelerometer sensor to measure ground vibrations which detects earthquake and Pressure sensor which measures the debris flow pressure, N-Mote module which is equipped with atmega328 microcontroller and a ZigBee module. The data collected from the sensors is in voltage levels, so it has to be converted into suitable format to visualize the results. Transmitting of data is done using ZigBee. It has a range of 600m approximately. To visualize the data from the sensors a code in embedded C is written in Arduino IDE environment.
Fig 1. Transmitter Circuit.
Fig 2. Receiver Circuit
III.
WORKFLOW LANGUAGESEmbedded c is used for programming in Arduino IDE at the transmitter side. Embedded C uses most of the syntax and semantics of standard C, e.g., main() function, variable definition, datatype declaration, conditional statements (if, switch case), loops (while, for), functions, arrays and strings, structures and union, bit operations, macros, etc.
Python is used at the receiver side for relaying the incoming data to cloud database.
IV.
RESULTS
The various data collected from the sensors and stored in two different clouds: ubidots and IBM Bluemix are shown below.
UBIDOTS OUTPUT
The figures below shows the result from ubidots cloud.
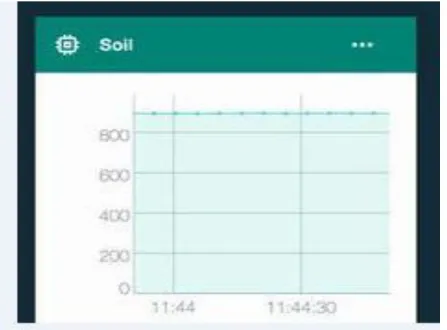
Fig 3. Soil moisture output.
The soil moisture sensor collects data in analog form the sensor data is sent to cloud database via gateway by using Ethernet or Wi-Fi. The cloud database stores the value coming from sensor which can be visualized remotely in the cloud dashboard. The cloud dashboard has sensor data
which is collected at every time instant with data and time. These values are monitored continuously and when the desired threshold is reached, a warning message is sent to authorized person as well as to the public.
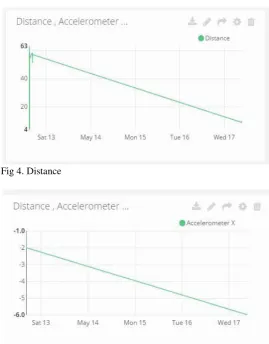
Fig 4. Distance
Fig 5. Accelerometer X-Axis.
Figure 5 shows the graphical version of data coming from Accelerometer sensor used to detect ground vibration, the above shown graph depicts the ground vibration in x-axis.
Fig 6. Accelerometer Y-axis.
Fig 7. Accelerometer Z-axis.
Figure 7 shows the graphical version of data coming from Accelerometer sensor used to detect ground vibration, the above shown graph depicts the ground vibration in z-axis. BLUEMIX OUTPUT
Fig 8. Ground vibrations.
The above figure shows the readings of accelerometer sensor in three directions which is a measure of ground vibration.
Fig 9.Soil moisture.
The above figure shows the water content in soil measured by the soil moisture sensor.
Fig 10.Flow depth.
The above graphs in the result shows the various parameters of debris flow measured by different sensors stored in two different cloud platforms that is Ubidots and IBM Bluemix which provides different services to the users. User can use these clouds for deploying and running apps. They provide services such that the user can use it without any additional hardware or software. The data stored in cloud can be accessed at anytime from anywhere by the authenticated user.
V.
CONCLUSION
A system is designed with different sensors for measuring various parameters of debris flow detection and management. Debris flow induces loss of live and property, which can be reduced to some extent through early detection and warning so the after effects of disasters can be reduced and preventive measures can be inculcated and the risk of danger or threat can be minimized. The sensors used in this project measures the occurrence of earthquake, landslide, and also rainfall so by using variety of sensors on reduce the effects of disaster. The disaster detection and management systems play a crucial role in control measures for mitigating these perilous disasters. ACKNOWLEDGEMENTS
I would like to thank Dr. B Sivakumar, project guide and mentor, Department of Telecommunication Engineering, Dr. AIT, Bangalore for guidance, suggestions and support for the project work.
REFERENCES
[2] A Devasena, B Sowmya, “Wireless Sensor Network in Disaster Management,” Indian journal of Science and Technology, vol.8, No.15, pp. 1-6, 2015.
[3] Mittal R, Bhatia M P S, “Wireless sensor networks for monitoring the environmental activities,” IEEE International Conference on Computational Intelligence and Computing Research (ICCIC), pp. 1-5, 2010.
[4] Lee H C, Banerjee A, Fang Y M, et al, “Design of a multifunctional wireless sensor for in-situ monitoring of debris flows,” IEEE Transactions on Instrumentation and Measurement, vol.59 , No. 11, pp.2958-2967, 2010.
[5] Liu Z, Liu Y, Gong X, “A monitoring and warning system for brae debris flow with multi-sensor network,” Chinese IEEE on Control and Decision Conference (CCDC), pp. 3781-3785, 2011.
[6] Hiroaki Inokuchi, Takamasa Akiyama, “Debris treatment planning for large-scale earthquakes using fuzzy information,” International Conference on Soft Computing and Intelligent Systems, pp: 478-483, 2016.
[7] Bletsas A, Khisti A, Reed D P,” A simple cooperative diversity method based on network path selection,” IEEE Journal on Selected Areas in Communications, vol.23 , No. 3, pp. 659-672, 2006.
[8] Jing Y, Jafarkhani H. “Single and multiple relay selection schemes and their achievable diversity orders”, IEEE Transactions on Wireless Communications, vol.8 , No. 3, pp. 1414-1423, 2009.
[9] Michalopoulos D S, Karagiannidis,”G K. PHY-layer fairness in amplify and forward cooperative diversity systems,” IEEE Transactions on Wireless Communications, vol.7 , No. 3, pp. 1073-1082, 2008.
[10] Liu J, Lu K, Cai X, et al “Regenerative cooperative diversity with path selection and equal power consumption in wireless networks,” IEEE Transactions on Wireless Communications, vol.8 , No. 8,pp. 3926-3932, 2009.
[11] Christian N. Koyama, Hideomi Gokon, Masaru Jimbo, Shunichi, Motoyuki Sato, “Disaster debris estimation using high-resolution polarimetric stereo-SAR”, ISPRS journal of Photogrammetry and Remote Sensing, vol.120, pp.84-98, 2016.