R E S E A R C H A R T I C L E
Open Access
BMI is a poor predictor of adiposity in
young overweight and obese children
Cassandra Vanderwall
1*, R. Randall Clark
2, Jens Eickhoff
1and Aaron L. Carrel
1Abstract
Background:The body mass index (BMI) is a simple and widely utilized screening tool for obesity in children and adults. The purpose of this investigation was to evaluate if BMI could predict total fat mass (TFM) and percent body fat (%FAT) in a sample of overweight and obese children.
Methods:In this observational study, body composition was measured by dual energy x-ray absorptiometry (DXA) in 663 male and female overweight and obese children at baseline within a multidisciplinary, pediatric fitness clinic at an academic medical center. Univariate and multivariate regression analyses were conducted to evaluate whether BMI z-score (BMIz) predicts TFM or %FAT.
Results:The BMIz, sex and age of subjects were identified as significant predictors for both TFM and %FAT. In subjects younger than 9 years, the BMIz was a weak to moderate predictor for both TFM (R2= 0.03 for males and 0. 26 for females) and %FAT (R2= 0.22 for males and 0.38 for females). For subjects between 9 and 18 years, the BMIz was a strong predictor for TFM (R2between 0.57 and 0.73) while BMIz remained only moderately predictive for %FAT (R2between 0.22 and 0.42).
Conclusions:These findings advance the understanding of the utility and limitations of BMI in children and adolescents. In youth (9-18y), BMIz is a strong predictor for TFM, but a weaker predictor of relative body fat (%FAT). In children younger than 9y, BMIz is only a weak to moderate predictor for both TFM and %FAT. This study cautions the use of BMIz as a predictor of %FAT in children younger than 9 years.
Keywords:Body mass index, Childhood obesity, Dual X-Ray absorptiometry, Body composition
Background
Childhood obesity is a global public health crisis [1, 2] and obesity in the United States has more than doubled in children and quadrupled in adolescents over the last 30 years [3, 4]. At present, more than one-third of chil-dren and adolescents in the United States are overweight or obese, more than 17% of these youth are obese [3]. Childhood obesity is associated with cardiovascular disease, hypertension, insulin resistance and type 2 diabetes, asthma, obstructive sleep apnea, psychosocial problems, decreased quality of life, and increased likeli-hood of becoming obese adults [3, 5–15]. Morbidity and mortality risk may vary between different racial and Hispanic origin groups at the same body mass index (BMI) [16, 17]. Adiposity is an independent risk factor
for insulin resistance and a strong predictor of morbidity [18–21]. Therefore, directly assessing body fat is a key strategy for preventative and therapeutic intervention of childhood obesity [18, 22].
Obesity, or having excess body fat [23], can be defined using cut points of BMI; the ratio of an individual’s weight to height squared (kg/m2). The BMI varies with age in children and thus BMI values are compared with age- and sex-specific references. For children and ado-lescents aged 2 to 19 years, BMI is plotted on the sex-specific, Centers for Disease Control and Prevention (CDC) growth chart to identify the BMI-for-age percent-ile. Childhood obesity is defined as a BMI at or above the 95th percentile on the BMI-for-Age growth chart The BMI-for-age percentile is calculated based on a reference population [22, 24]. The indirect relationship between BMI and measures of adiposity has been * Correspondence:[email protected]
1University of Wisconsin, Madison, WI, USA
Full list of author information is available at the end of the article
established but varies according to sex, age, and race-ethnicity [16, 17].
The literature also varies in the strength of the association between BMI and body composition variables [24–26]. Therefore, the purpose of this investigation was to evaluate the relationships between BMIz, total fat mass (TFM) and percent body fat (%FAT) using dual energy x-ray absorpti-ometry (DXA) in a sample of overweight and obese chil-dren. This study evaluated the relationship between BMIz and TFM, as well as, BMIz and %FAT as determined by DXA in four age categories of overweight and obese children: 4–9, 9–11, 12–14, and 15–18 years.
Traditional anthropometric measures (weight, waist circumference, BMI) used to evaluate and track changes in body composition can misclassify patients and may not accurately assess significant changes in body com-position over time. The most common clinical body composition tools include waist circumference, skinfold calipers, bio-electrical impedance analysis (BIA), air dis-placement plethysmography (ADP), hydrodensitometry, and DXA [27, 28]. Due to ease of acquisition, the most widely used clinical outcome variable is BMI. Historic-ally, BMI has been accepted as the standard clinical screening tool for youth to determine their risk status for disease states related to weight and adiposity [22, 23]. However, the relationships between BMI and laboratory measurement of body fat and lean tissue mass are not clear in today’s generation of overweight and obese youth. Primary care providers play a pivotal role in the process of preventing, identifying and treating childhood obesity and associated co-morbidities [29–34] and frequently use BMI to screen for excess body fat relative to body weight. It is unclear whether BMI can be utilized to monitor changes resulting from weight management interventions de-signed to improve body composition in this population. Therefore, this study evaluated the effectiveness of BMI to predict TFM and %FAT by DXA in overweight and obese youth.
Methods
All subjects were overweight or obese boys and girls (ages 4–18 years) evaluated as part of their routine clinical care at a multidisciplinary weight management program within an academic medical center. An-thropometric and body composition measurements were collected at the same initial encounter. Measure-ment procedures were performed and analyzed by the same investigators. Height was measured with a wall-mounted stadiometer to the nearest 0.1 cm. Weight was measured on a calibrated beam balance platform scale to the nearest 0.1 kg. BMI z-score (BMIz) and BMI-for-age percentiles were computed using the CDC reference values.
The body composition values of total body bone, muscle and fat mass, as well as, %FAT were measured by DXA. Whole body scans were performed using the Norland XR-36 whole body bone densitometer (Norland Corporation, Ft. Atkinson, Wisconsin USA) and tissue masses were analyzed using software version 3.7.4/2.1.0. All subjects were positioned in the supine position and scanned by the same investigator. Subjects removed metal objects or clothing containing metal components and wore only workout shorts and t-shirt for the scan procedure. Each scan session was preceded by a calibra-tion routine using multiple quality control phantoms that simulate soft tissue and bone. Based on 18 scans of 6 subjects using the XR-36 whole body procedures the total body coefficients of variation (CV) are as follows: soft tissue mass 0.2%, total body mass 0.2%, lean body mass 1.0%, fat mass 2.5%, percent fat 2.4% and total BMC 0.9%. The Norland XR-36 has been previously vali-dated for measurement of body composition against multi-component models [35–37]. Study procedures were approved by the Health Sciences Human Subjects Committee at the University of Wisconsin- Madison.
All baseline characteristics were summarized in terms of means (SD) or frequencies and percentages. Univariate and multivariate regression analyses were conducted to evaluate the association between BMIz and markers of body composition, including TFM and %FAT. The univar-iate analyses were stratified by gender and designated age groups: 4–9 years, 9–11 years, 12–14 years, and 15– 18 years Multiple regression analysis models were cre-ated with TFM and %FAT as dependent variables and BMI z-score and age as independent variables. Slope parameter estimates were reported along with the corresponding 95% confidence intervals (CIs). Fur-thermore, moving average regression analyses of TFM on BMIz and relative %FAT on BMIz across the con-tinuous age range (4–18 years) with age windows of +/−1 year were conducted in order to visually display how the association between TFM, relative fat and BMIz changes with age. The corresponding Rw2values were calculated and plotted using the smoothing spline method. Statistical analyses were conducted using SAS software version 9.4 (SAS Institute Inc., Cary NC). All reported P-values are two-sided and
P< 0.05 was used to define statistical significance.
Results
Subjects were 663 overweight and obese boys and girls (49% male) with a mean (SD) age of 11.7 (3.3) years (range 4–18 years), BMI of 30.2 kg/m2
with a BMI-for-age above the 99th percentile (Table 1). The TFM and %FAT were significantly higher in severely obese subjects (BMI-for-age > 99th percentile) when compared to subjects within the 85th to 99th BMI per-centile range (p< 0.001) (Table 2).
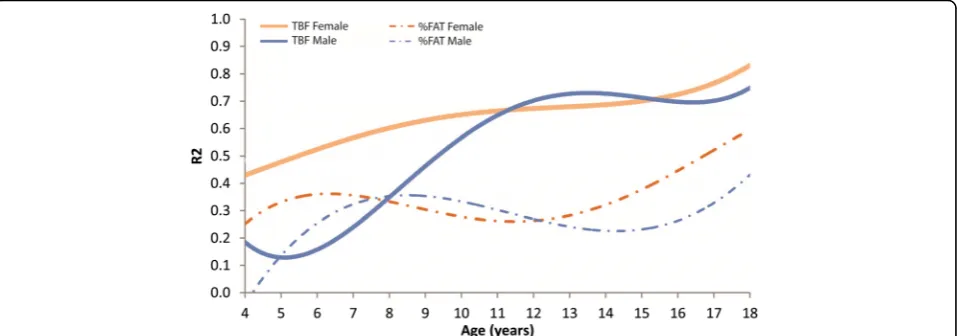
In the multivariate regression analysis, BMIz (p< 0.001), sex (p< 0.001) and age (p= 0.01) were identified as inde-pendent predictors for TFM. Furthermore, a significant interaction effect between age and BMIz was detected (p < 0.001). For %FAT, only BMIz (p < 0.001) and sex (p< 0.001) were identified as significant predictors. The results of the age-stratified analysis are shown in Table 3 and visually displayed in Fig. 1 for males and females. In subjects younger than 9 years, BMIz was identified as a weak to moderately strong predictor for both TFM (R2 = 0.03 for males and 0.26 for females) and %FAT (R2= 0.22 for males and 0.38 for females). For subjects between 9 and 18 years, on the other hand, BMIz was identified as a strong predictor for TFM (R2between 0.57
and 0.73) while BMIz remained only weakly to moder-ately predictive for %FAT (R2 between 0.22 and 0.42) for both males and females (Table 3). The partial correlation coefficient between BMIz and TFM was 0.67 (95% CI: 0.60–0.72) for males and 0.82 (95% CI: 0.78–0.85) for females after adjusting for sex and age while the partial correlation coefficient between BMIz and %FAT was 0.39 (95% CI: 0.30–0.48) for males and 0.60 (95% CI: 0.52–0.66) for females. These results indi-cate a relationship between BMIz and TFM, as well as, BMIz and %FAT varying by age and sex.
Discussion
The BMI is widely used as a screening tool as a proxy for weight-related health risk because high BMI values may reflect excess adiposity. However, BMI does not estimate body composition and cannot differentiate between fat and muscle in children. Our study demonstrates that age has a strong interaction with %FAT, but in children youn-ger than 9 years, the BMIz is a weak predictor for both TFM and %FAT. The BMIz is only a weak predictor for TFM and %FAT in young children, less than 9 years of age. These data, however, are different for older children. The BMIz is a strong predictor of TFM in children and adolescents over the age of 9 years. These results have strong implications for the use and reliance on the BMI for screening and monitoring weight-related changes in overweight and obese youth.
It is important to consider the difference between TFM and %FAT. Total fat mass is the absolute fat mass for that individual. The TFM value does not identify an individual’s relative fat, or the amount of fat in relation to their bone, muscle and total body mass. While it has been shown that DXA is a more accurate measure for adiposity, [38, 39] it may not be practical on a large scale due to cost and resource constraints, and is not cur-rently available and used in the greater community [40]. However, many clinicians continue to utilize BMI as a screening tool for obesity and weight-related disease states based on the assumption that a high BMI equals a high degree of adiposity. However, the results of the current study using DXA, indicate that BMI is not diag-nostic of the degree of body fatness in younger children. Because childhood obesity has been identified as a global public health crisis [1, 2], clinicians should be aware of Table 1Subject characteristics
Male Female Overall
(N= 325) (N= 338) (N= 663)
N % N % N %
Age (years)
4–9 66 20% 50 15% 116 18%
9–11 101 31% 106 31% 207 31%
12–14 90 28% 104 31% 194 29%
15–18 68 21% 78 23% 146 22%
BMI-for-Age percentile
85 to 95th 25 8% 38 11% 63 10%
95 to 99th 147 45% 174 51% 321 48%
> 99th 153 47% 126 37% 279 42%
BMI (kg/m2)
Mean ± SD 29.8 ± 6.1 30.7 ± 6.9 30.3 ± 6.5
BMI z-score
Mean ± SD 2.3 ± 0.5 2.2 ± 0.4 2.2 ± 0.5
Total Fat Mass, TFM (kg)
Mean ± SD 34.4 ± 13.1 37.7 ± 15.0 36.1 ± 14.2
Percent Body Fat, %FAT (%)
Mean ± SD 38.3 ± 5.6 38.3 ± 5.6 39.3 ± 5.2
Table 2Mean ± SD total fat mass (TFM) and percent body fat (%FAT) by BMI-for-age percentiles and sex
BMI percentile
Sex Body Fat Measure 85th–95th 95th–99th >99th p-value
Male TFM (kg) 23.0 ± 5.7 30.6 ± 8.2 39.8 ± 15.2 <0.001
%FAT 33.9 ± 5.9 36.6 ± 5.4 40.7 ± 4.6 <0.001
Female TFM (kg) 26.5 ± 7.1 34.7 ± 10.7 45.1 ± 18.1 <0.001
weaknesses in utilizing BMI to estimate excess body fat in younger children.
Flegal [16] utilized NHANES (1999–2004) data to assess the performance of the standard BMI-for-age per-centile categories relative to the prevalence of excess adiposity (%FAT) using DXA in 8,821children ages 8 to 19 years of age. They concluded that a narrow range of the BMI-for-age percentiles identify individuals with both a high BMI and excess adiposity and large differ-ences in the prevalence in children and adolescents with intermediate BMI-for-age percentile ranges and high adiposity. Flegal, et al. encourages caution when inter-preting comparisons of high BMI ranges in terms of adiposity, by race-ethnicity, as well as, in the interpret-ation of the relinterpret-ationship between BMI and adiposity in
children with intermediate BMI ranges. The present study only examined overweight and obese children and adolescents and the present results support Flegal’s find-ings that BMI maintains a weak relationship with rela-tive body fat (%FAT) in overweight and obese children and adolescents and also cautions the use of BMI as a predictor of %FAT in children younger than 9 years.
Pietrobelli [41] found that BMI was strongly associated with TFM (R2= 0.85 and 0.89 for boys and girls, respect-ively) and %FAT (R2= 0.63 and 0.69 for boys and girls, respectively). While Pietrobelli concluded that the asso-ciation between BMI and adiposity is consistent across the age spectrum, our data does not support this in chil-dren less than 9 years of age. Their sample was com-prised of healthy children with a mean BMI of 23.8 kg/ Table 3Univariate and multivariate regression analysis for predicting total fat mass (TFM) and percent body fat (%FAT) on BMI z-score in an overweight and obese pediatric population (4–18 years), stratified by sex and age groups
Outcome:
Total Fat Mass, TFM (kg)
Outcome:
Percent Body Fat, %FAT (%)
Age (years) Gender β(Slope) 95% CI forβ P-value R2 β(Slope) 95% CI forβ P-value R2
4-9a Male 1.9 −0.8–4.6 0.161 0.03c 3.7 1.9–5.4 <0.001 0.22d
Female 6.9 3.6–10.3 <0.001 0.26d 7.0 5.2–8.8 <0.001 0.38d
9–11a Male 18.1 15.3–20.9 <0.001 0.63e 7.0 5.2–8.8 <0.001 0.38d
Female 17.1 14.2–20.0 <0.001 0.57e 6.7 4.4–9.1 <0.001 0.42d
12–14a Male 27.0 23.2–30.9 <0.001 0.69e 7.3 4.4–10.2 <0.001 0.22d
Female 25.7 22.2–29.2 <0.001 0.67e 6.1 4.4–8.0 <0.001 0.29d
15–18a Male 26.4 22.5–30.3 <0.001 0.73e 7.2 4.2–10.1 <0.001 0.26d
Female 30.4 26.2–34.6 <0.001 0.73e 6.0 4.0–7.9 <0.001 0.26d
Overallb Male 15.1 13.3–17.0 <0.001 0.66e 4.4 3.3–5.5 <0.001 0.29d
Female 21.9 20.3–23.6 <0.001 0.82e 6.8 5.8–7.8 <0.001 0.37d
a
Univariate regression analysis of TBF and %FAT on BMIz b
Multivariate regression analysis of TBF and %FAT on BMIz and age c
BMIz was non-predictive of this outcome variable d
BMIz was a moderate predictor of this outcome variable e
BMIz was a strong predictor of this outcome variable
Fig. 1Regression analysis (R2) for moving average across continuous age range of total fat mass (TFM) on the BMI z-score (BMIz) and relative fat
m2which was lower than the mean BMI for the present sample (30.2 kg/m2). The Pietrobelli work represents earlier exploratory efforts to understand and associate BMI with more robust measures of body fat. The new CDC BMI growth charts utilize percentiles due to the fact that simple BMI does not represent relative adipos-ity very well; BMI z-scores must be calculated and used when working with children and adolescents [42].
Our conclusions align with Katzmarzyk [24]; we recognize that healthcare practitioners should also ex-ercise caution when comparing BMI across race-ethnicity groups. Additionally, BMI may misclassify some segments of the pediatric population. Clinicians should be careful when utilizing BMI alone to classify an individual’s %FAT [26, 28, 40, 43].
The present assessment is novel because it 1) uses an analysis stratified by age to evaluate the limitation of BMI and BMIz for estimating adiposity (TFM and %FAT) in overweight and obese children, 2) identifies the non-predictive nature of BMIz relative to TFM in younger children (4–9 years) and 3) utilizes DXA for body fat to evaluate these relationships. A strength of the current study was the age-stratified analysis in a large cohort (n= 663) of overweight and obese children. A limitation of the study and area of future investigation would be to identify the difference in correlations or associations by race-ethnicity. Another potential area of future research is to investigate if the BMIz is a valid tool for monitoring significant changes in a pediatric subject’s TFM, lean mass and %FAT over time when compared to DXA.
Conclusions
These findings advance the understanding of the utility and limitations of BMI in children. This study utilized multivariate modeling to assess the relationship between BMIz with TFM and %FAT using DXA in an overweight and obese pediatric population (4–18 years) stratified by age. These data indicate that there is a strong interaction effect for the association between BMIz and TFM with respect to age. In overweight and obese youth, aged 9 to 18 years, BMI z-score is a strong predictor for TFM, but only a weak-to-moderate predictor of %FAT. In over-weight and obese children younger than 9 years, the BMIz is a weak predictor for both TFM and %FAT. Under the conditions of the study, these data indicate a relationship between BMI and TFM, a weaker associ-ation with relative body fat (%FAT), and demonstrate the limitation of using BMIz as a predictor of %FAT in overweight and obese children under 9 years of age.
Abbreviations
%FAT:Total percent body fat; BMI: Body mass index; BMIz: Body mass index z-score; DXA: Dual energy x-ray absorptiometry; TFM: Total fat mass
Acknowledgements
The authors want to acknowledge all staff members from the Pediatric Fitness Clinic for their passion, dedication and assistance in collecting data per clinic policies and procedures. This includes Dr. Aaron Carrel, Dr. Alexander Adams, Dr. Blaise Nemeth, Dr. Jennifer Rehm, Randy Clark, Judy Hilgers, Ellen Houston, Stephanie Wolf, Karissa Peyer, Amy Mihm, Amy Caulum, Amanda Hesse, Nora McCormick, and Cassie Vanderwall.
Availability of data and materials
All data analyzed during this study are included in this published article. The datasets used and analyzed during the current study are available from the corresponding author on reasonable request.
Funding
There is no funding.
Authors’contributions
CV, RC, and AC conceptualized the study in accordance with all authors, drafted the initial manuscript and led the process for revising the manuscript for submission. JE was responsible for the statistical methods, analysis and results section. All authors approved the final manuscript as submitted and agree to be accountable for all aspects of the work. No funds were received or distributed to anyone to produce this manuscript.
Competing interests
The authors declare no competing of interest, financial or other.
Consent for publication
Not applicable.
Ethics approval and consent to participate
The study was approved by the Institutional Review Board of University of Wisconsin at Madison. Need for signed consent and assent was waived because this study presents a minimal risk for the breach of confidentiality to subjects. The waiver did not adversely affect the rights and welfare of subjects. Confidentiality protections are in place. The research could not practicably be carried out without a waiver of informed consent since the large volume of research subjects proposed along with the difficulty that many patients are lost to follow-up and the time to get permission of each patient for the outcomes analysis would not be practical. In addition, clinical care for patients will already be completed when those patients data will be extracted from the medical records for use in future outcomes analysis done under the IRB protocol. Therefore, it was deemed impractical by the aforementioned IRB to obtain consent from these subjects.
Publisher’s Note
Springer Nature remains neutral with regard to jurisdictional claims in published maps and institutional affiliations.
Author details
1
University of Wisconsin, Madison, WI, USA.2UW Health, University Hospital, 600 Highland Ave, Madison, WI 53792, USA.
Received: 10 March 2017 Accepted: 28 May 2017
References
1. Karnik S, Kanekar A. Childhood Obesity: A Global Public Health Crisis. Int J Prev Med. 2012;3(1):1–7.
2. Williams EP, Mesidor M, Winters K, Dubbert PM, Wyatt SB. Overweight and Obesity: Prevalence, Consequences, and Causes of a Growing Public Health Problem. Curr Obes Rep. 2015;4:363.
3. Ogden CL, Carroll MD, Kit BK, Flegal KM. Prevalence of childhood and adult obesity in the United States, 2011-2012. J Am Med Assoc. 2014;311(8):806–14. 4. National Center for Health Statistics. Health, United States, 2011: With
Special Features on Socioeconomic Status and Health. Hyattsville: U.S. Department of Health and Human Services; 2012.
6. Barlow SE. AAP Expert Committee. AAP Expert Committee
Recommendations Regarding Prevention, Assessment and Treatment of Child Obesity. Pediatrics. 2007;120:s164–92.
7. Dietz WH, Robinson TN. Overweight children and adolescents. N Engl J Med. 2005;352:2100–9.
8. (CDC) CfDCaP. 2012; https://www.cdc.gov/obesity/childhood/defining.html. Accessed Sept 2015.
9. Kuczmarski RJ, Flegal KM. Criteria for definition of overweight in transition: background and recommendations for the United States. Am J Clin Nutr. 2000;72:1074–81.
10. Ogden CL, Li Y, Freedman DS, et al. Smoothed percentage body fat percentiles for U.S. children and adolescents, 1999–2004. In: National health statistics reports; no 43. Hyattsville: National Center for Health Statistics. p. 2011. 11. Ogden CL, Carroll MD, Kit BK, et al. Prevalence of obesity and trends in
body mass index among US children and adolescents, 1999–2010. JAMA. 2012;307:483–90.
12. Arslanian SA, Connor EL, Farooqi IS, et al. Pediatric Obesity—Assessment, Treatment, and Prevention: An Endocrine Society Clinical Practice Guideline. J Clin Endocrinol Metab. 2017;102(3):709–57.
13. Holmes ME, Eisenmann JC, Ekkekakis P, et al. Physical activity, stress, and metabolic risk score in 8- to 18-year-old boys. J Phys Act Health. 2008;5(2):294–307.
14. Freedman DS, Khan LK, Dietz WH, et al. Relationship of childhood obesity to coronary heart disease risk factors in adulthood: the Bogalusa Heart Study. Pediatrics. 2001;108(3):712–8.
15. Kelly AS, Barlow SE, Rao G, et al. American Heart Association Atherosclerosis, Hypertension, and Obesity in the Young Committee of the Council on Cardiovascular Disease in the Young, Council on Nutrition, Physical Activity and Metabolism, and Council on Clinical Cardiology. Severe obesity in children and adolescents: identification, associated health risks, and treatment approaches: a scientific statement from the American Heart Association. Circulation. 2013;128(15):1689–712.
16. Flegal KM, Ogden CL, Yanovski JA, Freedman DS, Shepherd JA, Graubard BI, et al. High adiposity and high body mass index-for-age in US children and adolescents overall and by race-ethnic group. Am J Clin Nutr. 2010;91(4):1020–6. 17. Deurenberg P, Deurenberg-Yap M, Guricci S. Asians are different from
Caucasians and from each other in their body mass index/body fat per cent relationship. Obes Rev. 2002;3(3):141–6.
18. Dietz WH. Health consequences of obesity in youth: Childhood predictors of adult disease. Pediatrics. 1998;101:518–25.
19. Lee CD, Blair SN, Jackson AS. Cardiorespiratory fitness, body composition, and all-cause and cardiovascular disease mortality in men. Am J Clin Nutr. 1999;69(3):373–80.
20. Sinha R, Dufour S, Petersen KF, et al. Assessment of skeletal muscle triglyceride content by nuclear magnetic resonance spectroscopy in lean and obese adolescents: relationships to insulin sensitivity, total body fat, and central adiposity. Diabetes. 2002;51(4):1022–7.
21. Sui X, LaMonte MJ, Laditka JN, et al. Cardiorespiratory fitness and adiposity as mortality predictors in older adults. JAMA. 2007;298(21):2507–16. 22. Krebs NF, Himes JH, Jacobson D, Nicklas TA, Guilday P, Styne D.
Assessment of child and adolescent overweight and obesity. Pediatrics. 2007;120:S193–228.
23. U.S. Department of Health and Human Services, Centers for Disease Control and Prevention. Body Mass Index: Considerations for Practitioners. Retrieved from https://www.cdc.gov/obesity/downloads/BMIforPactitioners.pdf. Accessed Jan 2017
24. Katzmarzyk PT, Barreira TV, Broyles ST, Chaput J-P, Fogelholm M, Hu G, Kuriyan R, Kurpad A, Lambert EV, Maher C, Maia J, Matsudo V, Olds T, Onywera V, Sarmiento OL, Standage M, Tremblay MS, Tudor-Locke C, Zhao P, Church TS, the ISCOLE Research Group. Association between body mass index and body fat in 9–11-year-old children from countries spanning a range of human development. Int J Obes Suppl. 2015;5:S43–S46. 25. Chin J, Wang H, Jia-Shuai M. The association between body mass index,
waist circumference with body fat percent, and abdominal fat rate in overweight and obese pupils. Prev Med. 2013;47(07):603–7. 26. Widhalm K, Schönegger K. BMI: Does it really reflect body fat mass? J
Pediatr. 1999;134(4):522.
27. Martin-Calvo N, Moreno-Galarraga L, Martinez-Gonzalez MA. Association between Body Mass Index, Waist-to-Height Ratio and Adiposity in Children: A Systematic Review and Meta-Analysis. Nutrients. 2016;8:8.
28. Burkhauser RV, Cawley J. Beyond BMI: The value of more accurate measures of fatness and obesity in social science research. J Health Econ. 2008;27:519–29. 29. Janz KF, Butner KL, Pate RR. The role of pediatricians in increasing physical
activity in youth. JAMA Pediatr. JAMA Pediatr. 2013;167(7):595–6. 30. Perrin EM, Finkle JP, Benjamina JT. Obesity prevention and the primary care
pediatrician’s office. Curr Opin Pediatr. 2007;19(3):354–61.
31. Sothern MS, Gordon ST. Family-based weight management in the pediatric healthcare setting. Obes Manag. 2005;1(5):197–202.
32. Daniels SR, Hassink SG, Committee on Nutrition. The role of the pediatrician in primary prevention of obesity. Pediatrics. 2015;136:e275.
33. O’Brien SH, Holubkov R, Cohen RE. Identification, Evaluation, and Management of Obesity in an Academic Primary Care Center. Pediatrics. 2004;114:e154–9.
34. Yi-Frazier JP, Larison C, Neff JM, et al. Obesity in Pediatric Specialty Clinics: An Underestimated Comorbidity. Clin Pediatr. 2012;51(11):1056–62. 35. Clark RR, Sullivan JC, Bartok C, Schoeller DA. Multi-component
cross-validation of minimum weight predictions for college wrestlers. Med Sci Sports Exerc. 2003;35(2):342–7.
36. Clark RR, Bartok C, Sullivan JC, Schoeller DA. Minimum weight predictions cross-validated using a four-compartment model. Med Sci Sport Exerc. 2004; 36(4):639–47.
37. Clark RR, Sullivan JC, Bartok CJ, Carrel AL. DXA provides a valid minimum weight in wrestlers. Med Sci Sports Exerc. 2007;39(11):2069–75. 38. Cornier M-A, Despres J-P, Davis N, Grossniklaus DA, Klein S, Lamarche B,
et al. Assessing Adiposity: A Scientific Statement from the American Heart Association. Circulation. 2011;124:1996–2019.
39. Boeke CE, Oken E, Kleinman KP, Rifas-Shiman SL, Taveras EM, Gillman MW. Correlations among adiposity measures in school-aged children. BMC Pediatr. 2013;13:99.
40. Freedman DS, Ogden CL, Blanck HM, Borrud LG, Dietz WH. The Abilities of Body Mass Index and Skinfold Thicknesses to Identify Children with Low or Elevated Levels of Dual-Energy X-Ray Absorptiometry Determined Body Fatness. J Pediatr. 2013;163:160–6.
41. Pietrobelli A, Faith MS, Allison DB, Gallagher D, Chiumello G, Heymsfield SB. Body mass index as a measure of adiposity among children and adolescents: A validation study. J Pediatr. 1998;132:204–10.
42. U.S. Department of Health and Human Services, Centers for Disease Control and Prevention. CDC Growth Charts: United States. Retrieved from: http://www.cdc.gov/growthcharts/background.htm. Accessed Jan 2017. 43. Flegal KM, Ogden CL. Childhood Obesity: Are We All Speaking the Same
Language? Adv Nutr. 2011;2:159S–66S.
• We accept pre-submission inquiries
• Our selector tool helps you to find the most relevant journal • We provide round the clock customer support
• Convenient online submission • Thorough peer review
• Inclusion in PubMed and all major indexing services • Maximum visibility for your research
Submit your manuscript at www.biomedcentral.com/submit