Modeling and analysis of surface roughness
in WEDC of SiC
P
/6061 Al MMC through
response surface methodology
PRAGYA SHANDILYA*Department of Mechanical and Industrial Engineering, Indian Institute of Technology, Roorkee, 247667, Uttarakhand, India
P.K. JAIN
Department of Mechanical and Industrial Engineering, Indian Institute of Technology, Roorkee, 247667, Uttarakhand, India
N.K. JAIN
Department of Mechanical Engineering, Indian Institute of Technology, Indore, 452017 India
Abstract
The present research study deals the wire electric-discharge cutting (WEDC) of 10% SiCp/ Aluminum 6061
metal matrix composite (MMC). Response surface methodology (RSM) has been used to plan and analyze the experiments. Four WEDC parameters namely servo voltage, pulse-on time, pulse-off time and wire feed rate were varied to study their effect on the quality of cut in SiCp/6061 aluminum MMC using surface roughness as
response parameter. The mathematical relationship between WEDC input process parameters and surface roughness was established to determine the value of surface roughness mathematically. To identify the significant factors for WEDC process, analysis of variance (ANOVA) was employed.
Keywords: WEDC; MMC; RSM
1. Introduction
MMCs have found many successful industrial applications in recent past as high-technology materials due to their properties such as high strength-to-weight ratio, high toughness, and lower value of coefficient of thermal expansion, good wear resistance, and capability of operating at elevated temperatures [Taha (2001), Rosso (2006) and Miracle (2005). MMCs are fabricated using several processes such as casting, forging and extrusion. However, cutting and finishing operations on MMCs are not well understood. Among the different machining processes wire electrical discharge machining (WEDM) or WEDC is considered as an effective and economical process during machining of MMCs [Ho et al.(2004)].
Gatto and Luliano (1997) performed the WEDM tests under one roughing and two finishing conditions on two composites i.e. 15% SiCw/2009Al and 20% SiCw/2009Al. Results show that the machining speed for
cutting of both composites are equal. The surface roughness values of the machined surface of the 15% SiCw/2009Al alloy composite are less than the corresponding values for the 20% SiCw/2009Al alloy composite.
It was observed that SiC reinforcement and Cu precipitates were absent in the outer recast layer. Rozenek et al. (2001) investigated the effect of various machining parameters (i.e. discharge current, pulse-on time, pulse-off time, voltage) on the machining feed rate and surface roughness during WEDM of AlSi7Mg/SiC and AlSi7Mg/Al2O3 MMCs Ali (2006) investigated on the effect and optimization of machining parameters on the
non-using taguchi method. Results show that reinforcement percentage, current and pulse-on time has significant effect on cutting rate, surface finish and kerf width.
According to the literature survey, it observed that extensive experimental work is needed to analyze the effect of process parameters on product quality. RSM approach of design of experiments (DOE) is one of the emerging techniques, which helps in carrying out the analysis of experiments with the least experimental effort [Montgomery (1997)]. The present work focuses on the modeling and prediction of surface roughness through RSM during WEDC of SiCp/6061 Al MMC.
2. Materials and Methods
The experiments were conducted on the ECOCUT WEDM machine from Electronica India Pvt Ltd. A diffused brass wire of 0.25 mm diameter was used as the cutting tool. Aluminum (6061) based MMCs made by stir casting having 10% SiC particles (by weight) as reinforcement were used as the workpieces. The workpieces were of rectangular shape having a thickness of 6 mm. The deionized water was used as dielectric and its dielectric temperature was kept at 20ºC. The four input parameters namely servo voltage (SV), pulse-on time (TON), pulse-off time (TOFF) and wire feed rate (WF) were chosen as process variables to study their effects on
the quality of cut in SiCp/6061 aluminum MMC using surface roughness as response parameter. The ranges of
these process variables were selected on the basis of literature survey, machine capability and preliminary experiments conducted by using one variable at a time approach. Table 1 gives the levels of various process parameters and their designations. The surface roughness was measured by using SCANINING PROBE MICROSCOPE (Model NTEGRA).
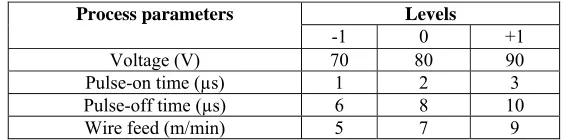
Table 1. Levels of process parameters
Process parameters Levels
-1 0 +1
Voltage (V) 70 80 90
Pulse-on time (µs) 1 2 3
Pulse-off time (µs) 6 8 10
Wire feed (m/min) 5 7 9
3. Response surface modeling
Response surface methodology (RSM) approach is the procedure for determining the relationship between various process parameters with various machining criteria and exploring the effects of these process parameters on the coupled responses [Myers and Montgomery (2002)]. In this work also RSM is used to determine the relationship between the input process parameters of WEDC with surface roughness. In order to study the effects of WEDC parameters, on surface roughness second order polynomial response surface mathematical model developed. Commonly, the response surface is described by an equation of the form [Sameh (2009)]: y = βo + ∑ + ∑ + ∑ ∑ … … . (1)
where, y is the corresponding response produced by input process parameters of WEDM and (1,2,…..) are coded levels of S quantitative process variables. The terms βo, βi, βii and βij are the second order
regression coefficients. In order to study the effects of input process parameters during WEDC of SiCp/6061 Al
MMC on surface roughness, a second order polynomial response can be fitted as follows:
Y= + + + + +
(2) Where , , and are voltage, pulse-on time, pulse-off time and wire feed rate respectively.
4. Results and Discussions
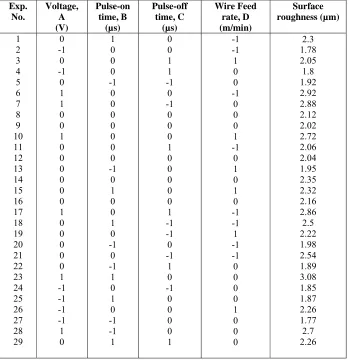
Table 2. Box Behnken design with four parameters and experimental surface roughness Exp. No. Voltage, A (V) Pulse-on time, B (µs) Pulse-off time, C (µs) Wire Feed rate, D (m/min) Surface roughness (µm) 1 2 3 4 5 6 7 8 9 10 11 12 13 14 15 16 17 18 19 20 21 22 23 24 25 26 27 28 29 0 -1 0 -1 0 1 1 0 0 1 0 0 0 0 0 0 1 0 0 0 0 0 1 -1 -1 -1 -1 1 0 1 0 0 0 -1 0 0 0 0 0 0 0 -1 0 1 0 0 1 0 -1 0 -1 1 0 1 0 -1 -1 1 0 0 1 1 -1 0 -1 0 0 0 1 0 0 0 0 0 1 -1 -1 0 -1 1 0 -1 0 0 0 0 1 -1 -1 1 0 0 -1 0 0 0 1 -1 0 1 0 1 0 -1 -1 1 -1 -1 0 0 0 0 1 0 0 0 2.3 1.78 2.05 1.8 1.92 2.92 2.88 2.12 2.02 2.72 2.06 2.04 1.95 2.35 2.32 2.16 2.86 2.5 2.22 1.98 2.54 1.89 3.08 1.85 1.87 2.26 1.77 2.7 2.26
Table 3 shows the variance analysis results of the introduced models. The associated P value for the model is lower than 0.05 (i.e. α = 0.05 or 95% confidence) indicating that the model is statistically significant. It also shows the value of R2-statistic and adjusted R2-statistic. The R2-statistic is defined as the ratio of variability
explained by the model to the total variability in the actual data and is used as a measure of the goodness of fit. The more R2 approaches unity, the better model fits the experimental data. For instance, the obtained value of
0.884 for R2 in case of surface roughness implies that the model explains approximately 88.4% of the variability
in surface roughness, where as R2 adjusted for the model is 0.881.
Table 4 presents the values of b coefficients of model. Values of “ Prob > F” less than 0.0500 indicate model terms are significant. According to this Table, voltage (V) , pulse-on time (TON), pulse-off time (TOFF),
quadratic effect of voltage (V× V) and interaction effect of voltage with wire feed rate (V× WF) have significant effects on surface roughness. The other model terms those associated P values are more than 0.05 are non-significant in this case. The regression equation to determine the predicted values of output parameter (i.e. surface roughness in this study) is found as follow.
2.16 0.49 0.18 0.083 0.005 0.22
Table 3. Variance analysis for the model of average cutting speed
Sourse Sum of Square d.f. Mean Square F-value P-value Model.
Residual Total
3.18 0.24 4.05
14 14 28
0.27
0.017 15.84 <0.0001
R-Squared Adjusted R-Sqared Standard Dev.
0.8836 0.8812 0.13
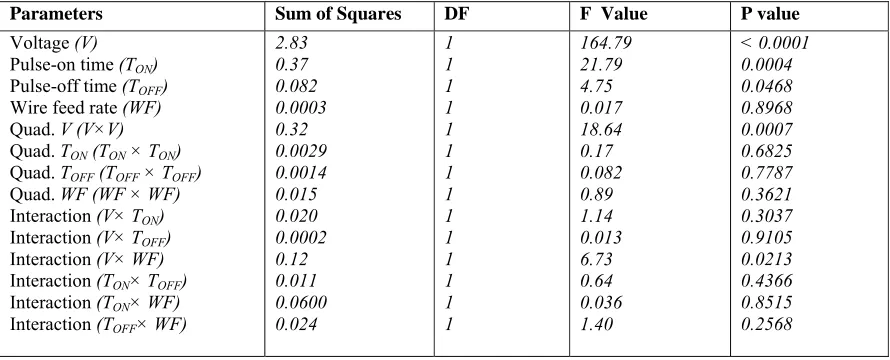
Table 4. The effect of voltage, pulse-on time, pulse-off time and wire feed rate on surface roughness
Parameters Sum of Squares DF F Value P value
Voltage (V) Pulse-on time (TON)
Pulse-off time (TOFF)
Wire feed rate (WF) Quad. V (V×V) Quad. TON (TON × TON)
Quad. TOFF (TOFF × TOFF)
Quad. WF (WF × WF) Interaction (V× TON)
Interaction (V× TOFF)
Interaction (V× WF) Interaction (TON× TOFF)
Interaction (TON× WF)
Interaction (TOFF× WF)
2.83 0.37 0.082 0.0003 0.32 0.0029 0.0014 0.015 0.020 0.0002 0.12 0.011 0.0600 0.024
1 1 1 1 1 1 1 1 1 1 1 1 1
1
164.79 21.79 4.75 0.017 18.64 0.17 0.082 0.89 1.14 0.013 6.73 0.64 0.036 1.40
< 0.0001 0.0004 0.0468 0.8968 0.0007 0.6825 0.7787 0.3621 0.3037 0.9105 0.0213 0.4366 0.8515 0.2568
4.1 Optimization of response parameters
Optimization of individual responses were performed separately for achieving the desired surface roughness based on the developed mathematical models (i.e. equations). The ‘Design Expert 8.0’ software was used to optimize the responses during WEDC of SiCp/6061 Al MMC. The target value for the surface roughness were
set as minimum. The optimal values of input process parameters are listed in Table 5. The value of composite desirability D, was taken as 1 (Montgomery, 1997).
An experiment was carried out at the optimal parametric settings for surface roughness so that targeted value of response parameter can be obtained. Table 5 shows the predicted value of surface roughness obatined from the mathematical relationships as given in equation (3) and experimental result with the parameteric optimal setting as obtained from RSM model. Prediction are in good agreement with the experimental results because the percentage error of the predicted value with respect to the experimentally observed value for surface roughness is not high.
Table 5. Optimized input process parameters and optimum value of surface roughness
Respon se
Optimize value of input parameters
Modified value of inputs parameters
Predicte d value (µm)
Experiment al value (µm)
% error SV
(V) TON (µs)
TOFF (µs)
WF (m/min )
SV (V)
TON (µs)
TOF
F (µs)
WF (m/min)
Surface roughne ss
4.2 Effects of input process parameters on surface roughness
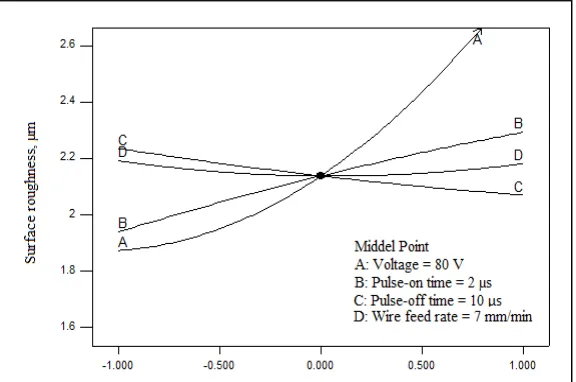
Figure 1 depicts the effect of voltage, pulse-on time, pulse-off time and wire feed rate on surface roughness. According to this figure the value of surface roughness increases with increase in voltage and pulse-on time. Where as pulse-off time have the adverse effect on surface roughness. As the pulse-off time increases the value of surface roughness decreases. There is no change in surface roughness with change in wire feed rate.
Figure 1. Effect of voltage, pulse-on time, pulse-off time and wire feed rate on surface roughness [X-axis in coded value]
5. Conclusions
In this work, an attempt was made to consider the effect of voltage, pulse-on time, pulse-off time and wire feed rate on surface roughness in WEDC of SiCp/6061 aluminum metal matrix composite. According to the ANOVA
results, voltage is the most significant parameters on surface roughness where as pulse-on time and pulse-off time are less significant. Wire feed rate has insignificant effect on average cutting speed. Based on the optimization results, it has been found that 71.01 V as voltage, 1.00 µs as pulse-on time, 6.04 µs as pulse off time and 5.17 m/min wire feed rate are optimum for the present study. The predicted value of surface roughness found very close to the experimental value of experimental value at optimum level of input process parameters.
References
[1] Ali T. (2006): Parametric study and optimization of wire electrical discharge machining of Al-Cu-TiC-Si P/M Composite, International Journal of Machining and Machinability of Materials, 1 (4), pp. 380-395.
[2] Gatto A.; Luliano L. (1997): Cutting mechanism and surface features of WED machined metal matrix composites, Journal of Materials Processing Technology, 65, pp. 209-214.
[3] Ho KH; Newman ST; Rahimifard S; Allen RD (2004): State of art in wire electrical discharge machining (WEDM), International Journal of Machine Tools and Manufacturing, 44, pp. 1247-1259.
[4] Miracle, D.B. (2005): Metal matrix composites-from science to technological significance, Composite Science and Technology, 65,
pp. 2526-2540.
[5] Montgomery D.C. (1997): Design and analysis of experiments, fourth ed., (Wiely, New York).
[6] Myers R.H. and Montgomery D.C. (2002): Response surface methodology: process and product optimization using designed experiments, Second edition, Wiley, New York
[7] Patil N.G. and Brahmankar P.K. (2010): Determination of material removal rate in wire electro-discharge machining of metal matrix composites using dimensional analysis. International Journal of Advanced Manufacturing Technology, 48, pp. 537-555.
[8] Rosso, M. (2006): Ceramic and metal matrix composites: routes and properties, Journal of Materials Processing Technology, 175, pp.
364-375.
[9] Rozenek M.; Kozak J.; Dabrowski L; and Lubkowski K. (2001): Electrical discharge machining characteristics of metal matrix composites, Journal of Materials Processing Technology, 109, pp. 367-370.