The Role of Cleaner-Production in
Ensuring a Cleaner Processing and Mining
Environment in a Developing African
Country. Case of a Midlands Steel Smelting
Plant in Zimbabwe
Simon Chinguwa1,Masters in Manufacturing Systems and Operations Management (UZ), B.Eng Industrial and Manufacturing Engineering Hons (NUST)
Tauyanashe Chikuku2,
Masters In Manufacturing Systems And Operations Management, BSc Mechanical Engineering Hons, Grad C.E. (UZ)
TinasheMandikwaza3 BSc Mechanical Engineering Hons (UZ)
[email protected] Abstract
Mines and Mineral Processing Plants are major contributors to high dust emission. This paper explores Cleaner Production Opportunities, to ensure lower risk of dust explosion, minimum health & safety risks, reduction in environmental issues, operations closer to urban areas, reduction in maintenance and cleaning costs, minimum product shrinkage, load trucks and rail cars faster and to load stockpiles cleanly. The green methods will involve a walk through processing plant and identifying cleaner production opportunities. Characterisation of dust was also done.
Dust Control Methods are going to be reviewed with the aim of minimizing dust-raising, containing it, suppressing it or extracting and collecting the dust eventually. The paper will also design and recommend specific methods of dust reduction for specific operations.
Key words: Mine, Processing, Dust Control, Cleaner-Production, Environmental Management, Respirable Dust, Inhalable Dust, Reengineering.
1.0 Introduction
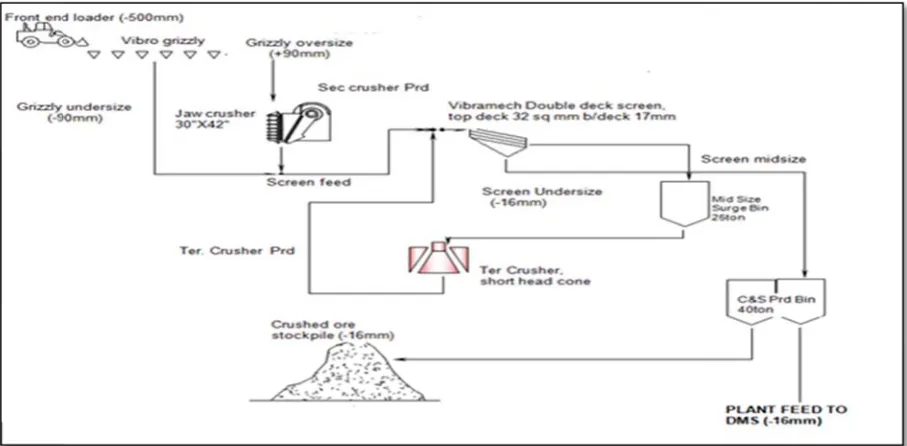
2.0 Plant High dus and Vibr crushing, concentra refining other min The most Fig(2.1) Final pro ore/water processes remove s
Fig 2.1 Mid
3.0Aims This rese processin The obje 4.0 Meth t Description st-emission ar ating Feeders , screening an ation processe are done. Chr nes are blende t produced all is a process f
ocessing of th r slurry, whic s are used, P surface moistu
dlands Crushing a
earch seeks t ng industry ma
ectives of the assess the cu environmenta identify the b as to reduce 3mg/m3 for environment. hodology Literature Sur Walk Throug Detailed analy Evaluate Clea Optimal Desi Economic An n
reas are Conve . The Steel Sm nd grinding of
es including d rome that is m ed with carbo loy is high ca flow diagram
he ores is acc ch reduces par M emissions ure. Drying is
and Screening Se
to increase w aking use of C
research are urrent measur al and health r est available d
dust emissio respirable du
rvey gh a Mineral P
ysis of proces aner Productio ign of dust Co nalysis
eyor Transfer melting Plant i f ore; the sepa drying, calcini
mined at the on and flux an arbon ferrochr for the crushin
complished b rticulate matt can be consi done in natur
ectionProcess Flo
worker safety Cleaner Produ
e to;
res taken to c risks around
dust reduction ns to levels b ust), using C
Processing Plan ss operations on opportuniti ontrol Methods
r Points, Crush in Midlands Z aration of val ing, or pelleti Sister Mine o nd then smelte rome followed ng and screen
by Ball Mills ter (PM) emis iderable. The ral gas-fired ro
ow
y and reduce uction Opportu
contain the d a mineral pro n opportunitie below the ex Cleaner Prod
ant
ies arising wit s
hers, Tipping Zimbabwe, is
luable minera izing of conce of the Process ed in differing d by high carb ning section of
and Rod Cru ssions to negl e concentrated otary dryers. environment unities. dust problem cessing plant s for the vario xposure limits duction princi
thin the plant
and Loading a mineral proc ls from matrix entrates to eas sing Plant and g proportions bon and low c f the plant.
ushers. Grind ligible levels d mineral pro
tal impacts o
on dust cont
ous process op s (10 mg/m3
iples within
Bays, Screen cessing plant x rock throug se further han d iron ore bou
to form vario carbon steels.
ding is perfor but when dry oducts may be
of dust in mi
trol so as to
perations of th for inhalable
a mining or
ning Areas where the gh various ndling and ught from ous alloys. Below in rmed with y grinding e dried to
ining and
minimize
5.0 Literature Survey
5.1 Environmental Management Standards
5.1.1 Environmental Management Agency (EMA) is a legislative instrument promulgated by the Ministry of Environment Zimbabwe. From Atmospheric Pollution Control, (CAP.20:27) regulations of 2009 from (EMA 2007) the (EMA) refer to ‘fugitive dust’ and ‘particulate matter’ in the environment and work space.
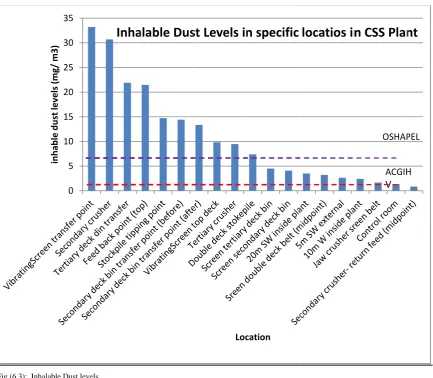
5.1.2 International standards Occupational Safety and Health Administration Permissible Exposure Limit (OSHAPEL) gives an enforceable standard that must not be exceeded during any 8 hour work shift of a 40 hour week. The exposure limits are 15mg/m3 for inhalable dust and 5mg/m3 for respirable dust.
5.1.3 American Conference of Governmental Industrial Hygienists (ACGIH).
This level is a recommended time-weighted average (TWA) upper limit exposure for a normal 8-10 hour working day of a 40 hour week. The exposure limits are 10 mg/m3 for inhalable dust and 3mg/m3 for respirable dust.
5.1.4 The Control of Substances Hazardous to Health (COSHH), 2002 Regulations, UK
The COSHH definition of a substance hazardous to health includes dust of any kind when present at a concentration in air equal to or less than 10 mg/m3 for an 8-hour TWA of inhalable dust or 4 mg/m3 for an 8-hour TWA of respirable dust. This means that any dust will be subject to COSHH if people are exposed above these levels.
5.1.5 Units for Exposure Limits (literature)(mg/m3). For gases and vapours the concentration is also, with a few exceptions, indicated in parts per million (ppm) by volume. The following conversion formula can be used to convert from ppm to mg/m3.
Concentration in ⁄ . ……….... (1)
Where 24.45 = Molar Volume in litres at 25 0C and 101.3 kPa.
To characterise the dust we used Du`1st Deposition Gauges g/m /month, Dust and Particulate Monitor1μgm-3 to 2500 mgm-3
5.2 Dust Control Methods (Cheng and Zukovich, 1973).
5.2.1 Dust Collection System
Dust collection systems use ventilation principles to capture the dust-filled airstreams and carry it away from the source through duct-work to the collector..
5.2.2 Dust Collection System for Ore Dryer
The hood must be enclosed as much as possible so as to keep out air currents surrounding it as shown above. Proper duct velocity for most ore dust applications should be between 3500ft/ min to 4000fit/min. Lower speeds cause falling, resulting in clogging and too high speeds result in erosion of elbows.
The efficiency of a dust collector is the filtration efficiency of the unit and the capture efficiency of its inlet. For collectors properly designed to trap respirable dust, the filtration efficiency is as high as 90%-95%.
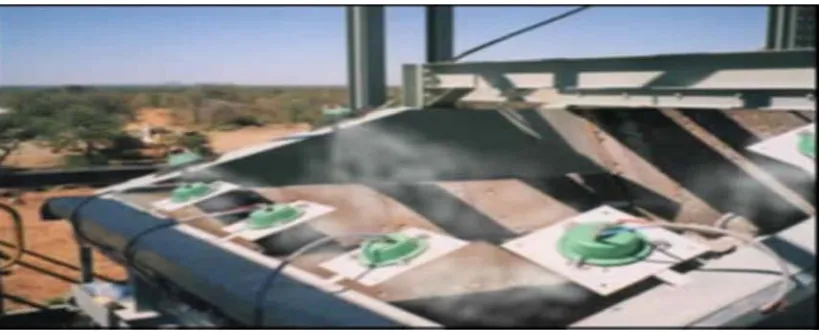
5.2.3 Wet Dust Suppression Systems
5.2.4 Pla
This met due to its system is Enclosur tolerate e control e precede a 5.2.5 Wa This met amount o coal mini of consid studies h (MRDE prevent proportio hardware Water an which in of 20% t 1984)
Fig (5.1): F
5.2.6 Des The spray critical. F pressure factors: 5.2.7 Dro The nozz decreases pressures wet dust systems. high-pres
ain Water Spr
thod uses plain s high surface
s simple to d re tightness is
excessive moi efficiency is l
a screen is req
ater Spray wi
thod uses surf of attention, p ing because o derable resear have shown a 1981; Chande blinding. Equ oning equipm e is necessary.
nd a special b creases wettin to 60% comp
Foam Spray Point
sign of a Wat
y nozzle is the Factors such a
all vary depen
oplet Size
zle's droplet s s as the oper s can be obtai t suppression The fine drop ssure water to
rays
n water to we tension. Adv design and op
not essential isture. Water ow, unless la quired to preve
ith Surfactan
factants to low erhaps becaus of the hydroph rch over the y respirable dus er et al. 1991
uivalent effic ment used to m
.
blend of surfac ng efficiency.
ared to water
ts on a Grizzly Cr
ter-Spray Sys
e heart of a wa as droplet size nding on the n
size distributio rating pressur ined from the systems. Ve plets usually atomize wate
et the material vantages of wa
perate a limit l. Disadvanta sprays cannot arge quantities ent blinding.
nt (WSS)
wer the surfac se they seem t hobic nature o years, without
st control effe ). Careful app ciency is pos meter the flow
ctant make th For dust con r. But the pro
rusher at a Botsw
stem
ater-spray sys distribution a nozzle selected
on is the mos re increases. e nozzle manu
ry fine dropl are generated er in the desire
l. However, it ater are that it ted carryover ages of Water t be used whe s of water are
ce tension of to offer an ea of coal. The ef much of a de ectiveness com plication at tr ssible with l w of surfacta
he foam. The ntrol, foam wo oduct is conta
wana coal mine.
stem. Therefor and velocity sp
d. The followi
st important v Information a ufacturer. Coa lets (10-150 d by fogging ed droplet ran
t is difficult to t is the least e r effect at sub
r sprays, cann en temperatur e used. Carefu
water. Wettin asy fix to dust
ffectiveness of efinitive answ mpared to plai ransfer points less water. E ant require ma
foam increas orks better tha
minated with
re, the physica pray pattern a ing is a genera
variable for p about the dro arse droplets ( µm) may be nozzles, whic nge.
o wet most su xpensive meth bsequent tran not be used fo
es fall below ul application
ng agents rece problems. M f wetting agen wer on how w
in water, rang that precede Equipment su aintenance. F
es the surface an water. It pr surfactants. (
al characterist nd angle, and al discussion o
roper dust co oplet size dat (200-500 µm) required for ch may use ei
urfaces with pl hod of dust co nsfer points is or products th freezing. Usu n at transfer p
eive a disprop Most interest ha nts has been th well they work ging from 25%
a screen is re uch as the p Freeze protect
e area per uni rovides dust r (Mukherjee a
tics of the spra d water flow ra of these impo
ontrol. The dr ta at various ) are recomm airborne dus ither compres lain water ontrol, the s possible hat cannot ually, dust points that portionate as been in he subject k. Various % to 40%. equired to pump and
ion of all
5.2.8 Droplet Velocity
Normally, higher droplet velocities are desirable for both types of dust control through water sprays. Information on the droplet velocity can be obtained from the nozzle manufacturer.
5.2.9 Spray Pattern
Nozzles are categorized by the spray patterns they produce:
Solid-cone nozzles product droplets that maintain a high velocity over a distance.
Hollow-cone nozzles produce a spray pattern in the form of a circular ring. They are useful where dust is widely dispersed.
Flat-spray nozzles produce relatively large droplets that are delivered at a high pressure and good for preventive type systems).
Fogging nozzles produce a very fine mist (a droplet size distribution ranging from submicron to micron). They are useful for airborne dust control systems.
5.2.10 Flow Rate
The flow rate of water through a nozzle depends on the operating pressure. The flow rate and operating pressure are related by the equation below;
………...
Where K is the nozzle constant (reference 2<K<5)
Knowledge of the water flow rate through the nozzle is necessary to determine the percentage of moisture added to the material stream. The following factors should be considered in selecting the nozzle location:
It should be readily accessible for maintenance.
It should not be in the path of flying material.
For wet dust suppression systems, nozzles should be upstream of the transfer point where dust emissions are being created. Care should be taken to locate nozzles for best mixing of material and water. For airborne dust capture, nozzles should be located to provide maximum time for the water droplets to interact with the airborne dust.
5.2.11 Water Flow and Compressed Airflow Rates
Once the nozzle is selected, its spray pattern and area of coverage can be used to determine water flow rate and/or compressed airflow rates and pressure requirements. This information is normally published by the nozzle manufacturer. These must be carefully coordinated with the maximum allowable water usage. Water flow rates will be highly variable depending on the size and type of material, the type of machinery, and the through-put of material.
5.2.12 Control of Conveyor Dust (Goldbeck and Marti 1996; Swinderman et al. 1997).
NB: Exc that a bel
6.0 Resu The dust respirable for minim 6.1)
6.1 Dust
Fig (6.1):
6.2 Emis
Fig (6.2) Screening
Fig (5.2): Convey
essive wetting lt washing sys
ults and Findi t levels measu
e and inhalab mal levels. Th
Sources
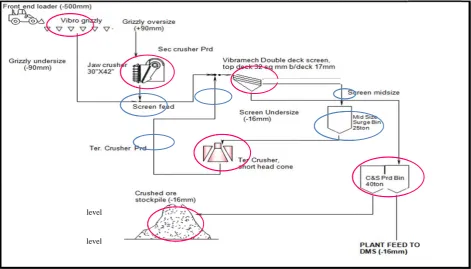
Process Flow C
ssion Levels
) and (6.3) b g Plant.
Key
High dust Low dust
yor Transfer Poin
g entails dust stem is installe
ings on Dust G ured at specif
le dust levels he main source
Chart Showing D
below show d
level level
nt with Dust Supp
generation af ed: the belt is
Generation fic points at t
where measu es are shown m
ust Sources_Mid
dust emission
pression System
fter drying; en running true a
the Crushing ured and comp
marked in red
dlands Plant
n levels for v
nsure that bel and not spillin
and Screenin pared to the O d and blue circ
various proce
lt scrapers are ng its contents
ng Section (C OSHAPEL and
cles in the pro
ess operations
e working pro s.
CSS) of the pl d ACGIHLV ocess flow diag
s at the Crus
operly and
lant. Both standards gram (Fig
Fig (6.2): Respirable Dust Levels at Specific Locations
NB: First 9 Locations had dust levels above the ACGIHVL dust level of 3mg. 0.000
2.000 4.000 6.000 8.000 10.000 12.000 14.000 16.000 18.000 20.000
R
e
spir
able
dus
t
lev
e
ls/
mg
Location
Respirable
Dust
Levels
at
Specific
Locations
in
CSS
plant
OSHAPEL
Fig (6.3): I
7.0 - Ana From the overall du
Table 7.1 D
8.0 Mate The char that each to identif cost of; Operation Crushing Screenin Stockpil Belt Con Dry Grin Concent
Inhalable Dust lev
alysis of Emis e detailed anal ust volumes. T
Dust Percentage C
erial Balances rt below (figu h unit operatio fy the inputs a
Ores lost in f Energy losses Handling dus Dust exposur 0 5 10 15 20 25 30 35 inhable dust levels (mg/ m3) n/Activity g ng, ling nveyor System nding trate Drying vels ssions contrib lysis of variou This has been
Contribution of Pr
s and Cleane re 8.1) charac on be evaluate
and outputs of
form of dust; t s; though ener t; transportati e; local author
Inha
ms
butions us ore process n calculated as
rocess Operations
r Production cterizes mass ed separately. f mass and en
this emanating rgy balances a
on of dust to t rity charges fo
alable
Dus
s operations T ssuming no co
s
n Opportuniti input and ou These materia nergy but their
g from produc are beyond the the bins and w or managemen Loc
st
Levels
in
% C
Table 7.1 ind ontrol for the p
ies
tput from a un al balances an r economic sig
ct loss, at each e scope of this waiting areas.
nt cation
n
specific
Contribution f CSS Sectio 66.84% 16.71% 11.14 % 5.31%
icates the perc process operat
nit plant oper nd energy bala gnificance is r
h and every un s study
locatios
in
for The on
rcentage contr tions.
ration and the ances are not related to cost
nit plant opera
n
CSS
Plan
ACGIH V OSHAP % Contributi Entire Proce 58.0% 19.8% 22.2% ribution to
re is need only used ts, such as
Figure 8.1 Midlands Process Flow Diagram. Showing Material Balances
+90mm ore, 74880kg/hr
37.5Water, kg/h
-3 mm ore 75007kg/hr mm ore
74991ton/hr -90mm ore,
74954kg/hr -500 mm, ore,
72000kg/h
Water, 2880ton/h
Water, 74.88kg/h
37.5Water, kg/h
00mm ore
75028kg/hr
00mm ore 74842 ton/hr Heat Energy
Gaseous emissions 200.38 kg/h 50.5Water,
kg/h
Total Water Input,
200.38 kg/h
Total Dust Emissions
36.35819 kg/h from 2.159 00 kg/hr
-16mm ore 75028 kg/hr
14.1kg/h dust Negligible dust emission 20.7355kg/h dust down from 207.3423 kg/hr 0.00359kg/h dust down from 0.359 kg/hr 0.8639kg/h dust from
2.159 00 kg/hr 0.00720 kg /hr dust,
down from0.720kg/h 0.648 kg/hr dust, down
from 2.16kg/h Negligible dust emission
KEY
Process Operations in Blue
Dust Emissions in Red
StockpilingDrying Beneficiation
Feed
Grinding Screening
Secondary Crushing
Screening
Tertiary Crushing
Dry grinding with
air conveying 75057 kg/hr
The principle of conservation of mass is used to come up with the material balance.
Mass of Inputs = Mass of Outputs + Mass of Accumulation within the process……… (8.1)
Input for all the unit process operations is ore and water required for control, Output is the processed ore and by-products like, gaseous emission produced during drying, and dust that is lost to the atmosphere. Accumulation may be in form of dust that is trapped within the equipment but this dust is difficult to quantify. By installing some dust control mechanisms this strapped dust ion kept minimal as it increases equipment wear, especially for components such as bearings and pulleys on which fine dust can cause a "grinding" effect and increase wear or abrasion rates.
8.1 Cleaner Production Solutions
Table 8.1 Cleaner Production Options to be Implemented
SECTION CP OPTIONS RECOMMENDATIONS
/RESPONSIBILITY
FEEDING -Enclosing feeders as much as possible
-Selecting an oversize feeder or a feeder that produces less agitation of the ore.
Implement
(Engineering department)
BELT CONVEYING
-The Ore and the belt should travel in the same direction and at the same speed, whenever possible. -Ore should be loaded onto the centre of the belt.
Implement
(Process department)
Impact Idlers
-At transfer points, adequately spaced impact idlers (1-ft centres) should be used to absorb the force of impact and prevent deflection, thus preventing dust leakage under the seals
Implement
(Engineering department)
Conveyor Skirting
-Double skirting should be installed in the impact zone where incoming ore hits the skirting rubber directly.
Implement
Muck shelves
-Install them to Load the material centrally on the belt and keep the belt properly aligned
Implement
(Engineering department)
Belt Cleaners
-Belt scrapers should be installed at head pulleys to dislodge fine dust particles that may adhere to the belt surface and to reduce carry-back of fine materials on the return.
Implement
(Engineering and Process department)
Conveyor Capacity
-Adjust the belt speed to optimum condition -Change the idlers' angle (for example, from 20° to 35°)
-Increase the conveyor width (for example, from 24 to 36 in.)
Implement
(Engineering and Process departments)
CRUSHING -A crusher feed box with a minimum number of
openings should be installed. -Rubber curtains should be used to minimize dust escape and air flow. -The crusher should be choke-fed to reduce air entrainment and dust emission.
Implement
(Engineering department)
SCREENING -A complete enclosure that can be easily removed for
maintenance and inspection should be used -A tight sealing system reduces dust emissions and also minimizes air flow, which reduces the exhaust volume for the dust collection system installed downstream
Implement
(Engineering department)
HAUL ROADS -Spraying the soil frequently with water, chemicals,
oil, or other stabilizing agents
-Paving the haul roads (Note: Paved roads should be cleaned and vacuumed periodically to remove accumulated soil and dust.)
-Reducing traffic volume by replacing small haul vehicles with larger ones. -Reducing and strictly enforcing traffic speed
Implement
(Process department)
TRUCK DUMPING AND RAIL ROAD DUMPING
-Not to dump large volumes of ore in a relatively short time (3 to 10 seconds), as this displaces an equal volume of air carrying fine dust particles
-Enclosures should be used to contain dust during dumping
Implement
(Process department)
GRINDING ORES -Properly designed enclosures and chutes, as well as
rubber dust seals between moving and stationary components, should be installed at the feed and discharge ends to minimize dust emissions.
-The dirty water from the scrubber system is either cleaned and discharged for other uses at the plant or recycled to the scrubber.
Implement
9.0 Optimal Design of Dust Control Method
9.1 Dust Suppression System (DSS) Specifications
9.1.1 Desired Air Quality
To reduce dust emission within and around the plant to levels below the exposure limits of 10 mg/m3 for inhalable dust and 3mg/m3 for respirable dust. This would ensure a safe working environment for the mine workers.
9.1.2 Expected Efficiency
Selection of a system to be used is based on desired air quality and existing regulations. Dust collection systems provide a reliable and efficient control over a long period however the capital and operating cost are too high. Although wet suppression systems and air borne dust capture systems are less efficient, they are less expensive to install and operate. With proper selection and planning plus cleaner production practices they can be very effective. Two systems have been identified as recommendable for the reduction of dust. These are the atomised water spray system (AWS) and foam system. The AWS is ideally applicable through-out the entire operation process. The foam can be applied sparingly at the beginning of the crushing process to reduce possibility of blinding of the screen. However the foam may require chemical lab tests to ensure it does not affect the processes.
9.2 Design of Concepts 9.2.1 Enclosures
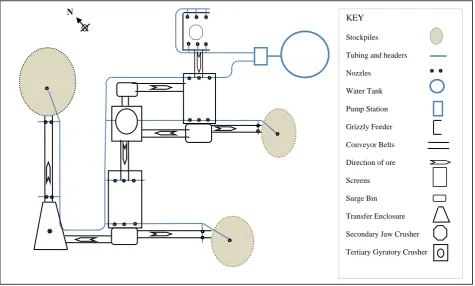
Enclosing the screening decks, screen transfer points and stockpiles has come out to be the best control method at these stations. Stockpile should be retrofitted with such enclosures like the stone ladders, telescopic chutes. This will help reduce dust emissions with the wind breaks that are already built for the ore piles
9.2.2 Atomised Water Sprays (AWS)
From the selection matrix, the AWS system has stood out to be the best control method for dust produced at the secondary crusher, screens and the tertiary crusher. Fig (9.1) below shows therecommended atomised spray system nozzle types and also on it areas where the particular adjustments shown. The total nozzle perimeter for all the sections that have been suggested for an AWS system was found to be 34m. To find the size of the pump station that can supply pump water to all these section the calculations are presented below
9.3 Line Size Calculations for the AWS System 9.3.1 Estimation of Pipe Diameter
Water velocity at 20 °- 25° = 1000kg/m
Viscosity = 0.8 mNs/m
Typical velocity of liquid= 2 m/s Mass flow= 10000/3600 = 2.7kg/s
Volumetric flow = 2.78/1306 =2.13 10 m /s
Area of pipe = volumetric flow/ velocity =2.13 10 /2 = 1.06 10 m
Diameter of pipe = 1.06 10 4⁄ = 0.037 = 37mm
Or using the economic pipe diameter formula by Genereaux (1937)
Economic pipe diameter =282 . .
= 282 2.78 . 1306 . = 34mm, take 40mm
Cross sectional area = ⁄4 40 = 1257mm = 1.26 10 m
9.3.2 Pressure Drop Calculation
Fluid velocity = 2.13 10 / 1.26 10 =1.70m/s
9.3.3 Friction Loss Calculation Using the (Genereaux’s formula, 1937)
Substituting this into the pressure drop equation this gives
∆P = 4.07 10 G . . .
Where ∆P= pressure drop in kN/m G = flow rate kg/s
= density in kg/m
d = pipe internal diameter in mm
∆P = 4.07 10 2.87 . 0.9 10 . 1306 40 . = 1.17kPa/m
The absolute roughness for the commercial steel pipe, e = 0.046mm
Relative roughness e/d = 0.046/40 = 1.15 10 , from the friction factor chart
At = 98 324, R/ =0.0027
Friction loss per meter = 4(R/ ) ( /d)
= 4 0.0027 1306 1.7 / (40 10 ) = 1019N/m
Taking the higher value and design for a maximum flow rate of 20% above the normal (average flow rate:
Friction loss through the bends and block valves can be included in the line pressure- loss calculation as an equivalent length of pipe
All the bends will be taken as 90° of standard radius, equivalent length = 30d and the valves as plug valves, fully open, equivalent length = 18d
9.3.4 Line to Pump Suction Length = 1.5 m
Bend= 1 30 40 10 ) = 1.2m
Valve = 1 18 40 10 ) = 0.7/3.4 m
Entry loss = /2
At maximum design velocity = (1306 10 / 2 10 = 2.7 KPa
Control Valve pressure drop, allow normal 140kPa ( 1.2 ) maximum 200kPa
9.3.5 Line from Pump Discharge
Length = 4 + 5.5 + 20 + 5 + 0.5 + 1 + 6.5 + 2 = 44.5m
Bends = 6 30 40 10 =7.2m
Valves = 3 18 40 10 = 2.2m
Total 54m
Table (9.1): Pump and Line Size Calculations for AWS
Fluid Water
DISCHARGE CALCULATION
Temperature 20
Line Size Calculation
Density 1000 Flow Norm Max
Unit s
Viscosity
0.9 Velocity 1.7 2 m/s
Normal flow
2.78 ∆ Friction Loss 1 1.5
Design Max flow
3.34 Line length 54 -
∆ Line loss 54
SUCTION CALCULATION
Orifice 15
Line Size Calculation 30% Control valve 140
Flow
Equipment
Velocity 1.7 2 m/s (a) H E 70 100 kPa
∆ friction loss 1 1.5 kPa/m (b) -
line length 3.4 - m (c) -
∆ line loss 3.4 5.1 kPa (6) dynamic Loss -
/2 Entrance 1.9 2.7 kPa Static Head 279 403 M
40kPa Strainer - - kPa 6.5 -
(1) Sub-total 5.3 7.8 kPa
Equipment Press
Max 85 85 kPa
Static Head 1.5 1.5 m Contingency 200 200 kPa
19.6 19.6 kPa (7) Subtotal none None kPa
Equipment
pressure 100 100 kPa (7) + (6) Discharge Pressure 285 285 kPa
(2) Subtotal 119.6 119.6 kPa -3 Suction Pressure 564 685 kPa
(2) - (1)
(3)Suction
pressure 114.3 111.8 kPa (8) Diff Pressure 114.3 111.8 kPa
(4)VAP
pressure 0.1 0.1 kPa (8)/ 450 576 kPa
(3) - (4) (5) NPSH 114.2 111.7 kPa Control valve 34 44 M
(5)/ 8.7 8.6 M
valve
(6) % dynamic Loss 50%
9.3.6 Pump Selection
Flow rate = volumetric flow rate
Fig (9.1): Layout Plan Showing Selected Control Systems (CSC)
10.0 Economic Analysis
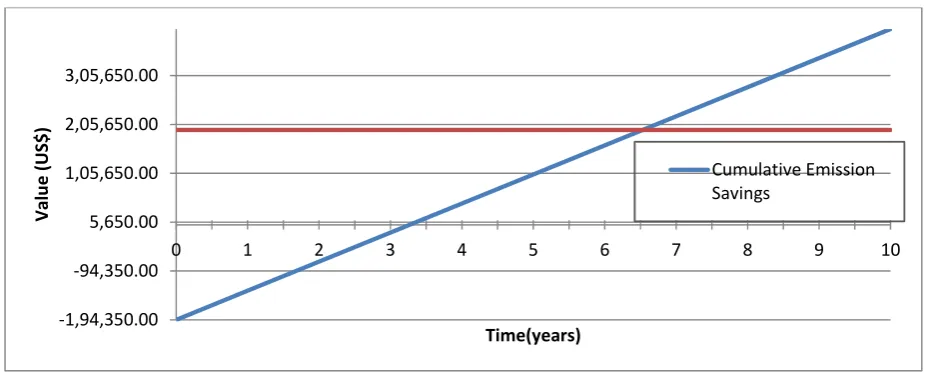
A measure of project worth that is used in this paper is the payback period. It is the period in years it takes an investment project to recover its capital costs. For an 8 hour working day for 1920 hours a year, the two 72-ton throughput processing plants for Midlands losses approximately 496.1 tons per year of ore each due to dust emissions. The cost treating occupational health related diseases is quite high. By implementing this project Midlands will, therefore enjoy lots of potential cumulative savings on medication and associated penalties which come along with unsafe working conditions as well as operating costs. Fig 10.1 shows these cumulative savings over a period of ten years and the payback period of the project is indicated the graph.
Ore emission saving is $59 533.06 per year for both plants against an initial capital outlay of $194 350.00. The cost of unprocessed chrome ore used to calculate this saving is $60 per ton. The cost of water used for the Atomised Water Systems (AWS) for both plants is estimated at $ 1 883.35 for the entire year. This figure is arrived at using
the water consumption rate of 769 ⁄ and Municipal water charges comprising of a fixed $80 a month and a
variable charge of $1.20 per for industrial uses. The maintenance labour and spares costs, and any other minor costs which may arise have been assumed negligible in the calculation of the payback period since no new employees are going to be hired from outside and the pump station comes along with its own spares.
KEY
Stockpiles Tubing and headers Nozzles
Water Tank Pump Station Grizzly Feeder Conveyor Belts Direction of ore Screens Surge Bin Transfer Enclosure Secondary Jaw Crusher Tertiary Gyratory Crusher
Fig 10.1 Ten Year Cumulative Savings
11.0 Conclusion
The paper has exposed the high dust emissions at a mineral processing plant and also has gone through cleaner production opportunities that can be captilised and also designed a possible option for minimising dust emissions.
References
[1] Volkwein JC (1979). Dust control in bagging operations. In: Industrial Hygiene for Mining and Tunneling – Proceedings of a Topical Symposium. Cincinnati, OH: American Conference of Governmental Industrial Hygienists.
[2] NSSA, (2009).Guidelines for Occupational Exposure Limits (OELs) and Chemical Substances in Zimbabwe
[3] National Pollutant Inventory (NPI), (1999). Emission Estimation Techniques for Mining and Processing of Non Metallic Minerals [4] Adkins, J. H., Krois P., Hinton M., (1983). Baseline Training Materials for Ass. Compliance and Ace. Red. in the Metal and Nonmetal
Mining Industries.
[5] Goldberg L. J., Marti A. D. (1996). Dust control at conveyor transfer points: containment, suppression, and collection. Bulk Solids handling
l 6(3): 367-372.
[6] Mukherjee S. K., Singh M. M. (1984). New techniques for spraying dust. Coal Age : 54-56.
[7] Seibel RJ (1976). Dust control at transfer point using foam and wateer sprays. Pittsburgh, PA: U. S. Department for interior, Bureau of mines, TPR 97. NTIS No. PB86-1781 59/AS.
[8] Environmental Management Agency (EMA), (2007). Annual Report
[9] Cheng L, Zukovich P. P. (1983). Respirable dust adhering to run-of-face bituminous coals. Pittsburgh, PA: U.S. Department of the interior, Bureau of Mines, R1 7765. NTIS NO. PB 221-883
[10] MRDE (1981). Methods of reducing dust formation and improving dust suppression on long wall faces: final report on ESSC research project 7256-12/003/08. Mining Research and Development Establishment (U. K.).
[11] Tien J.C., Kim J. (1997).Respirable dust Control using Surfactants. Appl Occ Env Hyg l 2 (12): 957-963. [12] Allen, R.W. (1976). Effect of Particle Wettability on Droplet Target Efficiencies in Wet Scrubbers.
[13] Anderson, D.M. (1964) "Dust Control Design by the Air Induction Technique," Int. Medicine and Surgery, pp.68-72.
[14] Armbruster, L., H. Breuer, D. Mark, and J.H. Vincent. (1981) "The Definition and Measurement of Inhalable Dust," International Symposium on Aerosols in the toning and Industrial Work Environment, .
[15] Ford, V.H. (2009) "Bottom Belt Sprays as a Method of Dust Control on Conveyors," Mining Technology, pp. 387-391. [16] USEPA AP-42, 1995, Annual Report
[17] Kissell, F. L. (2003), Handbook for dust control in mining Information circular 9465.
‐1,94,350.00
‐94,350.00 5,650.00 1,05,650.00 2,05,650.00 3,05,650.00
0 1 2 3 4 5 6 7 8 9 10
Val
u
e
(US
$
)
Time(years)