R E S E A R C H
Open Access
Validation of the Italian version of the
abbreviated expanded prostate Cancer
index composite (EPIC-26) in men with
prostate Cancer
Chiara Marzorati
1,2*, Dario Monzani
1, Ketti Mazzocco
1,2, Marianna Masiero
2,3, Francesca Pavan
4,
Massimo Monturano
4and Gabriella Pravettoni
1,2Abstract
Background:This study aims to validate and evaluate the psychometric properties and reliability of the Italian version of the Expanded Prostate Cancer Index Composite–Short Form (EPIC-26), a measure of quality of life (QoL) for prostate cancer patients.
Methods:Two hundred and eighty-four prostate cancer patients completed the Italian version of the EPIC-26 questionnaire at 45 days (T1) and 3 months (T2) after robot-assisted radical prostatectomy (RARP). Psychometric properties were evaluated using structural equation modeling: the goodness of fit of the correlated five-factor model (CFFM) for the EPIC-26 was assessed using the confirmatory factor analysis (CFA), while longitudinal invariance was conducted to assess the ability of the EPIC-26 to measure QoL construct over time. Test-retest reliability was assessed as well by considering intraclass correlations.
Results:At T1, the CFFM model displayed a good fit to data. Similarly, the model showed an adequate fit also at T2. Results of the reliability analysis attested the acceptable internal consistency and test-retest reliability of each dimension: all Cronbach’s alphas could be classified as acceptable (i.e., above .65) except for low Cronbach’s alpha for hormonal dysfunction at T1 (i.e., .638) and urinary irritation at both waves. (i.e., respectively .585 and .518). Finally, psychometric properties were invariant over time and each of the five dimensions of QoL displayed from moderate (all ICCs above .500) to good test-retest reliability (i.e. ICC for urinary incontinence = .764).
Conclusions:Results of the CFA and the measurement invariance analysis demonstrated the validity of the Italian version of the EPIC-26 to assess QoL in prostate cancer patients. Its reliability and good psychometric qualities are well-supported, thus providing a valid tool to assess health-related quality of life and its change over time in prostate cancer patients.
Keywords:Prostate cancer, Epic-26, Quality of life, Validation, Decision-making
© The Author(s). 2019Open AccessThis article is distributed under the terms of the Creative Commons Attribution 4.0 International License (http://creativecommons.org/licenses/by/4.0/), which permits unrestricted use, distribution, and reproduction in any medium, provided you give appropriate credit to the original author(s) and the source, provide a link to the Creative Commons license, and indicate if changes were made. The Creative Commons Public Domain Dedication waiver (http://creativecommons.org/publicdomain/zero/1.0/) applies to the data made available in this article, unless otherwise stated.
* Correspondence:[email protected]
1
Department of Oncology and Hemato-Oncology, University of Milan, Milan, Italy
2Applied Research Division for Cognitive and Psychological Science,
European Institute of Oncology IRCCS, Milan, Italy
Background
Prostate cancer is one of the most common cancers in men with almost 70% of the cases occurring in the developed countries, where advances in screening and treatments have led to an increase in early tumor detec-tion and a prolonged patient lifespan [1, 2]. Despite these advances, prostate cancer patients report a worsen-ing of their quality of life (QoL) [3–5]. Indeed, radiother-apy and invasive surgery can cause urinary incontinence, sexual problems and bowel dysfunction, and they are often related to distress, anxiety or fatigue [6–9]. In this vein, patient-reported outcomes (PROs) play an import-ant role in the process of care of prostate cancer patients who have to deal with both functional and psychological problems [5, 7, 8]. A recent systematic review showed that, among the great availability of prostate-cancer spe-cific questionnaires measuring PROs, the Expanded Prostate Cancer Index Composite (EPIC) is the most suitable cancer-specific survey in urology departments to measure patient’s physical and psychological well-being [10]. Through the “Evaluating Measures of Patient-Re-ported Outcomes” (EMPRO) tool, the EPIC obtained, along with the University of California Los Angeles-Prostate Cancer Index (UCLA-PCI), the highest score in terms of concepts and population intended to assess, and very high scores in validity, interpretability, and re-sponsiveness. Moreover, EPIC was also recommended because it is the only questionnaire investigating hormo-nal and irritative/incontinence urinary dysfunction domains. The original version of EPIC is composed of 50 items and is developed by Wei and colleagues [11]. Considering the difficulty of administering the question-naire during clinical practice, a short-version was intro-duced composed of 26 items. The new version, named EPIC-26, is the most used brief self-report scale and it has already been validated in Norway, USA, China and Germany [12–15].
Its administration allows physical and psychological information to be collected on specific dimensions, as urinary incontinence, urinary irritation, bowel, sexual and hormonal dysfunction, scored from 0 (worst) to 4 or 5 (best). All domains of EPIC-26 are highly correlated with all domains of the longer version EPIC-50 (r≥0.96) [12–15].
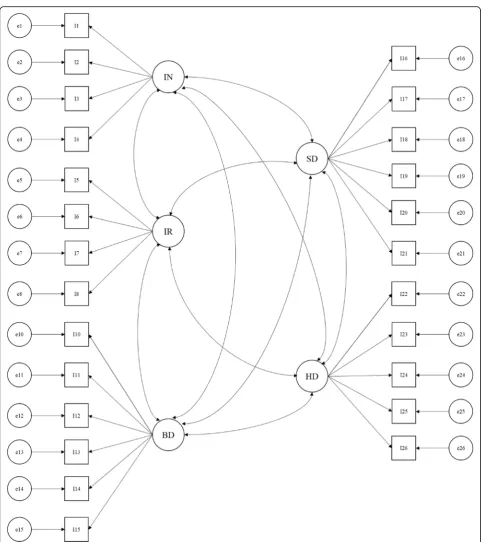
The proposed factor structure for the EPIC-26 is a correlated five-factor model (CFFM) [15, 16]. As shown in Fig. 1, urinary incontinence and urinary irritation are both measured by four items; bowel and sexual dysfunc-tions are both measured by six items, while five items measure hormonal dysfunction. A single item (i.e., item 9) measuring overall urinary symptomatology is a stand-alone item and is not included in any of the domains be-cause it overlaps on both urinary incontinence and urin-ary irritation.
High internal consistency and testretest reliability -Cronbach’s alpha ≥0.70 and r≥0.69 respectively - have been reported in all the domains [15–17]. These psycho-metric properties, along with being less time-consuming and easier to use than the full version, encouraged the use of the EPIC-26 in clinical and research setting over time.
Considering the pivotal role of the EPIC-26 to assess QoL in prostate cancer patients [10], the main aim of this study was to develop an Italian version of this self-report measure and to evaluate its psychometric proper-ties in term of dimensionality, longitudinal invariance, and reliability in term of both internal consistency and test-retest reliability.
Methods
Participants and procedure
An Italian sample of 284 patients with localized prostate cancer who had undergone RARP were recruited at the European Institute of Oncology in Milan between July 2015 and July 2016. Patients were included in the study if they: 1) were diagnosed with localized prostate cancer, 2) were native Italian speakers, 3) referred to the Value Based Project and 4) had neither neurological nor psychopathological problems. They completed the ques-tionnaire 45 days (T1) and 6 months (T2) after RARP surgery. Informed consent was provided and signed by each participant. The participation in the study was vol-untary and at each moment, patients could withdraw their consent. The study was developed in accordance with the principles stated in the Declaration of Helsinki (59th WMA General Assembly, Seoul, 2008) and was approved by the Ethical Committee of the European Institute of Oncology.
Language equivalence
Transcultural adaptation of the EPIC-26 survey in Italian was done using forward and backward translation by two experts [18]. One English native speaker translated the original English EPIC-26 version into Italian. Then, two expert psychologists assessed the consistency of the translation and approved the first version of the Italian EPIC-26. This version was pretested in a cognitive debriefing study with ten prostate cancer patients in order to assess its readability, understand ability, and comprehensibility. The cognitive debriefing was con-ducted by a psychologist. The time taken by each patient to complete the EPIC-26 was recorded. Patients then completed a cognitive debriefing task in which they asked about the clarity of the instructions and items, and the level of ease of response to each item.
0.07) on a five-point Likert scale (from 1 = not at all to 5 = completely). Only two patients asked for further in-formation about the “13.b” item (“breast tenderness/en-largement”): they did not understand the meaning of the question and asked for more information. They did not
Statistical analysis
The psychometric properties were assessed using struc-tural equation modelling in a sample of patients who had undergone Robot-Assisted Radical Prostatectomy (RARP). Specifically, we aimed at assessing the goodness of fit of the CFFM for the EPIC-26 using confirmatory factor analysis (CFA) and testing reliability. Then, longi-tudinal invariance was assessed to evaluate the ability of the EPIC-26 to reliably and validly measure its relevant constructs over time. Longitudinal invariance is a neces-sary requisite to assess stability and change of constructs over time since without invariance it is not possible to distinguish between true changes in outcomes over time and differences in the psychometric properties of the instrument.CFA with robust maximum likelihood (MLR) [19] was performed with Mplus 8.2 to evaluate the CFFM of the EPIC-26 separately at T1 and T2. Overall goodness-of-fit of the proposed models was evaluated assessing multiple indices of fit: the chi square test (Χ2), the root mean square error of approximation (RMSEA), the comparative fit index (CFI), the Tucker-Lewis index (TLI), and the standardized root mean square residual (SRMR). The model fit was firstly evaluated using theΧ2 statistic. However, because of its sensitivity to the sample size, other indices were also used [20]. Specifically, values above .90 for the CFI and TLI, a RMSEA below .06, and a SRMR below .08 indicate a good fitting model. The assessment of longitudinal invariance is a sequential process with seven specific steps. As reported in Table1, configural, metric, scalar, and residual variances invari-ances were sequentially performed and followed by invariance of the latent factor variances, covariances, and means. The main assumption of configural invariance is that the same factor structure will hold in the two waves. Metric and scalar invariance respectively assume that factor loadings and item intercepts are equivalent across
time. The assumption of residual invariance is that the residual variances of items are equivalent across time. Equality of residual variances implies equal reliability over time. Finally, the invariance of factor variances, co-variances, and means assume respectively that latent fac-tor variances, invariances, and means are equal across the two waves. The difference in CFI (i.e., ΔCFI) be-tween a model and the subsequent level of invariance was considered to evaluate whether the hypothesis of in-variance should be retained. Measurement inin-variance is indicated by a ΔCFI less than or equal to −.010 [21]. When invariance was not found, we tested partial invari-ance by checking modification index (MI). At each step, we identified all the non-invariant parameters by review-ing MI and then freely estimated these parameters across time. Analyses were performed using the full-in-formation maximum likelihood estimator, which allows for inclusion of cases with partially missing data.
Internal consistency was assessed by computing respectively Cronbach’s alpha of each dimension in the two waves. Test-retest reliability was computed by con-sidering intraclass correlations (ICCs). Specifically, ICCs (and their 95% confidence interval) were used to exam-ine correlations between repeated measurements of each QoL dimensions obtained from the same patient at dif-ferent times (i.e., T1 and T2). We used ICC Model 3 (i.e., two-way mixed effects, absolute agreement, single measure/rater) to quantify test-retest reliability [22, 23]. ICC values below 0.50 were considered to indicate poor reliability, from 0.50 to 0.75 moderate, from 0.75 to 0.90 good, and above 0.90 excellent reliability [24].
Results
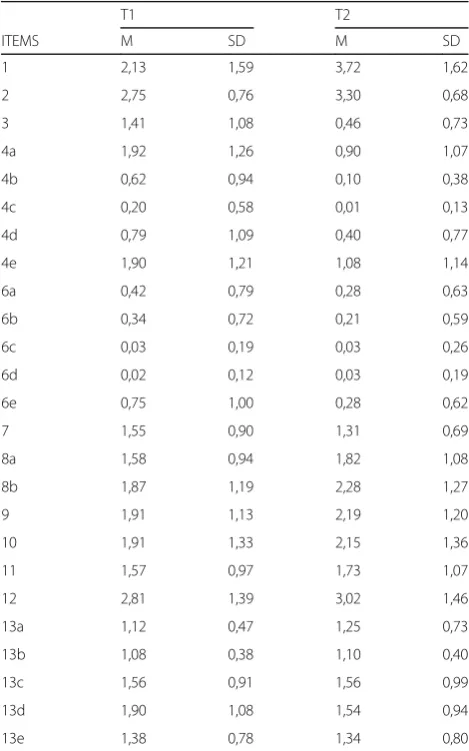
As shown in Table 2, participants had a median age of 63.4 ± 7.12 and a BMI of 26.6 ± 3.54. Two hundred and thirty-three men underwent radical prostatectomy with nerve-sparing (NS) surgical procedure (N= 159 with bi-lateral NS; N= 75 with unilateral NS), while the other 17.6% (50/284) of the sample undergone surgery without NS. The distribution of item responses was reported in Table3.
At T1, the CFFM model displayed a good fit to data [SB Χ2 (265) = 553.092, p= .000; RMSEA = .055; CFI = .921; TLI = .911; SRMR = .067]. Similarly, the model showed an adequate fit also at T2 [SB Χ2 (265) = 605.020, p = .000; RMSEA = .060; CFI = .907; TLI = .894; SRMR = .061]. Specifically, all standardized factor load-ings except the ones for items 13 and 23 are significant at T1. At T2, all standardized factor loadings are signifi-cant except the ones for items 7, 12, and 13.
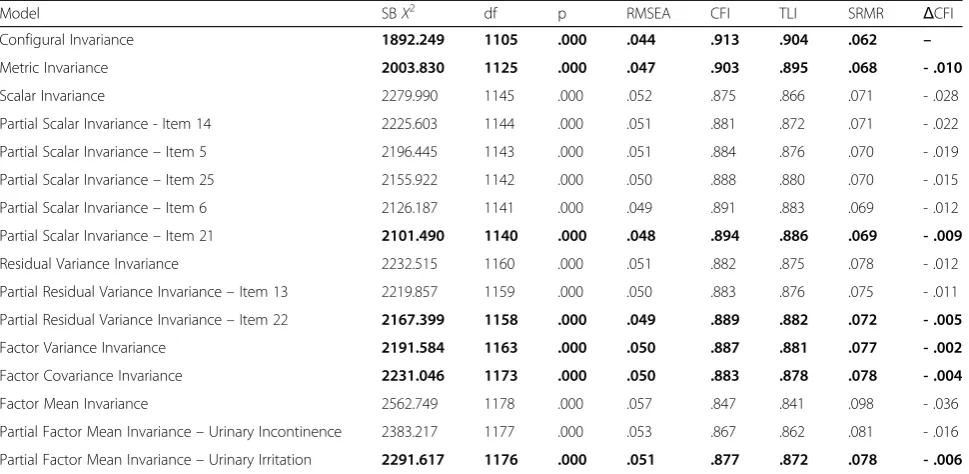
Table4 summarizes the sequential process of assessing measurement invariance by reporting fit indices of each model and theΔCFI between them. In the first step, con-figural invariance was assessed. Specifically, fit indices
Table 1The sequential process to assess longitudinal invariance
Model Title Description
A Configural
model
The factor structure is the same across waves
B Metric model A + all factor loadings are constrained to be equivalent across waves
C Scalar model B + all item intercepts are constrained to be equivalent across waves
D Residual
variances model
C + all residual variances of items are constrained to be equivalent across waves
E Factor variances
model
D + all latent factor variances are constrained to be equivalent across waves
F Factor
covariances model
E + all covariances among latent factors are constrained to be equivalent across waves
G Factor means
model
attested that the CFFM had a good fit in both waves hold in the two waves [SB Χ2 (1105) = 1892.249, p= .000; RMSEA = .044; CFI = .913; TLI = .904; SRMR = .062]. Equivalence of the factor loading across waves was then examined in the metric invariance model. This model did not fit significantly worse than the configural model (ΔCFI =−.010) thus indicating that each item was related to the latent factor equivalently across waves. The scalar invariance model fitted significantly worse than the metric invariance one (ΔCFI =−.028). Subsequently, the MIs sug-gested that the intercept of items 14, 5, 25, 6 and 21 were
the main sources of significant misfit and should be freely estimated across waves. After doing this, the partial scalar invariance model did not fit significantly worse than the metric invariance one (ΔCFI =−.009) and thus denoting that T1 and T2 had the same expected response for each item except for items 14, 5, 25, 6, and 21 at the same abso-lute level of the traits being measured. The residual vari-ances invariance model fitted significantly worse than the partial scalar one (ΔCFI =−.012). The MIs suggested that the residual variances of items 13 and 22 should be freely estimated across the two waves. After doing so, the partial residual variances invariance model did not significantly fit worse than the previous invariance model (ΔCFI = −.005) and thus denoting that the amount of item variance not accounted by the latent factor was the same across the two waves except for items 13 and 22. After reaching par-tial measurement invariance, structural invariance was assessed by evaluating factor variances, factor covariances, and factor means invariance. The factor variance model did not fit significantly worse than the partial residual vari-ances invariance model (ΔCFI =−.002) thus indicating equivalent variances or namely equal amounts of individ-ual differences in QoL across the two waves. Results dem-onstrated the equivalence of relationships among the five latent factors across waves as indicated by a no significant decrease of model fit between the factor covariances in-variance model and the previous model (ΔCFI =−.004). Finally, the factor means invariance model fitted signifi-cantly worse than the factor covariances model (ΔCFI = −.036). The MIs suggested that the means of the latent factors of urinary incontinence and urinary irritation should be freely estimated across the two waves. After doing so, the partial factor means invariance model did not significantly fit worse than the previous invariance model (ΔCFI =−.006) and thus denoting that only these two factors means were significantly different and decreas-ing over time.
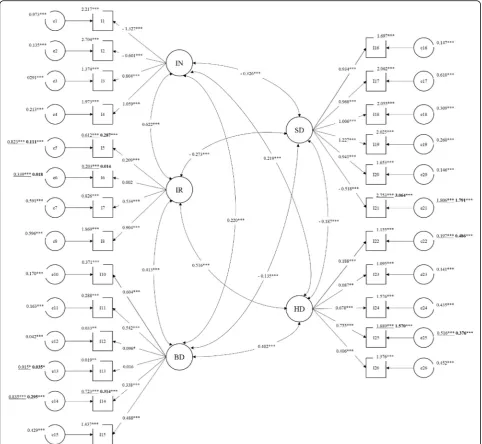
This final model showed an adequate fit to data [SB
Χ2
(1176) = 2291.617, p= .000; RMSEA = .051; CFI = .877; TLI = .872; SRMR = .078]. Standardized parameters of this model are reported in Fig.2. All the standardized factor loadings are significant and above .30 in absolute value with the exception of items 5, 6, 12, 13, 22, and 23. Intercepts of items 5, 6, 14, and 25 decreased across waves while the intercept of item 21 increase from T1 to T2. Regarding residual variances, all non-equivalent items showed decrease of residual variance except for items 13 and 22 that showed an increase of residual vari-ance over time. All the factor varivari-ances and covarivari-ances are equivalent across time attesting the structural stabil-ity of the EPIC-26 questionnaire. Factor correlation ranged between .187 and .622 in absolute value with the highest link between urinary incontinence and urinary irritation. Finally, three factor means (i.e., bowel, sexual,
Table 2Sample characteristics
Age 63.4 ± 7.12
BMI 26.6 ± 3.54
Type of surgery
Bilateral NS 159
Unilateral NS 75
Without NS 50
Table 3The distribution of item responses
T1 T2
ITEMS M SD M SD
1 2,13 1,59 3,72 1,62
2 2,75 0,76 3,30 0,68
3 1,41 1,08 0,46 0,73
4a 1,92 1,26 0,90 1,07
4b 0,62 0,94 0,10 0,38
4c 0,20 0,58 0,01 0,13
4d 0,79 1,09 0,40 0,77
4e 1,90 1,21 1,08 1,14
6a 0,42 0,79 0,28 0,63
6b 0,34 0,72 0,21 0,59
6c 0,03 0,19 0,03 0,26
6d 0,02 0,12 0,03 0,19
6e 0,75 1,00 0,28 0,62
7 1,55 0,90 1,31 0,69
8a 1,58 0,94 1,82 1,08
8b 1,87 1,19 2,28 1,27
9 1,91 1,13 2,19 1,20
10 1,91 1,33 2,15 1,36
11 1,57 0,97 1,73 1,07
12 2,81 1,39 3,02 1,46
13a 1,12 0,47 1,25 0,73
13b 1,08 0,38 1,10 0,40
13c 1,56 0,91 1,56 0,99
13d 1,90 1,08 1,54 0,94
and hormonal dysfunctions) showed to be equivalent across waves; on the contrary, urinary incontinence and urinary irritation decrease from the first to the second wave.
Results of the reliability analysis attested the good in-ternal consistency and test-retest reliability of each di-mension (Table 5). Specifically, all Cronbach’s alphas could be classified as minimally acceptable (i.e., above .65) [25] except for low Cronbach’s alpha for hormonal dysfunction at T1 and urinary irritation at both waves. Urinary incontinence and sexual dysfunction display op-timal reliability with values of Cronbach’s alpha above .80 in both waves. Finally, ICCs attested the good test-retest reliability of each dimension. Specifically, ICC for urinary incontinence could be classified as good, whereas the ICCs for the remaining dimensions could be considered as moderate.
Discussion
This study represents the first attempt to assess the validity of the Italian version of the EPIC-26. The factor structure, longitudinal invariance and reliability of the Italian version of the EPIC-26 were investigated in a sample of Italian prostate cancer patients who had undergone RARP. Results of the CFA demonstrated that the proposed CFFM provided a good fit to data at both waves in these patients. These results support the useful-ness and validity of computing separate scores for each of the five domains of urinary incontinence, urinary irri-tation, bowel dysfunction, sexual dysfunction, and
hormonal dysfunction. The results of the reliability ana-lyses attest the acceptable internal consistency and test-retest reliability of most of the EPIC-26 domains. The urinary irritation subscale is the only dimension showing a poor internal consistency with values of Cronbach’s alpha below the minimally acceptable cut-off at both waves. This result is consistent with previous empirical evidence regarding the weak reliability of this subscale in the Chinese version of the EPIC-26 [14]. Following sug-gestions by Lam and colleagues [14], the low reliability of this subscale may be determined by the high propor-tion of patients reporting no problem on the first two items (pain on urination and bleeding with urination) of this domain and a higher proportion of patients report-ing moderate problems or incomplete emptyreport-ing and need to urinate frequently during the day. Another pos-sible explanation of this low reliability is the limited number of items in this domain compared with other domains (urinary incontinence, sexual, bowel, and hor-monal dysfunction). Notably, the first two items measur-ing urinary irritation, alongside with item 2 (urinary control), item 13 (bloody stools), item 22 (hot flashes), and item 23 (breast tenderness) display a low factor loading below .30. Thus, all these items could be consid-ered weak indicators of their respective dimensions. Fur-ther research is needed to identify more reliable indicators of urinary irritation in patients with prostate cancer by developing new ad-hoc items. Regarding test-retest reliability, all dimensions displayed at least moder-ate reliability.
Table 4Results of the sequential process of assessing measurement invariance of the EPIC-26
Model SBΧ2 df p RMSEA CFI TLI SRMR ΔCFI
Configural Invariance 1892.249 1105 .000 .044 .913 .904 .062 –
Metric Invariance 2003.830 1125 .000 .047 .903 .895 .068 - .010
Scalar Invariance 2279.990 1145 .000 .052 .875 .866 .071 - .028
Partial Scalar Invariance - Item 14 2225.603 1144 .000 .051 .881 .872 .071 - .022
Partial Scalar Invariance–Item 5 2196.445 1143 .000 .051 .884 .876 .070 - .019
Partial Scalar Invariance–Item 25 2155.922 1142 .000 .050 .888 .880 .070 - .015
Partial Scalar Invariance–Item 6 2126.187 1141 .000 .049 .891 .883 .069 - .012
Partial Scalar Invariance–Item 21 2101.490 1140 .000 .048 .894 .886 .069 - .009
Residual Variance Invariance 2232.515 1160 .000 .051 .882 .875 .078 - .012
Partial Residual Variance Invariance–Item 13 2219.857 1159 .000 .050 .883 .876 .075 - .011
Partial Residual Variance Invariance–Item 22 2167.399 1158 .000 .049 .889 .882 .072 - .005
Factor Variance Invariance 2191.584 1163 .000 .050 .887 .881 .077 - .002
Factor Covariance Invariance 2231.046 1173 .000 .050 .883 .878 .078 - .004
Factor Mean Invariance 2562.749 1178 .000 .057 .847 .841 .098 - .036
Partial Factor Mean Invariance–Urinary Incontinence 2383.217 1177 .000 .053 .867 .862 .081 - .016
Partial Factor Mean Invariance–Urinary Irritation 2291.617 1176 .000 .051 .877 .872 .078 - .006
The best fitting model for each of the seven steps of measurement invariance assessment is indicated in bold
Fig. 2Standardized parameters of the final CFFM. Note: IN = Urinary incontinence; IR = Urinary irritation; BD = Bowel dysfunction; SD = Sexual dysfunction; HD = Hormonal dysfunction
Table 5Cronbach’s alphas and ICC assessing internal consistency and test-retest reliability of the EPIC-26
Dimension T1 Cronbach’alpha T2 Cronbach’alpha ICC correlation (95% CI)
Urinary incontinence .886 .862 .764 (.717–.804)
Urinary irritation .585 .518 .600 (.529–.662)
Bowel dysfunction .699 .736 .536 (.458–.606)
Sexual dysfunction .860 .902 .552 (−.088–830)
Testing longitudinal measurement invariance is a pre-requisite for understanding whether changes in patients’ urinary incontinence, urinary irritation, bowel dysfunc-tion, sexual symptomatology, and hormonal dysfunction over time reflect true changes in quality of life or rather changes in the psychometric properties or structure of the EPIC-26 over time. This study also demonstrated the good longitudinal invariance of the EPIC-26. This self-report measure was administered to the same sam-ple of patients with prostate cancer who had undergone RARP in order to assess all the sequential steps of meas-urement invariance over time. Results demonstrated a full weak invariance of the EPIC-26 across time. Specif-ically, its entire factor loading is invariant over time and, thus, indicating that all of them are related to their re-spective domains equivalently across waves. We also demonstrated a partial strong invariance and a partial strict invariance of the EPIC-26 over time attesting re-spectively that the majority of the expected responses are equivalent over time and that the amount of item variance not accounted by the latent factor was the same across the two waves. The non-invariant thresholds of items 5, 6, 14, 21, and 25 suggested that patients evalu-ate these specific symptoms differently over time. Specif-ically, responses to these items revealed that patients who had undergone RARP reported a significant de-crease over time of pain or burning on urination, bleed-ing on urination, bloody stools, and lack of energy. Conversely, they showed a significant increase of amount of problem related to their sexual function or the lack of sexual function.
Finally, after the partial strict invariance, results also attested the structural invariance of the EPIC-26 across the two waves. We found equivalence of factor variances and covariances over time suggesting respectively that the same amounts of individual differences in patients’ quality of life were found between T1 and T2 and that a strong structural stability exists among the five EPIC-26 domains over time. Moreover, the five EPIC-26 domains showed from moderate to strong stability across time. Finally, the results of the factor mean invariance demon-strated that the levels of bowel, sexual, and hormonal dysfunctions tend to be equal over time. On the other hand, self-reported levels of urinary incontinence and ir-ritation significantly decreased from 45 days to 6 months after the RARP.
The large number of studies using this instrument (the 50- and 26-item versions) [10] and the high number of language translations [12–15, 26–31] make an Italian validation necessary. The Italian validation of the Ex-panded Prostate Cancer Index Composite–Short Form confirms its validity and reliability in measuring Quality of Life in prostate cancer patients over time. Beyond its reliability, the Short Form is easier than the longer
version of the questionnaire, reducing administration burden with only 10 min for the compilation [10].
Limitations
One of the main limitations of this study is the lack of other self-report measures of quality of life or patients’ well-being, which could be useful to better assess con-vergent and/or dicon-vergent validity of the EPIC-26. How-ever, we did not include any other measures to minimize burden on such patients.
Moreover, the EPIC-26 was administered to patients who had undergone RARP only; the lack of other treat-ment types may affect the internal consistency. More precisely, our results may show poor internal consistency in the urinary irritation subscale because patients who had undergone RARP did not suffer from this side effect.
Conclusion
To sum up, the current study attests the validity and reliability of the CFFM of the Italian version of the EPIC-26 in patients with prostate cancer undergone RARP. Thus, we suggest using five distinct domain scores of urinary incontinence, urinary irritation, bowel dysfunction, sexual symptomatology, and hormonal dys-function on both clinical and research practice. The EPIC-26 is demonstrated to be a valid and reliable self-report measure of health-related quality of life for patients with prostate cancer.
Abbreviations
CFA:Confirmatory factor analysis; CFFM: Correlated five-factor model; CFI: Comparative fit index; EPIC-26: Expanded Prostate Cancer Index Composite–Short Form; MLR: Robust maximum likelihood; PROs: Patient-reported outcomes; QoL: Quality of Life; RARP: Robot-Assisted Radical Prostatectomy; RMSEA: Root mean square error of approximation; SRMR: Standardized root mean square residual; TLI: Tucker-Lewis index; UCLA-PCI: University of California—Los Angeles Prostate Cancer Index
Acknowledgements Not applicable.
Authors’contributions
The authors’contribution has been as follows: concept and design (KM, CM, MM, MMo, FP GP); acquisition of data (FP, CM); statistical analysis and interpretation of data (CM, DM); manuscript writing (CM, DM); drafting revision of the manuscript for important intellectual content (CM, DM, MM, KM, MMo GP); supervision (GP). All authors read and approved the final manuscript.
Funding
Non-financial support was given for this study.
Availability of data and materials
The data that support the findings of this study are available from the European Institute of Oncology, but restrictions apply to the availability of these data, which were used under license for the current study, and so are not publicly available.
Ethics approval and consent to participate
Consent for publication
No data of an individual patients included in this study are contained in this manuscript, hence, no consent for publication was needed.
Competing interests
The authors declare that they have no competing interests.
Author details
1Department of Oncology and Hemato-Oncology, University of Milan, Milan,
Italy.2Applied Research Division for Cognitive and Psychological Science, European Institute of Oncology IRCCS, Milan, Italy.3Department of
Biomedical and Clinical Sciences, University of Milan, Milan, Italy.4Patient Safety & Risk Management Service, European Institute of Oncology IRCCS, Milan, Italy.
Received: 3 December 2018 Accepted: 16 August 2019
References
1. GLOBOCAN. Estimated Cancer Incidence, Mortality and Prevalence Worldwide in 2012. Section of Cancer Surveillance. 2012. Accessed on 20 Nov 2018.
2. Miller KD, Siegel RL, Lin CC, Mariotto AB, Kramer JL, Rowland JH, et al. Cancer treatment and survivorship statistics, 2016. CA Cancer J Clin [Internet. 2016;66(4):271–89.
3. Zelefsky MJ, Poon BY, Eastham J, Vickers A, Pei X, Scardino PT. Longitudinal assessment of quality of life after surgery, conformal brachytherapy, and intensity-modulated radiation therapy for prostate cancer. Radiother Oncol. 2016;118(1):85–91.
4. Donovan JL, Hamdy FC, Lane JA, Mason M, Metcalfe C, Walsh E, et al. Patient-reported outcomes after monitoring, surgery, or radiotherapy for prostate Cancer. N Engl J Med. 2016;375(15):1425–37.
5. Renzi C, Fioretti C, Oliveri S, Mazzocco K, Zerini D, Alessandro O, et al. A qualitative investigation on patient empowerment in prostate Cancer. Front Psychol. 2017;8:1215.
6. Hsiao C-P, Loescher LJ, Moore IMK. Symptoms and symptom distress in localized prostate cancer. Cancer Nurs. 2007;30(6):E19–32.
7. De Sousa A, Sonavane S, Mehta J. Psychological aspects of prostate cancer: a clinical review. Prostate Cancer Prostatic Dis. 2012;15(2):120–7. 8. Chen RC, Basak R, Meyer A-M, Kuo T-M, Carpenter WR, Agans RP, et al.
Association between choice of radical prostatectomy, external beam radiotherapy, brachytherapy, or active surveillance and patient-reported quality of life among men with localized prostate Cancer. JAMA. 2017; 317(11):1141.
9. Marzorati C, Monzani D, Mazzocco K, Pavan F, Cozzi G, De Cobelli O, et al. Predicting trajectories of recovery in prostate cancer patients undergone robot-assisted radical prostatectomy (RARP). PLoS One. 2019;14:e0214682. 10. Schmidt S, Garin O, Pardo Y, Valderas JM, Alonso J, Rebollo P, et al.
Assessing quality of life in patients with prostate cancer: a systematic and standardized comparison of available instruments. Qual Life Res. 2014;23(8): 2169–81.
11. Wei JT, Dunn RL, Litwin MS, Sandler HM, Sanda MG. Development and validation of the expanded prostate cancer index composite (EPIC) for comprehensive assessment of health-related quality of life in men with prostate cancer. Urology. 2000;56(6):899–905.
12. Fosså SD, Storås AH, Steinsvik EA, Myklebust TA, Eri LM, Loge JH, et al. Psychometric testing of the Norwegian version of the expanded prostate Cancer index composite 26-item version (EPIC-26). Scand J Urol. 2016;50(4):280–5.
13. Beyer B, Huland H, Feick G, Graefen M. Expanded prostate cancer index composite (EPIC-26). Urologe. 2015;54(11):1591–5.
14. Lam WWT, Tse MA, Ng CNL, Chung EKM, Fielding R. Psychometric assessment of the Chinese version of the abbreviated expanded prostate Cancer index composite (EPIC-26) and the clinical practice version (EPIC-CP) in Chinese men with prostate Cancer. J Pain Symptom Manag. 2017;53(6): 1085–90.
15. Szymanski KM, Wei JT, Dunn RL, Sanda MG. Development and validation of an abbreviated version of the expanded prostate cancer index composite instrument for measuring health-related quality of life among prostate cancer survivors. Urology. 2010;76(5):1245–50.
16. Miller DC, Sanda MG, Dunn RL, Montie JE, Pimentel H, Sandler HM, et al. Long-term outcomes among localized prostate cancer survivors: health-related quality-of-life changes after radical prostatectomy, external radiation, and brachytherapy. J Clin Oncol. 2005;25(12):2772-80.
17. Axcrona K, Nilsson R, Brennhovd B, Sørebø Ø, Fosså SD, Dahl AA. Psychometric properties of the expanded prostate cancer index composite - 26 instrument in a cohort of radical prostatectomy patients: theoretical and practical examinations. BMC Urol. 2017;17(1):111.
18. Beaton DE, Bombardier C, Guillemin F, Ferraz MB. Guidelines for the process of cross-cultural adaptation of self-report measures. Spine (Phila Pa 1976). 2000;25(24):3186–91.
19. Satorra A, Bentler P. Scaling corrections for statistics in covariance structure Analysis 1988;
20. Hu L, Bentler PM. Cutoff criteria for fit indexes in covariance structure analysis: conventional criteria versus new alternatives. Struct Equ Model A Multidiscip J. 1999;6(1):1–55.
21. Cheung GW, Rensvold RB. Evaluating goodness-of-fit indexes for testing measurement invariance. Struct Equ Model A Multidiscip J. 2002;9(2):233–55. 22. Koo TK, Li MY. A guideline of selecting and reporting Intraclass correlation
coefficients for reliability research. J Chiropr Med. 2016.
23. Shrout PE, Fleiss JL. Intraclass correlations: uses in assessing rater reliability. Psychol Bull. 1979;86(2):420-8.
24. Bland JM, Altman DG. Statistical methods for assessing agreement between two methods of clinical measurement. Lancet. 1986;327(8476):307–10. 25. Nunnally JC, Bernstein IH. The assessment of reliability. In: Psychometric
theory. 3rd editio. New York, NY: McGraw-Hill, Inc.; 1994. p. 248–292. 26. Chung KJ, Kim JJ, Lim SH, Kim TH, Han DH, Lee SW. Development and
validation of the Korean version of expanded prostate Cancer index composite: questionnaire assessing health-related quality of life after prostate Cancer treatment. Korean J Urol. 2010;51(9):601.
27. Takegami M, Suzukamo Y, Sanda MG, Kamoto T, Namiki S, Arai Y, et al. The Japanese translation and cultural adaptation of expanded prostate Cancer index composite (EPIC). Nihon Hinyokika Gakkai Zasshi. 2005;96(7):657–69. 28. Anota A, Mariet A-S, Maingon P, Joly F, Bosset J-F, Guizard A-V, et al.
Cross-cultural adaptation and validation of the French version of the expanded prostate cancer index composite questionnaire for health-related quality of life in prostate cancer patients. Health Qual Life Outcomes. 2016;14(1):168. 29. Vigneault É, Savard J, Savard M-H, Ivers H, Després P, Foster W, et al.
Validation of the French-Canadian version of the expanded prostate Cancer index composite (EPIC) in a French-Canadian population. Can Urol Assoc J. 2017;11(12):404–10.
30. Umbehr MH, Bachmann LM, Poyet C, Hammerer P, Steurer J, Puhan MA, et al. The German version of the expanded prostate Cancer index composite (EPIC): translation, validation and minimal important difference estimation. Health Qual Life Outcomes. 2018;16(1):36.
31. Alves E, Medina R, Andreoni C. Validation of the Brazilian version of the expanded prostate Cancer index composite (EPIC) for patients submitted to radical prostatectomy. Int Braz J Urol. 2013;39(3):344–52.
Publisher’s Note