ISSN 2307-4523 (Print & Online)
© Global Society of Scientific Research and Researchers
http://ijcjournal.org/
Comparative Study of Machine Learning Algorithms to
Measure the Students’ Performance
Ganesan Kavitha
*Computer Science & Engineering Department, Jubail University College
Jubail Industrial City, Eastern Province, 31961, Saudi Arabia
Email: [email protected]
Abstract
Students’ performance in the continuous assessments needs to be monitored to identify the students who may
not perform well in the final examination. The aim of the research is to predict the students at risk those who
will not complete the course. In order to predict the students at risk, Machine Learning algorithms can be
applied to the students’ data at hand to construct a model from the training data set. With the prediction model,
testing data can be applied to identify the students at risk. In this paper, two Machine Learning Algorithms
namely C4.5, and Naïve Bayes Algorithm are used to analyze the training data set to build the prediction models
and tested on the testing data set. The accuracy level of the two algorithms were also computed and compared to
identify the algorithm which yields results at higher accuracy.
Keywords: Machine Learning Algorithms; C4.5; Naïve Bayes Algorithm; Prediction Model.
1. Introduction
“Machine Learning explores the study and construction of algorithms that can learn from and make predictions
on data. Such algorithms operate by building a model from example inputs in order to make data driven
prediction” as quoted by Manohar Swamynathan in his book [2].Machine Learning algorithms are divided into
three types namely Supervised Learning, Unsupervised Learning and Reinforcement Learning. Supervised
Learning is learning a classifier from labeled training data [4]. In this paper, two Supervised Learning
Algorithms namely Decision Tree (Tree Model) and Naïve Bayes (Probabilistic Model) Algorithms are used to
build the prediction models using the training data set to predict the students who may fail the course.
The relative accuracy of the two models were computed and compared to identify the algorithm which yields
accurate results. The main reason to identify the students are risk is that some courses are pre-requisite of other
courses and delaying to clear a course may delay the graduation time of the students.
2. Background and Literature Review
This study is the continuation of author’s previous research [1] where the students’ performance was analyzed
using C4.5 classification algorithm. The attributes chosen were Quiz 1, Quiz 2, MidTerm, Assignment 1 and
Assignment 2 and the possible values of the attributes were Pass or Fail.
The category Pass can refer either the good performance or an average performance of the student. In this study,
the same set of attributes were chosen and the possible values of each of the attributes are considered as Good,
Average and Poor so as to differentiate the performance of the learners. In a survey paper by Xindong and his
colleagues the authors identified top 10 algorithms in data mining which includes C4.5 and beyond, K-Means
Algorithm, Support Vector Machines, Apriori Algorithm, EM Algorithm, PageRank, AdaBoost, kNN:k-nearest
neighbor classification, Naïve Bayes and CART [5].
In this research paper, two among the above ten algorithms were selected. Prediction models were created with
the help of the training data set and tested with the help of the testing data. Qasem, Emad & Mustafa [6]
conducted a research to study the main attributes that may affect the student performance in courses.
The classification algorithms were used for mining the student related academic data. They also built a system
which allows students to predict the final grade of a course under study.
Reference [7] conducted a research to evaluate the students’ performance using decision tree classification
model. The classifier helps in identifying the dropouts and students who need special attention. Badr and his
colleagues [8] compared the two classification algorithms such as ID3, C4.5, C5.0 and CART and concluded
that C4.5 is the most powerful and preferred method in machine learning. The limitation of ID3 algorithm was
discussed which is the ID3’s sensitivity to features/attributes with large values like Social Security Number
which always give low entropy value. C4.5 allows to measure gain ratio which is more reliable to identify the
attribute for splitting.
3. Training Dataset Description
3.1 Data Collection
The data used to train the algorithms were collected from Jubail University College, Kingdom of Saudi Arabia.
A collection 20 students’ assessments results were used in this research.
3.2 Data Preparation
performance of the student in the coursework and final examination. The achievement level of a course varies
from institution to institution. In Jubail University College, the student has to score the minimum marks in the
total of coursework and final examination which is 60 over 100 marks.
Failing to score will result in repeating the course in the upcoming semester. The selected students’ attributes for
this research is given in Table 1. These attributes are very similar to the attributes used in the previous research
by the author and Dr. Lawrance [1]. But, the difference is in the values of the attributes. In the previous
research, the values of each attributes were chosen as “Pass” or “Fail”. The “Pass” category may refer an
exceptional performance or an average performance. So, in this research the author wants to differentiate the
performance of the student in each assessment like “Good”, “Average” and “Poor”, where “Poor” refers the
“Fail” category.
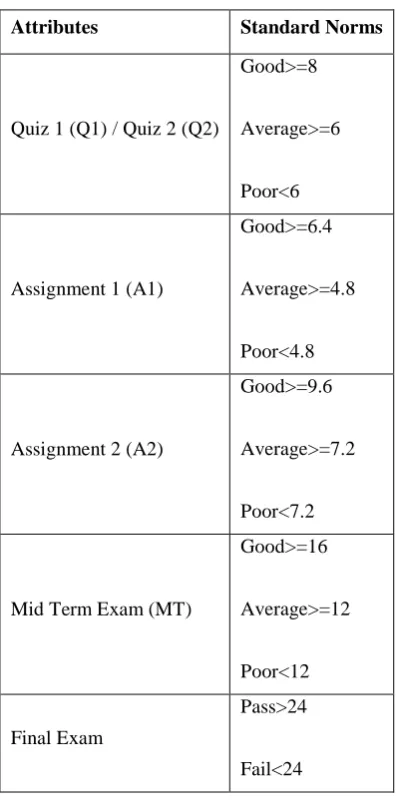
Table 1: Students’ Attributes
Attributes Standard Norms
Quiz 1 (Q1) / Quiz 2 (Q2)
Good>=8
Average>=6
Poor<6
Assignment 1 (A1)
Good>=6.4
Average>=4.8
Poor<4.8
Assignment 2 (A2)
Good>=9.6
Average>=7.2
Poor<7.2
Mid Term Exam (MT)
Good>=16
Average>=12
Poor<12
Final Exam
Pass>24
Fail<24
‘G’ refers “Good”, ‘A’ refers “Average”, and ‘P’ refers “Poor”.
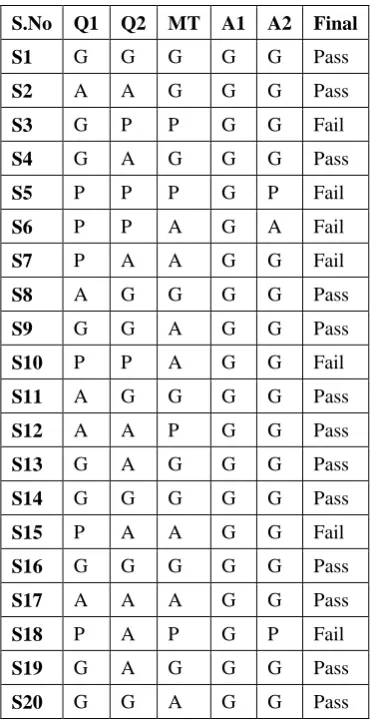
Table 2: Training Test Data
S.No Q1 Q2 MT A1 A2 Final
S1 G G G G G Pass
S2 A A G G G Pass
S3 G P P G G Fail
S4 G A G G G Pass
S5 P P P G P Fail
S6 P P A G A Fail
S7 P A A G G Fail
S8 A G G G G Pass
S9 G G A G G Pass
S10 P P A G G Fail
S11 A G G G G Pass
S12 A A P G G Pass
S13 G A G G G Pass
S14 G G G G G Pass
S15 P A A G G Fail
S16 G G G G G Pass
S17 A A A G G Pass
S18 P A P G P Fail
S19 G A G G G Pass
S20 G G A G G Pass
4. Machine Learning Algorithms
Machine learning is a branch of artificial intelligence which concerns on the construction of systems that can
learn from dataset.
4.1 Classification - C4.5
Decision trees are simple and more powerful form of multi-variable analysis. Decision tree is a hierarchical tree
where each branch node represents a choice between a number of alternatives. The bottom level nodes are called
leaves which represents a decision [9]. There are many algorithms to generate decision tree and the one very
commonly and widely used algorithm is C4.5 which was developed by Ross Quinlan.C4.5 algorithm uses the
𝐸𝐸𝐸𝐸𝐸𝐸𝐸𝐸𝐸𝐸𝐸𝐸𝐸𝐸(𝑆𝑆) = − � 𝐸𝐸𝑖𝑖 𝑛𝑛
𝑖𝑖=1
𝑙𝑙𝐸𝐸𝑙𝑙2 𝐸𝐸𝑖𝑖
𝐺𝐺𝐺𝐺𝐺𝐺𝐸𝐸(𝑠𝑠,𝐴𝐴) =𝐸𝐸𝐸𝐸𝐸𝐸𝐸𝐸𝐸𝐸𝐸𝐸𝐸𝐸(𝑠𝑠)− �(𝐸𝐸𝑖𝑖∗ 𝐸𝐸𝐸𝐸𝐸𝐸𝐸𝐸𝐸𝐸𝐸𝐸𝐸𝐸(𝐸𝐸𝑖𝑖 𝑛𝑛
𝑖𝑖=1
))
𝐺𝐺𝐺𝐺𝐺𝐺𝐸𝐸𝐺𝐺𝐺𝐺𝐸𝐸𝐺𝐺𝐸𝐸(𝑠𝑠,𝐴𝐴) = 𝐸𝐸𝑛𝑛𝐸𝐸𝐸𝐸𝐸𝐸𝐸𝐸𝐸𝐸𝐺𝐺𝐺𝐺𝑖𝑖𝑛𝑛(𝑠𝑠(,𝐴𝐴𝑠𝑠),𝐴𝐴)
The Entropy, Gain and Gain Ratio of the attributes Quiz 1, Quiz 2, MidTerm, Assignment 1 and Assignment 2
are given in Tables 3, 4 and 5 respectively.
Table 3: Entropy of Quiz 1, Quiz 2, MidTerm, Assignment 1 and Assignment 2
Entropy Value
E(T, Quiz 1) 0.22647
E(T, Quiz 2) 0.4132331
E(T, MidTerm) 0.50709
E(T, Assignment 1) 0.90407 E(T, Assignment 2) 0.66906
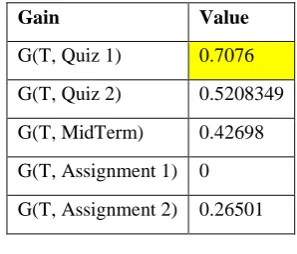
Table 4: Gain of Quiz 1, Quiz 2, MidTerm, Assignment 1 and Assignment 2
Gain Value
G(T, Quiz 1) 0.7076
G(T, Quiz 2) 0.5208349
G(T, MidTerm) 0.42698
G(T, Assignment 1) 0
G(T, Assignment 2) 0.26501
Table 5: Gain Ratio of Quiz 1, Quiz 2, MidTerm, Assignment 1 and Assignment 2
Gain Ratio Value
GR(T, Quiz1) 3.124475648
GR(T, Quiz2) 1.26039008
GR(T, Assignment 1) 0
GR(T, Assignment 2) 0.396093026
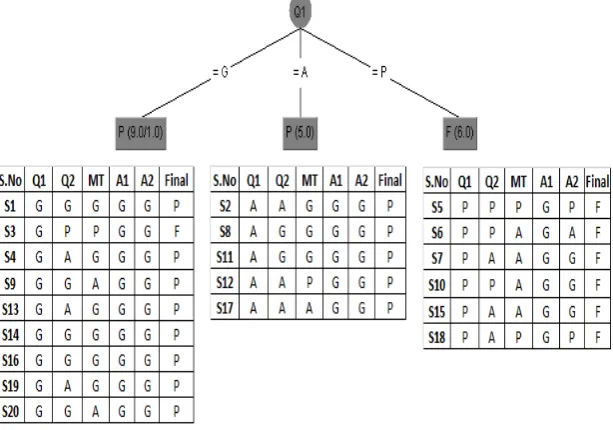
In the above table ‘T’ stands for the Training Table. The maximum gain ratio is 3.12 for Quiz 1 and that is the
root node of the decision tree. Quiz 1 has three values Good, Average and Poor. The Decision Tree is given in
Figure 1. Weka tool is used to construct the decision tree. When the value of Q1 is Average, the student passes
the Final Exam and when the value is Q1 is Poor, the student fails the Final Exam. The gain ratio for the table
Quiz 1 Good does not yield any maximum value. So, the final decision is given in Figure 2.
Figure 1: Initial Decision Tree
The decision rule derived from the above decision tree is given below:
If Quiz 1 = Good or Average, then Final = Pass.
If Quiz 1 = Poor, the Final = Fail.
Quiz 1 is the small test given to the students in the beginning of the semester with minimal coverage of topics
which is the introductory lessons of the course. If the student has a through or moderate knowledge in the
introductory lessons, he/she can perform well in the course and complete the course successfully. Poor
performance of the student in the Quiz 1 depicts that the student does not understand or does not possess enough
knowledge to take the course to complete it successfully.
4.2 Classification - Naïve Bayes
According to Saed Sayad [10], Naïve Bayesian model is easy to build and is widely used. It is the most
sophisticated classification algorithm. Bayes theorem provides a way of calculating the posterior probability.
The posterior probability can be calculated by constructing a frequency table for each attribute against the target.
Then, based on the frequency, the probability for each attribute is calculated. Then, use the Naïve Bayesian
equation to calculate the posterior probability for the new case for prediction.
That means, assume that there is a new case such as a student’s assessments results for Quiz 1, Quiz 2,
MidTerm, Assignment 1 and Assignment 2. Then, the frequencies for each attribute given in the tables 6 to 10
can be used to predict whether the student will pass the final examination or not. The class with the maximum
probability is the outcome of the prediction.
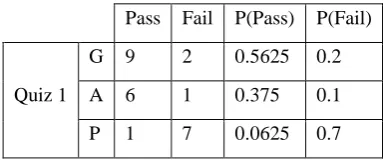
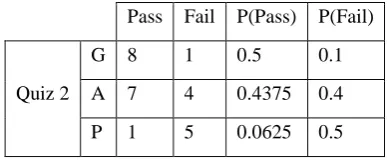
The frequency and likelihood of classes such as Quiz 1, Quiz 2, MidTerm, Assignment 1 and Assignment 2 are
given in the tables 6,7,8,9 and 10 respectively.
P(Pass) = 0.615384615
P(Fail) = 0.384615385
Table 6: Frequency and Probability of Quiz 1
Pass Fail P(Pass) P(Fail)
Quiz 1
G 9 2 0.5625 0.2
A 6 1 0.375 0.1
P 1 7 0.0625 0.7
Pass Fail P(Pass) P(Fail)
Quiz 2
G 8 1 0.5 0.1
A 7 4 0.4375 0.4
P 1 5 0.0625 0.5
Table 8: Frequency and Probability of MidTerm
Pass Fail P(Pass) P(Fail)
MidTerm
G 10 1 0.625 0.1
A 4 5 0.25 0.5
P 2 4 0.125 0.4
Table 9: Frequency and Probability of Assignment 1
Pass Fail P(Pass) P(Fail)
Assignment 1
G 14 8 0.875 0.8
A 1 1 0.0625 0.1
P 1 1 0.0625 0.1
Table 10: Frequency and Probability of Assignment 2
Pass Fail P(Pass) P(Fail)
Assignment 2
G 14 5 0.875 0.5
A 1 2 0.0625 0.2
P 1 3 0.0625 0.3
The Naïve Bayesian equation:
𝑃𝑃(𝐶𝐶|𝑋𝑋) =𝑃𝑃(𝑋𝑋𝑃𝑃|𝐶𝐶().𝑋𝑋𝑃𝑃)(𝐶𝐶)
Here X is the set of attributes which is here Quiz 1, Quiz 2, MidTerm, Assignment 1 and Assignment 2; and C is
the class which is here “Pass” or “Fail” in Final Exam.
multiplying the probabilities of Quiz 1, Quiz 2, MidTerm, Assignment 1 and Assignment 2 with respect to
“Pass” by the Probability of “Pass”.
The probability for the class “Fail” is also calculated as like above. The class with the maximum probability is
the result of the prediction.
5. Experimental Results
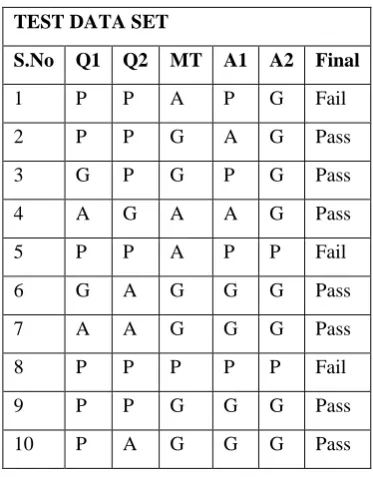
The test data set is collected from Jubail University College which contains 10 students’ assessment results and
is given in Table 11.
The test data set is applied to the two classification models created using C4.5 and Naïve Bayes classification
algorithms.
Table 11: Test Data Set
TEST DATA SET
S.No Q1 Q2 MT A1 A2 Final
1 P P A P G Fail
2 P P G A G Pass
3 G P G P G Pass
4 A G A A G Pass
5 P P A P P Fail
6 G A G G G Pass
7 A A G G G Pass
8 P P P P P Fail
9 P P G G G Pass
10 P A G G G Pass
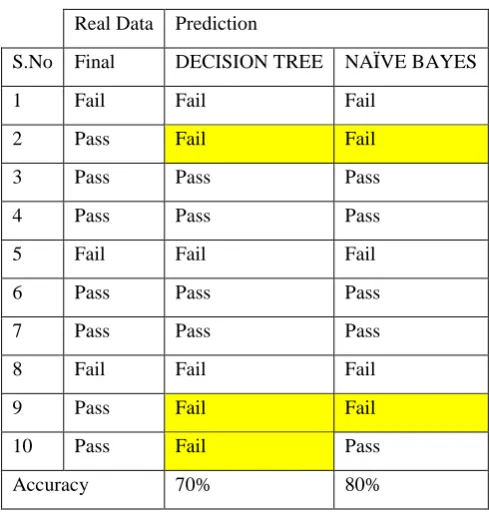
The C4.5 Decision Tree model predicted 7 out of 10 data correctly and Naïve Bayes classifier predicted 8 out of
10 data corrected.
The percentage of accuracy of C4.5 Decision Tree to the above test data set is 70% and for Naïve Bayes
classification model is 80% and are given in Table 12.
Based on the accuracy levels, the Naïve Bayes classifier produces the more accurate results over C4.5 algorithm.
The derived Naïve Bayes classification model can be used to predict the students’ level of performance before
If the result of prediction is “Fail”, then those set of students needs to be grouped as students at risk and more
extra care has to be given to them to perform well in the final examination. Completing a course successfully is
a vital element as some courses are pre-requisite of other courses and delaying a course may delay the
graduation of the student.
Table 12: Results of the Classification Models on Test Data Set
Real Data Prediction
S.No Final DECISION TREE NAÏVE BAYES
1 Fail Fail Fail
2 Pass Fail Fail
3 Pass Pass Pass
4 Pass Pass Pass
5 Fail Fail Fail
6 Pass Pass Pass
7 Pass Pass Pass
8 Fail Fail Fail
9 Pass Fail Fail
10 Pass Fail Pass
Accuracy 70% 80%
6. Conclusion
Naïve Bayes Probabilistic Model is better than Decision Tree Model for predicting the students at risk. Even
though the training and testing data set are limited, the accuracies of results produced by the classifiers are found
at satisfactory level. Educators can apply the Navye Bayes classification model to predict the students at risk
before they attempting for final examination. This will enable to educators to provide enough educational
assistance to the students at risk.
7. Recommendations and Suggestions for Future Research
The main objective of this research is to compare the top three machine learning algorithms to measure the
students’ performance. For further research, few other Machine Learning Algorithms like Support Vector
Machine, K-Means, and Random Forests can be considered for comparative study. As the attributes of the
training data set of this research consists of only the assessment results, other possible attributes like family
derive more assuring results. For further study, the training data set can also be increased to have more accurate
results.
References
[1] Ganesan Kavitha & Dr. Lawrance Raj, Educational Data Mining and Learning Analytics – Educational
Assistance for Teaching and Learning, International Journal of Computer & Organization Trends
(IJCOR), Volume 41 Number 1, 2017.
[2] Manohar Swamynathan, Mastering Machine Learning with Python in Six Steps – A Practical
Implementation Guide to Predictive Dtat Analytics Using Python, India: Apress, 2017.
[3] John Paul Mueller & Luca Massaron, Machine Learning for Dummies, Wiley, 2016.
[4] Shai Shalev, Shwartz & Shai Ben David, Understanding Maching Learning: From Theory to
Algorithms, Cambridge University Press, 2014.
[5] Xindong et al., Top 10 Algorithms in Data Mining, IEEE Conference on Data Mining, 2006.
[6] Qasem Al Radaideh, Emad Al Shawakfa & Mustafa Al Najjar, Mining Student Data Using Decision
Trees, in the Proceedings of International Arab Conference on Information Technology, 2006.
[7] Brijesh Kumar Baradwaj & Saurabh Pal, Mining Educational Data to Analyze Students’ Perofrmance,
International Journal of Advanced Computer Science and Applications, Vol. 2, No. 6, 2011.
[8] Badr Hssina, Abdelkarim Merbouha, Hanane Ezzikouri & Mohammed Erritali, A Comparative Study of
Decision Tree ID3 and C4.5, International Journal of Advanced Computer Science and Applications,
Special Issue on Advances in Vehicular Ad Hoc Networking and Applications, 2014.
[9] Barry de Ville, Decision Trees for Business Intelligence and Data Mining – Using SAS Enterprise
Miner, SAS Press, 2006.