Keywords: Internet of Things (IoT), sensor data, data acquisition, FSDAA, ThingSpeak. Received on 12 April 2018, accepted on 08 October 2018, published on 31 October 2018
Copyright © 2018 Sivadi Balakrishna et al., licensed to EAI. This is an open access article distributed under the terms of the Creative Commons Attribution licence (http://creativecommons.org/licenses/by/3.0/), which permits unlimited use, distribution and reproduction in any medium so long as the original work is properly cited.
doi: 10.4108/eai.21-12-2018.159410
1. Introduction
In recent years, the urban population growth is increasing tremendously. The global urban population is expected to grow 1.86% per year from 2015 to 2020. In between 2020 to 2025 years, this increase will be 1.63% and 2025 to 2030 it goes to 1.44% approximately by the World Health Organization (WHO). In an urban population, there is huge popularity for cars and a minimum of two cars owned by one family. The popularity of private cars getting urban traffic is more. Because of this, traffic is becoming one of the big problems in urban areas all over the world [1]. The heavy traffic in urban cities is leading to congestion, accidents that
*Corresponding author. Email:[email protected]
have affected by the property loss, waste of time, environmental pollution, and sometimes it goes to the next level of man’s death. Therefore, there is a big need for traffic monitoring and reduction system in urban areas to become Smart cities [2]. The best approach to solve this problem using the Internet of Things and it provides a new trend to intelligent traffic management.
To improve the acquisition and data analysis, this paper intends to use the IoT technology, Cloud computing, Raspberry Pi and data acquisition technologies. The actual scenario of this research is as follows: The information generated by IoT devices data collected from the roads through gateways can be presented to all travelers and users. After collecting the real-time sensor data, the system
A Framework for IoT Sensor Data Acquisition and
Analysis
Sivadi Balakrishna
1,*
,
M. Thirumaran
1and Vijender Kumar Solanki
21Department of Computer Science and Engineering, Pondicherry Engineering College, Pondicherry, India 2Department of Computer Science and Engineering, CMR Institute of Technology, Hyderabad, India
Abstract
In the current scenario, around 35 billion Internet of Things (IoT) devices is connected to the internet. By 2025, it is predicted that the number will grow between 80 and 120 billion devices connected to the internet, supporting to generate 180 trillion gigabytes of new sensor data that year. The IoT sensor data is generated from various heterogeneous devices, communication protocols, and data formats that are enormous in nature. This huge amount of sensor data is unable to acquire and analyze manually. This is a significant problem for IoT application developers to make the integration of IoT sensor data automatically. However, the large amount of data has led to the inadequacy of the manual data acquisition and stressed the urgency into the research of IoT based frameworks in automatic. In this paper, we have proposed a framework for IoT sensor data acquisition and analysis (FSDAA). The FSDAA has been implemented on the ThingSpeak IoT Cloud platform for data analysis and visualizations, and compared with the state of the art schemes. Finally, the results show that the proposed FSDAA is efficient in terms of Accuracy, Precision, Recall, and F-measure.
can recognize the current traffic, traffic flow conditions and can predict future traffic in urban areas. After that, sensor data monitoring and sensor data detection have been measure for analyzing and visualize the acquired data. Based on the system-generated data may useful to drivers for choosing optimal routes. Therefore, the system is dynamically administrative, control and monitor on moving cars. If constructions on intelligent traffic system using IoT, then there is a lot of benefits for users such as improving traffic conditions, less traffic jam and high reliability, traffic safety, management costs and independence of weather conditions. Bridges, roads, tunnels, vehicles, traffic signals and drivers these are some of the traffic elements in IoT. All these items will be connected to the web for monitoring and identification through different types of IoT devices like RFID, sensors, actuators, Global Position Systems (GPS) and laser scanners. As of late fame of private engine, vehicles are getting urban activity more swarmed. As a result activity, observing is getting to be noticeably one of the imperative issues in enormous smart city framework everywhere throughout the world. Some of these concerns are movement clog and mischances that normally cause a critical exercise in futility, property harm, and environmental contamination. Any kind of clog on streets, at last, prompts budgetary misfortunes. In this way, there is a pressing need to enhance traffic management. The presence of the Internet of Things (IoT) gives another pattern to canny traffic improvement [3].
This exploration proposes to utilize the IoT, specialist and other advances to enhance activity conditions and mitigate the activity weight. Data created by movement IoT and gathered on all streets can be introduced to explorers and other clients. Through gathered ongoing movement information, the traffic monitoring system can perceive current activity operation, movement stream conditions and can foresee the future movement stream. The framework may issue a few most recent continuous moving data that helps drivers picking ideal paths. Thusly, the framework can absolutely administrate, screen and control on moving vehicles.
Developing a smart framework in view of IoT has a number of advantages such as change of activity conditions, lessening the car influx and administration costs, high unwavering quality, traffic security and freedom of climate conditions. Such undertaking of an IoT must incorporate each component of traffic such as streets, spans, burrows, traffic signs, vehicles, and drivers. Every one of these things will be associated with the web for helpful ID and administration through sensor devices, for example, RFID devices, infrared sensors, worldwide situating frameworks, laser scanners, and so forth. Undertaking the IoT gives motion data accumulation and combination supports preparing an investigation of all classes of motion
data on streets in an expansive territory and naturally. Hence, present-day traffic administration is developing into a wise transport framework in light of IoT [4].
The term ‘traffic’ will play the key role in accessing the logistics and services available on the road, so the developed system will be more reliable and accurate towards traffic management. The IoT sensor data will be produced along with various sensor-based technologies. This movement is observing that applications should ensure to keep any type of security attack visit in urban cities. Therefore, there is such type of model executions can be found in and the Smart Santander EU venture.
The rest of this paper is organized as follows: section 2 shows the related work of this study. The proposed IoT sensor data acquisition and analysis framework have been described in Section 3. Section 4 shows the performance evaluation of proposed work and it includes the experimental results and analysis. Finally, section 5 concludes this paper and future enhancements are directed.
2. Related Work
IoT sensor data acquisition and analysis are one of the biggest problems in this present living world. So many researchers have dealt and put their effort on this problem, as a result, several types of approaches have developed. Bhadra et al [5] have applied agent-based fuzzy logic technology involving multiple approaches and vehicle movements for traffic control situations. Based on a fuzzy neural network, has been proposed a traffic flow prediction mechanism in chaotic traffic flow time series. The authors Anupama Mallik et al. [6] developed various strategies for integrating dynamic data into Intelligent Transport Systems (ITS). P. Pyykonen et al. [7] applied in enterprise services for effective integration of Service Oriented Architecture (SOA) and Internet of Things (IoT). Due to the revolution in IoT, many of the researchers shifted their attention. Zhang et.al, proposed the more needful and convenient environment for sensor data collection and analysis in smart city applications. Ubicomp [9] and FeDNet [10] are different Internet of Things (IoT) systems for communication using message-passing techniques. The authors D. Bandyopadhyay and J. Sen et al. [10] proposed various applications applied in different domains like smart city, smart home, smart metering, smart transport and healthcare.
activity motions in light of information get from streets taken by a camcorder. We isolate activity thickness, which thinks about to total range controlled by vehicles all over the place similar to the total of pixels in a video layout instead of figuring a number of vehicles. We set two parameters for yield, variable activity cycle and weighted time for each road in perspective of activity thickness and control movement lights, successively it is extremely time unpredictable and in addition sweeping.
Therefore, M. Mazhar Rathore et al. [14] the opportunity has already come and gone for limited to manage the road turned parking slot issue. There are diverse systems open for traffic organization, for example, video data examination, infrared sensors, inductive circle acknowledgment, remote sensor framework, and so on. Each one of these procedures is effective procedures for sharp activity organization. However, the issue with these systems is that the foundation time, the cost caused for the foundation and support of the system is high. From now on, another development called Radio Frequency Identification (RFID) is introduced A.P. Plageras et al. [15], which can be joined with the present hailing structure that can go about as a key to splendid traffic organization constantly. Use of this new development will incite diminished traffic monitoring. Bottlenecks recognized early and thus early preventive measures can take in this way saving time and cost of the driver. Q. Liu Qiang Liu a et al. [16] presented display called dynamic movement observing framework. It implies that different influencing factors are ought to check. Sharmad Pasha [17] developed that GPS based vehicle ensuing framework. It gives to diminishing the short separation traveling's and in addition to the same substance is concentrated on different variables are to be thinking about convenient information submitting by utilizing VSNs vector remove directing calculation and gives the high dependable correspondence. It covering the range extreme separation fire gathering information. Akbar Adnan et al. [18] made an RFID based conceptual model on insight into motion control framework. It controlling movement stream, decreasing mischances in rush hour gridlock spots and remote area transmission.
Therefore, after careful observation of all these literature surveys, there is a need for acquisition and analysis of IoT sensor data in an efficient manner.
These are the following contributions made on this proposed approach:
1. To propose a novel framework for IoT sensor data acquisition and analysis by obtaining real-time data.
2. To analyze the gathered sensor data on providing some relevant feature extractions
to show the daily and weekly wise sensor density conditions.
3. To find the accuracy, precision, recall, and f-measure of the proposed framework. 4. To compare the obtained results with
existing the most relevant state of the art schemes in an efficient way.
3. A Framework for IoT Sensor Data
Acquisition and Analysis
In this paper, to develop an Internet of Things (IoT) based smart real-time traffic monitoring system, used a ThingSpeak, Raspberry Pi 3 Model B, and a webcam to analyze traffic on a busy highway. Then connect the Raspberry Pi device to the machine for deploys and configure traffic-monitoring algorithm. ThingSpeak- a cloud aggregator used to store the data, analyze and visualize the data online.
In the Internet of Things (IoT), the analytics are used anywhere:
1. The edge node 2. Offline on the desktop 3. In the cloud
Here we have shown how to monitor the real-time traffic data on the busy highway and how the real-time data collected on the cloud. After storing, the aggregated data on the cloud can perform analytics for the edge device and finally perform analysis on the cloud data. The Fig.1 illustrates a framework of workflow analysis and perform online analysis on the stored cloud data. In this framework, uses ThingSpeak for both storage and analysis.
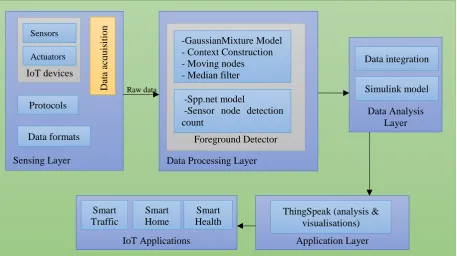
The proposed framework based on Internet of Things may consist of four layers as shown in Fig.1 Those are the Sensing layer, Data processing layer, IoT sensor data analysis layer, and Application layer.
1. Sensing layer: This layer is used to collect the data coming from different IoT devices. This is the lowest layer observed in the proposed framework. It captures the various heterogeneous types of data acquiring from heterogeneous IoT devices like sensors, actuators, protocols, and data formats, etc. The high amount of big data is transferred to the next level layer i.e., Data processing layer for performing the data analysis and processing raw data.
smart traffic data and detect the high traffic congested data on busy roads. The acquired data is sometimes may be simple or sometimes may be complex. Therefore, based on the representation of sensor data, both feature extraction and foreground detector data is transfer to the next layer i.e. IoT sensor data analysis layer for performing meaningful data as well as interpretation by providing Simulink and data integration approaches.
3. Data analysis layer: This is the crucial layer for this proposed framework. The Simulink model has been applied to this layer. It will take the data after pre-processing applied on data pre-processing layer to annotate the IoT sensor data. The
ambiguity of the foreground detector data is minimized by applying the Simulink model. The ThingSpeak based domain knowledge systems have used the context -aware data to predict the real-time traffic data for reducing the traffic jams and unforeseen delay.
4. Application layer: This layer is used to perform analysis and visualization of the acquired IoT sensor data to the users using ThingSpeak cloud platform. This layer is generates traffic alerts, count of vehicles in real-time situations. These analyzed and visualized data is applicable to IoT smart city applications of smart traffic, smart home, smart grid, and smart health etc.
Figure 1. The proposed framework for IoT sensor data analysis
3.1 Hardware Setup
In order to develop a proposed framework, we used Raspberry Pi 3 Model B and a USB webcam. We placed a USB webcam near a window on the second
floor of house building that overlooks national highway road 2, Tirupati, India. To get a clear view of vehicles places the webcam may place both sides of the highway.
3.2 Deploying the Algorithm to the Hardware
In order to develop the traffic monitoring algorithm, we used following a list of parts available in MATLAB 2016a.
1. Simulink
2. Image processing Toolbox 3. Computer Vision System Toolbox 4. Simulink Support Package for
Raspberry Pi 3 Hardware.
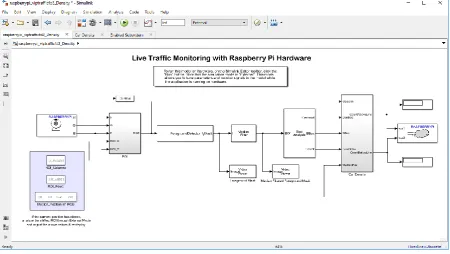
The proposed algorithm is incorporated into a Simulink model and then exports the results for analysis and visualizations. It supports simulation, system-level design, automatic code generation, testing and visualization of IoT data. In this framework, we develop a model using Simulink and generated code that runs on the Raspberry Pi 3 model B. the following Fig. 3 shows the Simulink model for sensor data acquisition.
Raw data
Sensing Layer Data Processing Layer
Data Analysis Layer Simulink model
Application Layer ThingSpeak (analysis &
visualisations) Foreground Detector
-GaussianMixture Model - Context Construction - Moving nodes - Median filter
-Spp.net model
-Sensor node detection count
Data integration IoT devices
Sensors
Actuators
Data
ac
q
u
is
itio
n
Protocols
Data formats
IoT Applications Smart
Traffic
Smart Home
Figure 2. Simulink model for IoT sensor data acquisition
It supports simulation, system-level design, automatic code generation, testing and visualization of IoT data. In this experiment, developed a model using Simulink and that runs on the Raspberry Pi 3 model B. The above Fig. 2 shows the Simulink model for sensor data acquisition. In this Simulink model, an external capability of Simulink is used to develop the algorithm. In external mode, Simulink gathers the real-time sensor streaming data from Raspberry Pi and the users can see the video on desktop/mobile using the SDL video display while the Simulink model is running.
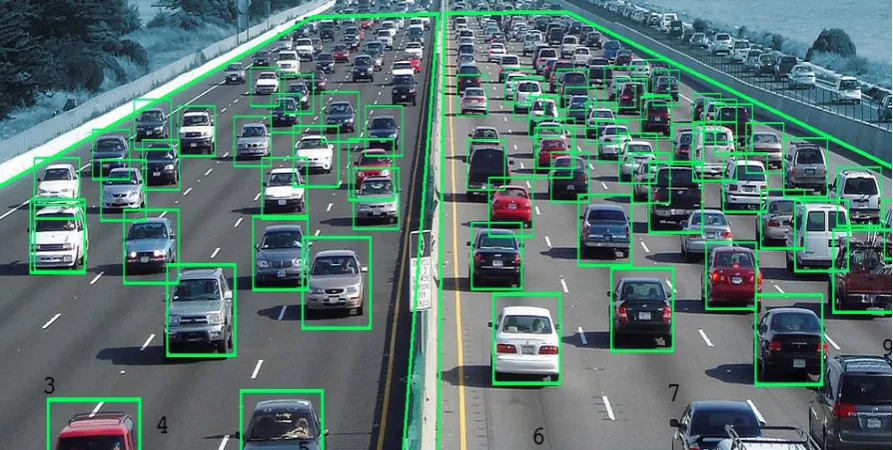
The USB cam placed for a particular region of highway and vehicles is moving from left to right. The USB webcam connected to one USB port of the Raspberry Pi captures video with a selected region. Next, authors are used the ForegroundDetector for estimating low vision and pixels of a video sequence captured by the USB webcam as shown in Fig.3. It estimates mainly using Gaussian mixture models and produces the appropriate results on moving cars. To avoid and remove the unwanted noise in the ForegroundDetector mask post-processed by using
MedianFilter for analyzing the Post-processed data used the Blob Analysis block- that computes centroids of the blob containing the cars. The Car Density block counts the number of vehicles travelling both eastbound traffic and westbound. Traffic direction in that video frame. This Car Density Block divides the video capturing region into two sections along with the highway median. After that, the real-time traffic streaming data sent to ThingSpeak-the data aggregator for analyzing & visualizations. Here individually we sent vehicle count value to each eastbound and westbound region. We send both eastbound traffic and westbound traffic values to ThingSpeak (Channel Id) and store the westbound value in field1 and store the eastbound value in field2.
Figure 3. Estimating total vehicles count for sensor data analysis (eastbound and westbound traffic) Algorithm 1 depicts the usage of this Simulink model based on sensor data acquisition and analysis algorithm as shown below.
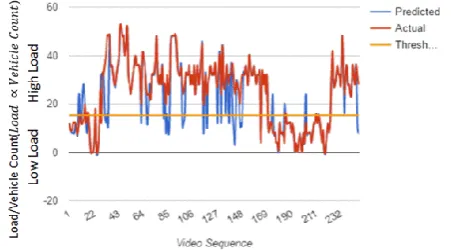
Algorithm 1: IoT Sensor Data Analysis
Input: A group of S snapshots along with input videos IV (Input Video).
Output: Generating high traffic load or low traffic load.
1. for S snapshots in IV do
2. Calculate the moving vehicles Ct
mv and correspondingly total vehicles Cttv in a taken frame 3. Find out the stopped vehicles Ct
sv = Cttv - Ctmv 4. Count the threshold value , if Ct
sv > threshold value
5. then
6. High traffic load
7. else
8. Low traffic load
9. end if
10. end for
11. repeat
3.4 Analyzing Data on ThingSpeak
The traffic-monitoring model done by using Simulink deployed into Raspberry Pi hardware device. Then we can start analysis on real-time disseminate data stored in the ThingSpeak cloud aggregator sent by the Raspberry Pi 3 Model B fetching from ThingSpeak.
3.4.1 Reading one week of data into MATLAB
Already we discussed that ThingSpeak allows receiving data from Raspberry Pi once every 15 seconds. In addition, it retrieves approximately 40,000 data points only. In a single read operation, ThingSpeak allows only 8000 points. Therefore, we need to create for loop to gather the real-time sensor data in batches. Here each iteration divides into two vectors namely all traffic data and timestamp and
then append the traffic and time.
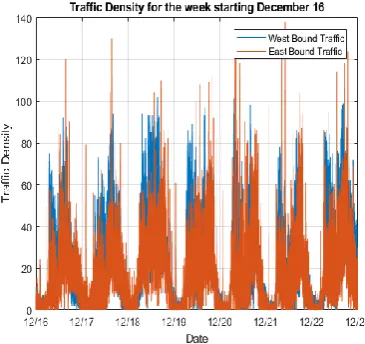
Plotting traffic data and next, we need to plot the graph as well as label the graph. From the raw data, the daily fluctuations in traffic are clearly visible. Daily fluctuations are hardly changing from weekdays to normal days. We can observe a different pattern on the weekdays (18/12-22/12) compared to weekend days (16/12 and 17/12). Due to communication traffic, the weekdays show stronger in morning and peaks in the afternoon.
3.5 Viewing at Day-to-day Mean Bulk for
Eastbound and Westbound Traffic and Plotting
eastbound traffic and westbound traffic that follows the weekend.
For visualize a one-week density data using both eastbound and westbound traffic information use GMM model. If you observe the Fig.4, the total number of moving vehicles is to be counted on both westbound and eastbound traffic density information on the starting date as 16th December to ending date as 23rd December. The corresponding traffic counting using eastbound and westbound traffic density shown in Fig.5 (a) and (b) respectively.
Figure 4. Traffic Density for one week
(a)
(b)
Figure 5. Traffic Density (a) Westbound (b) East Bound
3.5.1 Taking a closer look at individual days during the week and on the weekend
Look at traffic on the individual days, to gain more insight into our traffic data. For that, we can take each day, specify a start time, and stop time as parameters.
3.5.2 Fetch each individual day in a loop
We retrieve all the 7 days data from ThingSpeak and down sample the real-time traffic data to remove short-term fluctuations. To find times and plot where the traffic density is the highest use the findpeaks function and observe for each day. We look at the eastbound traffic data for simplicity.
3.5.3 Estimating Traffic density
The estimation of traffic density is based on DBN (Dynamic Bayesian Networks) for finding situation tracking in real-time. Algorithm 1 shows the total steps for measuring traffic.
1. Detecting moving and non-moving vehicles: for finding the total count of vehicles in an appropriate video, have to use the GMM and SPP-net models. 2. Calculate the stopped vehicles and
moving vehicles from total count of vehicles: In order to calculate both stopped vehicles and moving vehicles, first, find out the velocity of the vehicles. If the velocity is zero in position, then the status of that vehicle is stopped vehicles Ct
sv, otherwise it is counted as moving vehicle Ct
mv. SPP-net model is used for finding the count of moving a vehicle is:
Ct
(a)
(b)
(c)
(e)
(f)
(g)
(d)
3.6 Downsample into 48 silos of
approximately 30-minute masses of data
and find heights
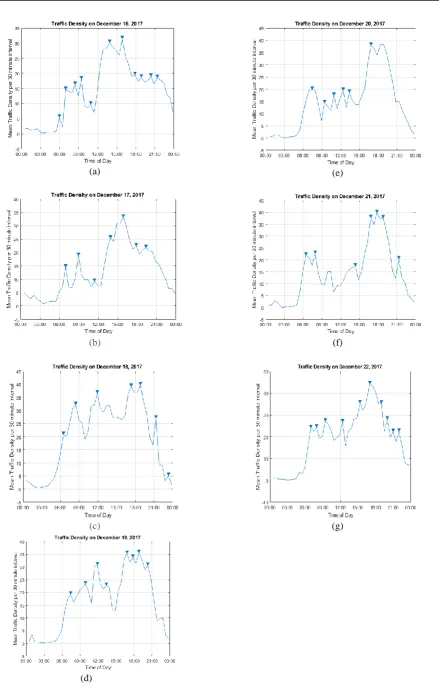
The generated real-time raw traffic data is hard to visualize and very spiky also. Therefore, do you want to see the highest volume in a particular time in a day then we need to look at the data on a time scale greater than 15 seconds do. For calculation of this divide, the 24-hour day into 30 minutes segments. Here each segment begins near the top of the hour and means while end time at 30 minutes later. Fig. 6 shows the individual date traffic information.
3.6.1 Weekend observations for Saturday, December 16
This is first-weekend day observation of traffic pattern and many peaks are scattered throughout the day but the maximum peak times occur at 1:52 and 3:51 time. This is not surprising as the highway connects many big industries and data centers that frequented during weekend days only.
3.6.2 Weekend observations for Sunday, December 17
On Sunday, the traffic patterns are similar to Saturday. This day also having so many large peak times occurred, but maximum peak times occurred afternoon again at 1:52 and 3:51 pm.
3.6.3 Weekend observations for Monday, December 18
On Monday, we have been seeing a working day for all employees and for normal people communicates to their destination places to and from work. We observed the morning rush from 7:55 to 8:25 am and scattered as large peaks. Again evening also the employees are reaching their destination, so evening rush at 5:19 pm and 6:48 pm. We even see a strong peak time fluctuations at 12 noon as people go out for lunch or perhaps.
3.6.4 Weekend observations for Tuesday, December 19
On Tuesday, the observed pattern is similar to Monday. In this whole day, so many peak times occurred out of those two peaks in the morning and three peaks in the evening figured out.
3.6.5 Weekend observations for Wednesday, December 20
On Wednesday, morning from 6:57 am to 7:27 am, the traffic density is heavy. In the evening, we see two strong peak times out of many peak times at Cloud evening.
3.6.6 Weekend observations for Thursday, December 21
On Thursday, the peak timings are- two in the morning and three at evening occurred, and the heavy rush is same as like on Wednesday.
3.6.7 Weekend observations for Friday, December 22
On Friday, we observed that continuously the traffic is going like anything and we observed maximum peak times thought a day.
3.7 Online Analysis and Visualization:
Creating Visualizations inside ThingSpeak
As of now, we had developed traffic monitoring algorithm using Simulink model and that has deployed onto the Raspberry Pi 3 Model B. Then we programmed for traffic monitoring algorithm and send the results to the ThingSpeak IoT Cloud platform for online analysis and visualizations. After that, we took one-week traffic patterns and performed some analysis on that and get results like when is the maximum peak times occurs and when is the low peak time occurs at daily wise. We used eastbound traffic and westbound traffic for measuring a number of vehicles are moving on both ends. It is easy to calculate the mean value for daily and weekly traffic data observations. To do this we set a threshold value for finding moderate or heavy traffic patterns based on our deep observations. This code will automatically update whenever the ThingSpeak IoT Cloud platform has viewed. So now, we can easily find the heavy traffic timings on this highway road as shown in Fig.7.
Figure 7. Online Analysis and Visualizations on ThingSpeak
3.8 Create a dynamic visualization of
traffic density: Viewing the data online
4. Performance Evaluation
The proposed framework has been implemented on ThingSpeak IoT cloud platform. This was programmed using MATLAB code with DELL laptop of I3 Intel Pentium Processor, 4 GB RAM, and 1 TB HDD in Windows 10 platform.
4.1 Performance Metrics
To evaluate the performance of the proposed framework, the following metrics are considered for measuring the framework. These metrics are generated from the confusion matrix as shown in Fig 8.
Predicted as “YES”
Predicted as “NO”
Actually as “YES”
True Positive
[𝑉𝑥 → 𝑉𝑥]
False Negative
[𝑉𝑥 → 𝑁𝑉𝑥]
Actually as “NO”
False Positive
[𝑁𝑉𝑥 → 𝑉𝑥]
True Negative
[𝑁𝑉𝑥→ 𝑁𝑉𝑥]
Figure 8. Confusion Matrix
4.1.1. True positive
𝑉𝑥→𝑉𝑥: This is an estimation of detected vehicles considered correctly as detected vehicles.
4.1.2. True negative
𝑁𝑉𝑥→𝑁𝑉𝑥: This is an estimation of non-detected vehicles considered correctly as non-detected vehicles.
4.1.3. False positive
𝑁𝑉𝑥→𝑉𝑥: This is an estimation of non-detected vehicles considered incorrectly as detected vehicles.
4.1.4. False negative
𝑉𝑥→𝑁𝑉𝑥: This is an estimation of detected vehicles considered incorrectly as non-detected vehicles.
4.1.5. True Positive Rate (TPR)
TPR expresses the sensitivity and scales the
proportion of correctly classified detected vehicles
from the video as shown Eq.1
𝑇𝑃𝑅 = 𝑉𝑥→ 𝑉𝑥 (1)
[𝑉𝑥→𝑉𝑥+𝑉𝑥→𝑁𝑉𝑥]
4.1.6. True Negative Rate (TNR)
TNR expresses the specificity scales the proportion of correctly classified non-detected vehicles from the video as shown Eq.2.
𝑇𝑁𝑅 = 𝑁𝑉𝑥 → 𝑁𝑉𝑥
[𝑁𝑉𝑥 → 𝑁𝑉𝑥+ 𝑁𝑉𝑥→ 𝑉𝑥]
(2)
4.1.7. False Positive Rate (FPR)
FPR measures the significance level, which scales the proportion of non-detected vehicles that are interpreted as detected vehicles in the data acquisition process in an input video sequence as shown Eq.3
𝐹𝑃𝑅 = 𝑁𝑉𝑥→ 𝑉𝑥 (3)
[𝑁𝑉𝑥→𝑉𝑥+𝑁𝑉𝑥→𝑁𝑉𝑥]
4.1.8. False Negative Rate (FNR)
FNR scales the proportion of detected vehicles that are interpreted as non- detected vehicles in the data acquisition process as shown Eq.4
𝐹𝑁𝑅 = 𝑉𝑥 → 𝑁𝑉𝑥 (4)
[𝑉𝑥→𝑁𝑉𝑥+𝑉𝑥→𝑉𝑥]
4.1.9. Accuracy
Accuracy is the first step towards performance measure where it defines the ratio between the total count of correct detected vehicles made to a total count of detected vehicles made as shown Eq.5.
𝐴𝑐𝑐𝑢𝑟𝑎𝑐𝑦 = (𝑉𝑥→𝑉𝑥+ 𝑁𝑉𝑥→𝑁𝑉𝑥)
[𝑉𝑥→𝑉𝑥+𝑁𝑉𝑥→𝑁𝑉𝑥+𝑁𝑉𝑥→𝑉𝑥+𝑉𝑥→𝑁𝑉𝑥] (5)
4.1.10. Precision, Recall & F-measure
Precision discourses about the exactness of the data, and the Recall voices about completeness. Both precision and recall conclude over the accuracy of the system whereas the accuracy does not explain much about the false results. F-measure studies precision and recall to decide upon the score. Its harmonic mean over precision and recall as shown Eq.6-8
𝑃𝑟𝑒𝑐𝑖𝑠𝑖𝑜𝑛 = 𝑉𝑥→ 𝑉𝑥
[𝑉𝑥→ 𝑉𝑥+ 𝑁𝑉𝑥→ 𝑉𝑥]
(6)
𝑅𝑒𝑐𝑎𝑙𝑙 = 𝑉𝑥 → 𝑁𝑉𝑥
[𝑉𝑥→ 𝑉𝑥+ 𝑉𝑥→ 𝑁𝑉𝑥]
(7)
) (8) 𝑃𝑟𝑒𝑐𝑖𝑠𝑖𝑜𝑛∗𝑅𝑒𝑐𝑎𝑙𝑙
𝐹−𝑚𝑒𝑎𝑠𝑢𝑟𝑒=2∗(
𝑃𝑟𝑒𝑐𝑖𝑠𝑖𝑜𝑛+𝑅𝑒𝑐𝑎𝑙𝑙
4.2 Result Discussions
The proposed framework has been compared with existing leading approaches- Zhang et.al, 2013 [8], M. Mazhar Rathore et.al, 2016 [14], A.P. Plageras et.al, 2017 [15], Sharmad Pasha, 2016 [17], A.R. Al-Ali, et. al, 2017 [18], and László Lengyel et.al, 2015 [19] by considering all the mentioned evaluation metrics in our proposed work.
Table 1. Comparison of the various state of the art schemes with proposed FSDAA in percentage.
Approach Accuracy Precision Recall F-Measure TNR FPR FNR
Zhang et.al, 2013 [8] 61.28 64.36 59.45 57.25 65.04 27.12 32.15
M. Mazhar Rathore et.al, 2016 [14]
70.64 74.08 80.58 78.06 74.15 24.35 27.32
A.P. Plageras et.al, 2017 [15] 74.29 76.28 78.26 74.12 67.10 22.61 25.67
Sharmad Pasha, 2016 [17] 68.16 70.15 73.64 58.26 62.35 34.15 32.15
Akbar Adnan, et. al, 2018 [18] 80.14 79.05 86.01 82.14 81.39 21.68 29.31
László Lengyel et.al, 2015 [19] 76.20 79.35 81.29 80.65 74.36 23.16 26.74
FSDAA (Proposed) 84.56 86.21 88.60 84.91 86.34 15.42 18.22
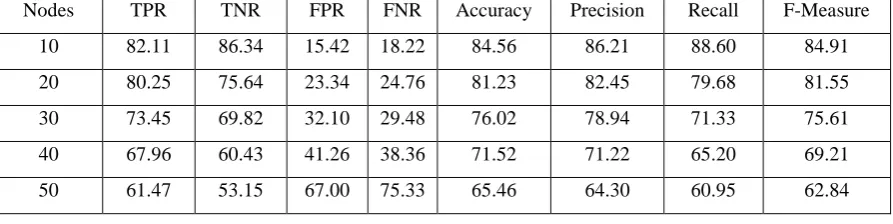
Table 2. Results of the various metrics at different nodes with proposed FSDAA in percentage at selected region
Nodes TPR TNR FPR FNR Accuracy Precision Recall F-Measure
10 82.11 86.34 15.42 18.22 84.56 86.21 88.60 84.91
20 80.25 75.64 23.34 24.76 81.23 82.45 79.68 81.55
30 73.45 69.82 32.10 29.48 76.02 78.94 71.33 75.61
40 67.96 60.43 41.26 38.36 71.52 71.22 65.20 69.21
50 61.47 53.15 67.00 75.33 65.46 64.30 60.95 62.84
positive rate is increased. FSDAA enables a superior accuracy value of 3% when compared to M. Mazhar Rathore et.al, 2016 approach. The results prove that FSDAA is capable of maintaining the average accuracy value of 3 % to 23% compared with the state of the art schemes. Likewise, precision value achieves the superior of 4%, recall value achieves the superior percentage of 2%, F-measure value achieves the superior of 5%, TNR value achieves the superior of 5%, FPR value achieves the superior of 3%, FNR value achieves the superior of 5% when compared to the state of the art schemes mentioned in Table 1. The results shown in Table 1 of our proposed FSDAA is considered as 10 nodes.
Table 2 depicts the results of the various metrics by varying nodes with proposed FSDAA in percentage at the selected region of this paper. The number of vehicles or simply called as nodes are varying starting from 10 to 50. On average, the increase of TPR is 23% by changing the nodes from 10 to 50. Similarly, TNR is decreased from 86-53%, FPR has been decreased by 15-67%, and FNR has been decreased by around 18-75% from 10 nodes to 50 nodes simultaneously. The percentages of FPR and FNR is decreasing means an increase in success rate because the false value in decrease means the increase in the success rate.
The reasons behind the success of FSDAA scheme compared to the baseline approaches considered for analysis are due to the efficient use of Simulink
model and testing samples induces more accuracy, true positive and true negative since they employ better combination for testing such that maximum alternatives are used for detecting the moving vehicles.
In addition to, the time complexity of FSDAA scheme is determined to be TComplex = O(MS) = O(n2). This time complexity is initially derived as TComplex = O(MS) since the processing time majorly depends on the acquiring of input video sequence ‘M’ and the number of detected sensor data ‘S’ in each input video. Further, the number of optimal features influencing the decision making depends on the number of clusters ‘C’ formed from the input vector of size ‘M’, Thus S = O(N) and hence the total time complexity of FSDAA is TComplex = O(n2).
5. Conclusions and Future Directions
accuracy, precision, recall, and f-measure, it yields the encouraging results compared with state of the art schemes.
The subsequent work of this proposed work is as follows- firstly, in this framework we didn’t provide any security and confidentiality for the FSDAA, therefore we will accomplish it. Secondly, the same framework has been implemented through the app for mobile users to identify the traffic jam and suggest optimal routes. However, in the future, the authors will be considering these issues to evaluate the proposed FSDAA framework's performance.
References
[1] Sivadi Balakrishna and M Thirumaran “Semantic Interoperable Traffic Management Framework for IoT Smart City Applications”, EAI Endorsed Transactions on Internet of Things, Vol 4, Issue 13 pp. 1-17, 2018. doi: 10.4108/eai.11-9-2018.15548
[2] Sivadi Balakrishna and M Thirumaran “Towards an Optimized Semantic Interoperability Framework for IoT-Based Smart Home Applications”, In: Balas V., Solanki V., Kumar R., Khari M. (eds) Internet of Things and Big Data Analytics for Smart Generation. Intelligent Systems Reference Library, vol 154. Springer, Cham, pp 185-211, 2019.
[3] Sivadi Balakrishna and M Thirumaran “Programming Paradigms for IoT Applications: An Exploratory Study”, In: Solanki, V. (Ed.), Díaz, V. (Ed.), Davim, J. (Ed.) Handbook of IoT and Big Data. Boca Raton: CRC press, Taylor & Francis Group, pp 23-57, 2019.
[4] Sivadi Balakrishna, Vijender Kumar Solanki, Vinit Kumar Gunjan, and M Thirumaran “Performance Analysis of Linked Stream Big Data Processing Mechanisms for Unifying IoT Smart Data” In: International Conference on Intelligent Computing and Communication Technologies (ICICCT), Springer, pp. 680-688, 2019.
[5] S.Bhadra, A. Kundu and S. K. Guha, “An Agent based Efficient Traffic Framework using Fuzzy”, Fourth International Conference on Advanced Computing & Communication Technologies, 2014.
[6] Anupama Mallik, Hiranmay Ghosh, Santanu Chaudhury, Gaurav Harit, "MOWL: An Ontology Representation Language for Web-based Multimedia Applications", ACM Trans. Multimedia Comput. Commun. Appl., vol. 10, no. 1, pp. 21, Dec. 2013.
[7] P. Pyykonen, J. Laitinen, J. Viitanen, P. Eloranta and Korhonen, “IoT for Intelligent Traffic System, IoT for intelligent traffic
system”, International Conference on Intelligent Computer Communication and Processing (ICCP), IEEE, 2013.
[8] Zhang, Q., Huang, T., Zhu, Y., & Qiu, M. “A case study of sensor data collection and analysis in smart city: provenance in smart food supply chain”, International Journal of Distributed Sensor Networks, vol. 9, no. 11, pp 382132, 2013.
[9] K. Kotis, & A. Katasonov, “Semantic Interoperability on the Web of Things: The Smart Gateway Framework”, In Proceedings of the Sixth International Conference on Complex, Intelligent, and Software Intensive Systems (CISIS-2012), Palermo, 2012. [10]D. Bandyopadhyay and J. Sen, “The internet of
things - applications and challenges in technology and Standardization", Springer International Journal of Wireless Personal Communications, vol. 58, no. 1, pp. 49-69, 2011.
[11]D. Singh, G. Tripathi and A. J. Jara, “A survey of Internet-of-Things: Future Vision, Architecture, Challenges and Services”, IEEE World of Forum on Internet of Things, 2017. [12] P. Pyykonen, J. Laitinen, J. Viitanen, P.
Eloranta and Korhonen, “IoT for Intelligent Traffic System, IoT for intelligent traffic system”, International Conference on Intelligent Computer Communication and Processing (ICCP), IEEE, pp 251-257, 2013. [13] X. Yu, F. Sun and X. Cheng, “Intelligent
Urban Traffic Management System Based on Cloud Computing and Internet of Things”, International Conference on Computer Science & Service System, IEEE, pp. 216, 2012. [14]M. Mazhar Rathore , Anand Paul , Awais
Ahmad , Suengmin Rho , “Urban planning and building smart cities based on the internet of things using big data analytics”, Computer Networks, Elsevier, pp 1-22, 2016, doi: 10.1016/j.comnet.2015.12.023
[15] A.P. Plageras, K.E. Psannis, C. Stergiou, H. Wang, B.B. Gupta, Efficient IoT-based sensor BIG Data collection-processing and analysis in Smart Buildings, Future Generation Computer Systems, Elsevier, pp 1-15, 2017,
https://doi.org/10.1016/j.future.2017.09.082
[16] Q. Liu Qiang Liu a, Yujun Ma b, Musaed Alhussein c, Limei Peng d, Yin Zhang e, “Green data center with IoT sensing and cloud-assisted smart temperature controlling system”, Computer Networks, Elsevier, pp 1-11, 2015,
http://dx.doi.org/10.1016/j.comnet.2015.11.02 4
[18] Akbar Adnan, George Kousiouris, Haris Pervaiz, Juan Sancho, Paula Ta-Shma, Francois Carrez, and Klaus Moessner. "Real-time probabilistic data fusion for large-scale IoT applications." IEEE Access, Vol 6, No 4, pp 10015-10027, 2018.