Comparative Study of Static and Dynamic Seismic
Analysis of a Multistoried Building
Anirudh Gottala Kintali Sai Nanda Kishore
M. Tech Student M. Tech Student
Department of Structural Engineering Department of Structural Engineering
Andhra University Andhra University
Dr. Shaik Yajdhani Assistant Professor
Department of Structural Engineering Andhra University
Abstract
Analysis and design of buildings for static forces is a routine affair these days because of availability of affordable computers and specialized programs which can be used for the analysis. On the other hand, dynamic analysis is a time consuming process and requires additional input related to mass of the structure, and an understanding of structural dynamics for interpret ation of analytical results. Reinforced Concrete (RC) frame buildings are most common type of constructions in urban India, which are subjected to several types of forces during their lifetime, such as static forces due to dead and live loads and dynamic forces due to earthquake. Here the present study describes the effect of earthquake load which is one of the most important dynamic loads along with its consideration during the analysis of the structure. In the present study a multi-storied framed structure of (G+9) pattern is selected. Linear seismic analysis is done for the building by static method (Seismic Coefficient Method) and dynamic method (Response Spectrum Method) using STAAD-Pro as per the IS-1893-2002-Part-1. A comparison is done between the static and dynamic analysis, the results such as Bending moment, Nodal Displacements, Mode shapes are observed, compared and summarized for Beams, Columns and Structure as a whole during both the analysis.
Keywords: RCC Buildings, Equivalent Static Analysis, Response Spectrum Analysis, Displacement
________________________________________________________________________________________________________
I.
I
NTRODUCTIONStructural analysis is mainly concerned with finding out the behaviour of a structure when subjected to some action. This action can be in the form of load due to weight of things such as people , furniture , wind snow etc .or some other kind of excitation such as earthquake , shaking of the ground due to a blast nearby ,etc. In essence all these loads are dynamic including the self-weight of the structure because at some point in time these loads were not there. The distinction is made between the dynamic and static analysis on the basis of whether the applied action has enough acceleration in comparison to the structure's natural frequency. If a load is applied sufficiently slowly, the inertia forces (Newton’s second law of motion) can be ignored and the analysis can be simplified as static analysis. Structural dynamics, therefore, is a type of structural analysis which covers the behaviour of structures subjected to dynamic (actions having high acceleration) loading. Dynamic loads include people, wind, waves, traffic, earthquake, and blasts. Any structure can be subjected to dynamic loading. Dynamic analysis can be used to find dynamic displacements, time history, and modal analysis.
In the present study, Response spectrum analysis is performed to compare results with Static analysis. The criteria of level adopted by codes for fixing the level of design seismic loading are generally as follows:
Structures should be able to resist minor earthquakes (<DBE), without damage.
Structures should be able to resist moderate earthquakes (DBE) without significant structural damage but with some non-structural damage.
Structures should be able to resist major earthquakes (MCE) without collapse.
"Design Basis Earthquake (DBE)” is defined as the maximum earthquake that reasonable can be expected to experience at the site once during lifetime of the structure. The earthquake corresponding to the ultimate safety requirements are often called as “Maximum Considered Earthquake (MCE) ".generally,” The (DBE) is half of (MCE)”.
During an earthquake , Ground motion occur in a random fashion both horizontally and vertically , in all directions radiating from the epicentre .The ground accelerations cause structures to vibrate and induce inertial forces on them. Hence structures in such locations need to be suitably designed and detailed to ensure stability, strength and serviceability with acceptable levels of safety under seismic effects.
capacity of structure . By enhancing ductility, and energy dissipation capacity in the structure obtained or alternatively, the probability of collapse reduced.
Dynamic analysis methods A.
It is performed to obtain the design seismic forces and its distribution to different level along the height of the building and to various lateral load resisting elements for the regular buildings and irregular buildings also as defined in (is-1893 part-1-2000 ) in clause 7.8.1
Regular Building 1)
Those > than 40m height, in Zone 4 and Zone 5 Those > than 90m height, in Zone 2 and Zone 3
Irregular Building 2)
All framed building higher than 12m in Zone 4 and Zone 5 Those greater than 40m in Zone 2 and Zone 3
Civil engineering structures are mainly designed to resist static loads. Generally the effect of dynamic loads acting on the structure is not considered. This feature of neglecting the dynamic forces sometimes becomes the cause of disaster, particularly in case of earthquake. In case of earthquake forces the demand is for ductility. Ductility is an essential attribute of a structure that must respond to strong ground motions. Larger is the capacity of the structure to deform plasticity without collapse, more is the resulting ductility and the energy dissipation. This causes reduction in effective earthquake forces.
II.
M
ETHODS OFA
NALYSISCode-based Procedure for Seismic Analysis A.
Main features of seismic method of analysis based on Indian standard 1893(Part 1):2002 are described as follows Equivalent static lateral force method
Response spectrum method
Square roots of sum of squares (SRSS method) Complete Quadratic combination method (CQC) Elastic time history methods
By IS code method for dynamic analysis B.
By STAAD PRO software Method-for static and dynamic analysis both C.
Equivalent Static Analysis: 1)
All design against seismic loads must consider the dynamic nature of the load. However, for simple regular structures, analysis by equivalent linear static methods is often sufficient. This is permitted in most codes of practise for regular, low-to medium-rise buildings. It begins with an estimation of base shear load and its distribution on each story calculated by using formulas given in the code. Equivalent static analysis can therefore work well for low to medium-rise buildings without significant coupled lateral-torsional effects, are much less suitable for the method, and require more complex methods to be used in these circumstances.
Response Spectrum Method: 2)
The representation of the maximum response of idealized single degree freedom system having certain period and damping, during earthquake ground motions. The maximum response plotted against of un-damped natural period and for various damping values and can be expressed in terms of maximum absolute acceleration, maximum relative velocity or maximum relative displacement. For this purpose response spectrum case of analysis have been performed according to IS 1893.
III.
M
ODELLING ANDA
NALYSISFor the analysis of multi storied building following dimensions are considered which are elaborated below. In the current study main goal is to compare the Static and Dynamics Analysis (Rectangular) building.
Static and Dynamic Parameters:- A.
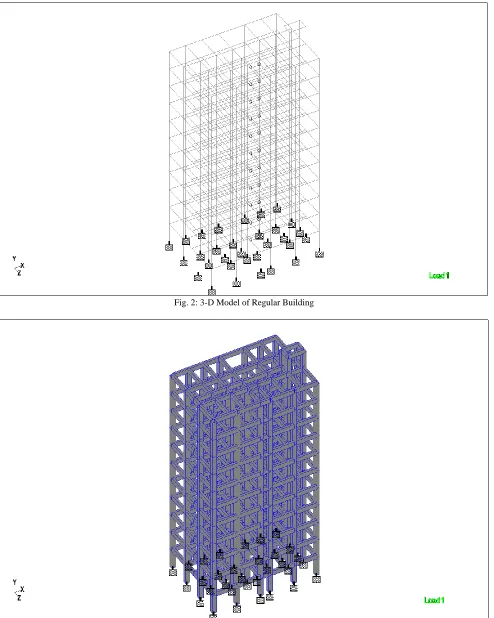
Design Parameters:- Here the Analysis is being done for G+9 (rigid joint regular frame ) building by computer software using STAAD-Pro.
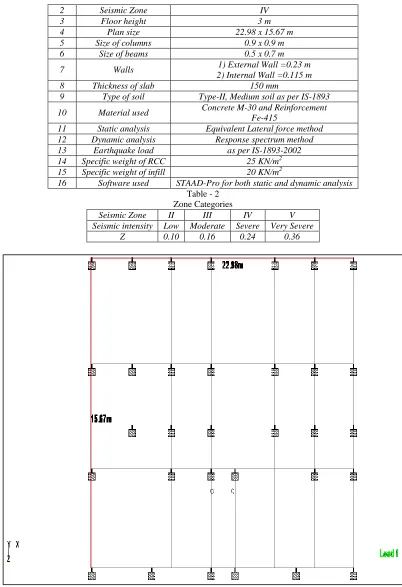
Design Characteristics:- The following design characteristic are considered for Multistory rigid jointed plane frames Table – 1
Design Data of RCC Frame Structure
S.No Particulars Dimension/Size/Value
2 Seismic Zone IV
3 Floor height 3 m
4 Plan size 22.98 x 15.67 m
5 Size of columns 0.9 x 0.9 m
6 Size of beams 0.5 x 0.7 m
7 Walls 1) External Wall =0.23 m
2) Internal Wall =0.115 m
8 Thickness of slab 150 mm
9 Type of soil Type-II, Medium soil as per IS-1893
10 Material used Concrete M-30 and Reinforcement Fe-415
11 Static analysis Equivalent Lateral force method 12 Dynamic analysis Response spectrum method
13 Earthquake load as per IS-1893-2002
14 Specific weight of RCC 25 KN/m2
15 Specific weight of infill 20 KN/m2
16 Software used STAAD-Pro for both static and dynamic analysis Table - 2
Zone Categories
Seismic Zone II III IV V
Seismic intensity Low Moderate Severe Very Severe
Z 0.10 0.16 0.24 0.36
Fig. 2: 3-D Model of Regular Building
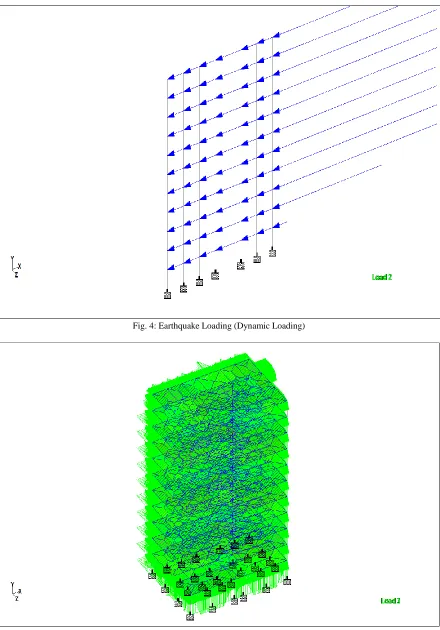
Fig. 4: Earthquake Loading (Dynamic Loading)
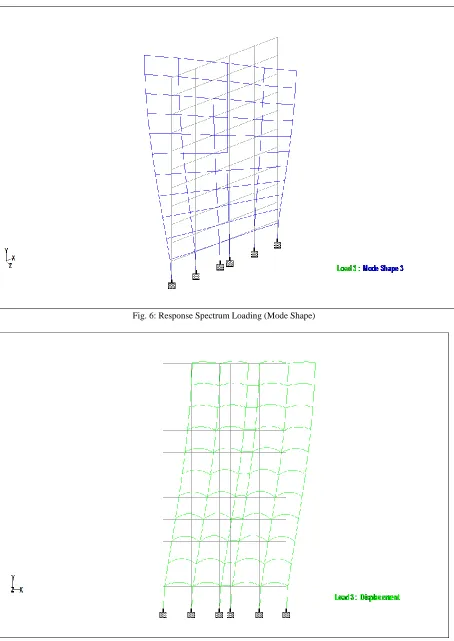
Fig. 6: Response Spectrum Loading (Mode Shape)
IV.
R
ESULTS ANDD
ISCUSSIONSThe above RCC frame structure is analyzed both statically and dynamically and the results are compared for the following three categories namely Beam Stresses, Axial Forces, Torsion, Displacements and Moment at different nodes and beams and the results are tabulated as a shown below.
Comparison of Moment for Vertical Members A.
Table - 3
Comparison of Bending Moment
COLUMN NUMBER L/C STATIC ANALYSIS
(KN-M) L/C
DYNAMIC ANALYSIS (KN-M)
949 9 204.49 10 313.6
917 9 292.37 10 433.17
885 9 371.82 10 574.08
853 9 426.2 10 691.36
821 9 462.21 10 787.2
789 9 484.15 10 862.07
Comparison of Axial Forces for Vertical Members B.
Table - 4
Comparison of Axial Forcfes
COLUMN NUMBER L/C STATIC ANALYSIS
(KN) L/C
DYNAMIC ANLYSIS (KN)
9947 9 119.9 10 127.3
915 9 295.5 10 305.5
883 9 468.8 10 479.7
851 9 639.1 10 649.6
819 9 806.7 10 815.03
787 9 971.647 10 976.007
Comparison of Torsion for Vertical Members C.
Table – 5 Comparison of Torsion
COLUMN NUMBER L/C STATIC ANALYSIS
(KN-m) L/C
DYNAMIC ANLYSIS (KN-m)
946 EQ+X -6.036 RE 17.347
914 EQ+X -7.936 RE 30.23
882 EQ+X -8.47 RE 35.247
850 EQ+X -8.642 RE 54.816
818 EQ+X -8.65 RE 65.58
786 EQ+X -8.48 RE 74.72
EQ+X = Earthquake Loading in X-Direction(+). RE = Response Spectrum Loading.
Comparison of Displacements for Vertical Members D.
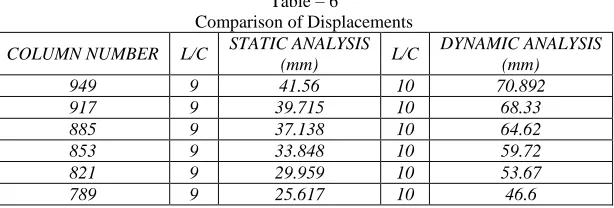
Table – 6
Comparison of Displacements
COLUMN NUMBER L/C STATIC ANALYSIS
(mm) L/C
DYNAMIC ANALYSIS (mm)
949 9 41.56 10 70.892
917 9 39.715 10 68.33
885 9 37.138 10 64.62
853 9 33.848 10 59.72
821 9 29.959 10 53.67
789 9 25.617 10 46.6
Comparison of Nodal-Displacements in Z-Direction E.
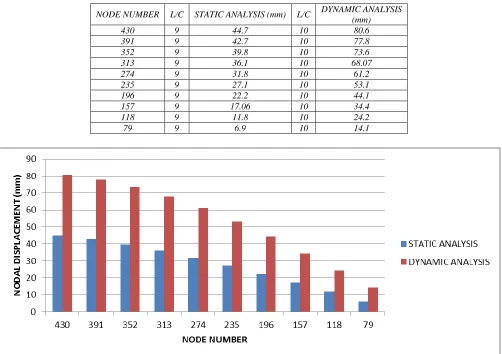
Table – 7
NODE NUMBER L/C STATIC ANALYSIS (mm) L/C DYNAMIC ANALYSIS (mm)
430 9 44.7 10 80.6
391 9 42.7 10 77.8
352 9 39.8 10 73.6
313 9 36.1 10 68.07
274 9 31.8 10 61.2
235 9 27.1 10 53.1
196 9 22.2 10 44.1
157 9 17.06 10 34.4
118 9 11.8 10 24.2
79 9 6.9 10 14.1
Fig. 8: Nodal-Displacements in Z-Direction
Comparison of Beam Stresses in Static Analysis F.
Table - 8
Comparison of Beam Stresses in Static Analysis STATIC ANALYSIS
BEAM L/C MAX COMPRESSIVE STRESS (N/mm2) MAX TENSILE STRESS (N/mm2)
604 9 6.49 -5.82
548 9 9.1 -9.09
492 9 10.82 -10.84
436 9 12.24 -12.25
380 9 13.27 -13.29
324 9 13.93 -13.95
Comparison of Beam Stresses in Dynamic Analysis G.
Table - 9
Comparison of Beam Stresses In Dynamic Analysis DYNAMIC ANALYSIS
BEAM L/C MAX COMPRESSIVE STRESS (N/mm2) MAX TENSILE STRESS (N/mm2)
604 10 10.95 -10.44
548 10 13.67 -13.6
492 10 16.01 -15.98
436 10 18.27 -18.24
380 10 20.23 -20.2
324 10 21.78 -21.76
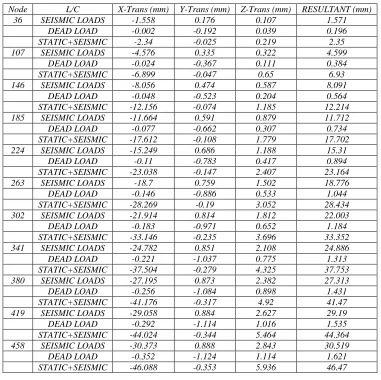
Nodal Displacements In 5-A-C Frame: H.
Table – 10
Node L/C X-Trans (mm) Y-Trans (mm) Z-Trans (mm) RESULTANT (mm)
36 SEISMIC LOADS -1.558 0.176 0.107 1.571
DEAD LOAD -0.002 -0.192 0.039 0.196
STATIC+SEISMIC -2.34 -0.025 0.219 2.35
107 SEISMIC LOADS -4.576 0.335 0.322 4.599
DEAD LOAD -0.024 -0.367 0.111 0.384
STATIC+SEISMIC -6.899 -0.047 0.65 6.93
146 SEISMIC LOADS -8.056 0.474 0.587 8.091
DEAD LOAD -0.048 -0.523 0.204 0.564
STATIC+SEISMIC -12.156 -0.074 1.185 12.214
185 SEISMIC LOADS -11.664 0.591 0.879 11.712
DEAD LOAD -0.077 -0.662 0.307 0.734
STATIC+SEISMIC -17.612 -0.108 1.779 17.702
224 SEISMIC LOADS -15.249 0.686 1.188 15.31
DEAD LOAD -0.11 -0.783 0.417 0.894
STATIC+SEISMIC -23.038 -0.147 2.407 23.164
263 SEISMIC LOADS -18.7 0.759 1.502 18.776
DEAD LOAD -0.146 -0.886 0.533 1.044
STATIC+SEISMIC -28.269 -0.19 3.052 28.434
302 SEISMIC LOADS -21.914 0.814 1.812 22.003
DEAD LOAD -0.183 -0.971 0.652 1.184
STATIC+SEISMIC -33.146 -0.235 3.696 33.352
341 SEISMIC LOADS -24.782 0.851 2.108 24.886
DEAD LOAD -0.221 -1.037 0.775 1.313
STATIC+SEISMIC -37.504 -0.279 4.325 37.753
380 SEISMIC LOADS -27.195 0.873 2.382 27.313
DEAD LOAD -0.256 -1.084 0.898 1.431
STATIC+SEISMIC -41.176 -0.317 4.92 41.47
419 SEISMIC LOADS -29.058 0.884 2.627 29.19
DEAD LOAD -0.292 -1.114 1.016 1.535
STATIC+SEISMIC -44.024 -0.344 5.464 44.364
458 SEISMIC LOADS -30.373 0.888 2.843 30.519
DEAD LOAD -0.352 -1.124 1.114 1.621
STATIC+SEISMIC -46.088 -0.353 5.936 46.47
Column End Forces of 5-A-C Frame: I.
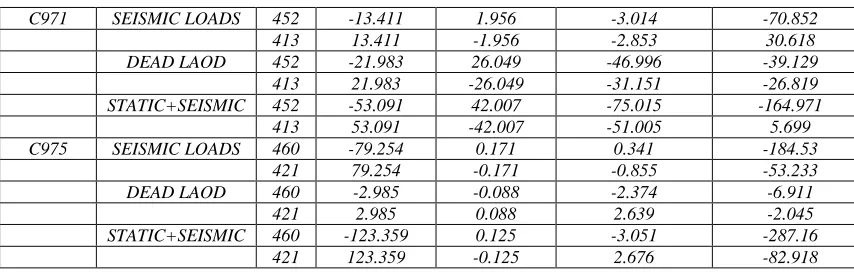
Table – 11
Column End Forces of 5-A-C Frame
COLUMN L/C Node Shear-Y (KN) Shear-Z (KN) Moment-Y (KN-m) Moment-Z (K-Nm)
C907 SEISMIC LOADS 374 -72.563 -0.272 3.154 -170.257
335 72.563 0.272 -2.337 -47.431
DEAD LAOD 374 -21.665 24.186 -36.129 -32.838
335 21.665 -24.186 -36.429 -32.158
STATIC+SEISMIC 374 -141.342 35.871 -49.463 -304.643
335 141.342 -35.871 -58.149 -119.383
C911 SEISMIC LOADS 382 -154.739 0.03 1.804 -288.402
343 154.739 -0.03 -1.893 -175.814
DEAD LAOD 382 -4.579 0.546 -3.282 -7.242
343 4.579 -0.546 1.645 -6.495
STATIC+SEISMIC 382 -238.977 0.863 -2.218 -443.466
343 238.977 -0.863 -0.372 -273.464
C939 SEISMIC LOADS 413 -51.635 1.662 -0.785 -148.44
374 51.635 -1.662 -4.2 -6.467
DEAD LAOD 413 -22.525 25.759 -40.699 -36.058
374 22.525 -25.759 -36.577 -31.516
STATIC+SEISMIC 413 -111.24 41.131 -62.227 -276.746
374 111.24 -41.131 -61.165 -56.974
C943 SEISMIC LOADS 421 -114.611 0.121 1.165 -234.016
382 114.611 -0.121 -1.529 -109.816
DEAD LAOD 421 -4.781 0.371 -3.573 -8.662
382 4.781 -0.371 2.461 -5.682
STATIC+SEISMIC 421 -179.088 0.738 -3.611 -364.017
C971 SEISMIC LOADS 452 -13.411 1.956 -3.014 -70.852
413 13.411 -1.956 -2.853 30.618
DEAD LAOD 452 -21.983 26.049 -46.996 -39.129
413 21.983 -26.049 -31.151 -26.819
STATIC+SEISMIC 452 -53.091 42.007 -75.015 -164.971
413 53.091 -42.007 -51.005 5.699
C975 SEISMIC LOADS 460 -79.254 0.171 0.341 -184.53
421 79.254 -0.171 -0.855 -53.233
DEAD LAOD 460 -2.985 -0.088 -2.374 -6.911
421 2.985 0.088 2.639 -2.045
STATIC+SEISMIC 460 -123.359 0.125 -3.051 -287.16
421 123.359 -0.125 2.676 -82.918
Beam End Forces of 5-A-C Frame: J.
Table – 12
Beam End Forces of 5-A-C Frame
Beam L/C Node Shear-Y (KN) Shear-Z (KN) Moment-Y (K-Nm)
Moment-Z (K-Nm)
B540 SEISMIC LOADS 374 66.297 -2.684 13.944 178.009
382 -66.297 2.684 0.185 171.046
DEAD LAOD 374 58.909 -0.009 0.091 64.584
382 64.356 0.009 -0.046 -46.395
STATIC+SEISMIC 374 187.81 -4.038 21.053 363.889
382 -2.911 4.038 0.208 186.975
B596 SEISMIC LOADS 413 44.635 -3.524 17.675 119.659
421 -44.635 3.524 0.877 115.344
DEAD LAOD 413 58.438 0.266 -0.661 63.227
421 64.827 -0.266 -0.737 -47.52
STATIC+SEISMIC 413 154.61 -4.887 25.521 274.33
421 30.289 4.887 0.209 101.736
B652 SEISMIC LOADS 452 25.778 -4.599 21.65 72.241
460 -25.778 4.599 2.562 63.483
DEAD LAOD 452 33.511 0.478 -1.334 38.493
460 42.528 -0.478 -1.181 -29.704
STATIC+SEISMIC 452 88.933 -6.182 30.475 166.1
460 25.124 6.182 2.071 50.668
V.
C
ONCLUSIONThe results as obtained using STAAD PRO 2006 for the Static and Dynamic Analysis are compared for different categories As per the results in Table No 3,We can see that the values for Moments are 35 to 45 % higher for Dynamic analysis
than the values obtained for Static analysis .
As per the results in Table No 4, We can see that there is not much difference in the values of Axial Forces as obtained by Static and Dynamic Analysis of the RCC Structure.
As per the results in Table No 5,We can see that the values of Torsion of columns are negative for Static analysis and for Dynamic analysis the values of torsion are positive.
As per the results in Table No 6, We can see that the values for Displacements of columns are 40 to 45% higher for Dynamic analysis than the values obtained for Static analysis.
As per the results in Table No 7, We can see that the values of Nodal Displacements in Z direction are 50% higher for Dynamic analysis than the values obtained for Static analysis .
As per the results in Table No 8 and 9, Compressive and tensile stresses in the studied beams were approximately equal.
Nodal Displacements and Bending moments in beams and columns due to seismic excitation showed much larger values compared to that due to static loads.
R
EFERENCES[1] Murty.CVR and Jain.SK " A Review of IS-1893-1984 Provisions on Seismic Design of Buildings ". The Indian concrete journal , Nov.1994.
[2] Sarkar , P. Agarwal , R and Menon , D." Design of beam ,column joints under Seismic loadings " A review, Journal of structural engineering SERC,
[3] Reddell, R and Llera , J.C.D.L " Seismic analysis and design " Current practise and Future trends. Eleventh World Conference on earthquake, engineering Mexico.
[4] BIS-1893,Criteria for Earthquake resistant design of structures-Part-1,General Provisions and Buildings , Bureau of Indian Standards ,New
Delhi-2002.
[5] IS-456-1978 and IS-456-2000."Indian Standard of code and practise for plain and Reinforced concrete "Bureau of Indian Standards ,New Delhi-2002
[6] IS-875-1987. "Indian Standard code of practise for structural safety loadings standards part-1,2 " Bureau of Indian Standards , New -Delhi
[7] SP-16-1980-Design Aids for Reinforced concrete to IS-456-1978-Bureau of Indian standards, New Delhi.
[8] Jain Sudhir .K.-E. course on Indian seismic code IS-1893-2002-Part-1 IIT Kanpur .
[9] Agarwal . Pankaj and Shirkhande Manish " Earthquake resistant design of structure "PHI, Learning Pvt.Ltd.New Delhi-2010
[10] E.LWilsons and K.Bathe , "Stability and accuracy analysis of direct integration method " Earthquake engineering and Structural dynamics -vol-1,1973
[11] Pillai.S. Unnikrishna and Menon Devdas -Reinforced concrete design .3rd ed. Tata Mcgraw Hill Eduction Private Ltd , New Delhi
[12] Paz .Mario "Structural Dynamics " Theory and computation ,CBS, Publishers and Distributors Dayaganj ,New Delhi.
[13] Rai.Durgesh .C.Hemanth .B. Kaushik .Jain .Sudir .K " A case for use of dynamic analysis in designing for earthquake forces "-Department of Civil
Engineering ,IIT kanpur-india
[14] A.E.Hassaballa , Probabilistic Seismic Hazard Assessment and Seismic Design Provisions for Sudan ,Ph.D Thesis , SUST,2010