http://www.sciencepublishinggroup.com/j/epes doi: 10.11648/j.epes.20190806.13
ISSN: 2326-912X (Print); ISSN: 2326-9200 (Online)
The Techniques for Achieving High Power Equipment
Reliability with Distributed Informational System
Arakelian Edik Koyrunovich
1, Sultanov Makhsud Mansurovich
2, Evseev Kirill Viktorovich
21
Department of Automation and Process Operation, National Research University “Moscow Power Engineering Institute”, Moscow, Russia
2
Department of Heat Power Engineering, National Research University «Moscow Power Engineering Institute», Volzhsky, Russia
Email address:
To cite this article:
Aralekian Edik Koyrunovich, Sultanov Makhsud Mansurovich, Evseev Kirill Viktorovich. The Techniques for Achieving High Power Equipment Reliability with Distributed Informational System. American Journal of Electrical Power and Energy Systems.
Vol. 8, No. 6, 2019, pp. 158-164. doi: 10.11648/j.epes.20190806.13
Received: August 1, 2019; Accepted: November 26, 2019; Published: December 24, 2019
Abstract:
The problem of power generating equipment reliability and safety of thermal (TPP), hydro (HPP) and nuclear (NPP) power plants at each its life cycle stage is set and the solution approach is proposed. The blockchain distributed data storage system to unite different members of the energy system is described. It is shown that the suggested technology allows decentralized data storage reliability increase due to the data exists till its last participant leaves and safety is ensured by the electric market participant consensus algorithm. The algorithm for the decentralized blockchain system is developed. The new technique for reliability design calculation based on using both constant and time-varying failure rate is introduced. It is suggested to use control action method expressed as the design, technological and operational parameters from the normative documents. The generalized model of reliability design calculation representing product of three components of failure free operation probability is developed. It is shown that developing new algorithms of statistical data obtaining and designing full repair processes allow planning equipment repair, obtaining and analyzing the corresponding reliability indeces when the equipment is in operation and then choose the most fitting repair time and amount optimization, operation mode selection and power plant long term equipment time in operation forecasting solutions. The technique for the power equipment condition forecasting by archival data stored in the distributed system, the data can be used to predict equipment failures and decide whether it should be repaired. It is shown that the desired prediction accuracy can be achived by using neural network due to its feature to reveal complex relations between input and output values.Keywords:
Power Equipment Reliability, Blockchain, Machine Learning1. Introduction
Issues of reliability and safety in large engineering systems should be taken into account at the combined heat and power station (CHP), nuclear power plant (NPP) and hydroelectric plant (HEP) power equipment design, manufacturing and operational stages. This is due to the fact that thermal and electrical generation reliability factor is one of the key parameter at the wholesale market for electricity and power. Over the past 30 years the CHP, NPP and HEP power equipment lifetime exceeded the established, though the required quantity of heat and electrical energy only increased and it demands new sources of power. Thus it’s necessary to develop new techniques and mathematical models for
maintaining high level of power equipment reliability and safety at each lifetime stage.
One of the basic criteria of power equipment reliability maintaining is information support quality of actual equipment state and its previous values, which can be used for equipment failure and malfunction prediction and decision making whether the equipment should be out of service for repair.
2. Distributed Power Equipment Data
Base
Thus it’s necessary to create a system, which purpose is receive, analyze and store reliability data, which includes electricity generator, system operator and power equipment manufacturer information. As the result, power equipment reliability and quality are monitored over its lifetime, spanning the moment of being produced to decommissioning.
The tasks to be solved are provided below:
1. Need for finding the market member to be responsible
for data acquisition and storing, maintaining its reliability;
2. Making data base open to each market member - from
power equipment manufacturer to power generation facility;
3. Providing continuous data receiving from market
members;
4. Data validity and safety assurance.
In its turn, centralized data harvesting and store alongside with provisioning are exposed to financial expenses and its level will increase as the data base spreads out, and due to its inaccessibility in free cost it will have a negative impact on the market members’ motivation for data sharing. As the data base lifetime is not limited, but its structure can be morphed it’s necessary to store data securely.
The decentralized data store technology, such as blockchain, is suggested to solve this problem. In this case each market member can store, retrieve and enter data [1, 3]. Implementing the technology means that data exists as long
as there is at least one member storing it. The consensus algorithm provides data security, i.e. if a market member tries to send data, that fails to meet the consensus, it will be rejected.
The key feature of the suggested technology is absence of mediators, whose purpose is assuring reliability and safety - those functions are up to the system members. It means that if at least 51% of members abide by the consensus, then the system is safe, hence it becomes more secure with increasing the amount of members.
The modern electric power system unites large electricity generators, transmission system operators and distribution companies. In Russian Federation the system operator and trading system administrator of the unified energy system are responsible for information management, which scope is
qualitative-quantitative values, representing member
relationship of the wholesale market for electricity and power [2, 4]. The suggested system members are power equipment manufacturers, power generators and system operators. All of them are equal partners.
The purpose of the system is acquire and store actual power equipment state and its archival data during its lifetime: malfunctions, failures, scheduled and off-scheduled outages, machine loading changes, relocation of equipment between members. Full information is stored in data blocks, where each has the hash of last one and contains data about all previous blocks in the chain, so it’s impossible to fake any chain element.
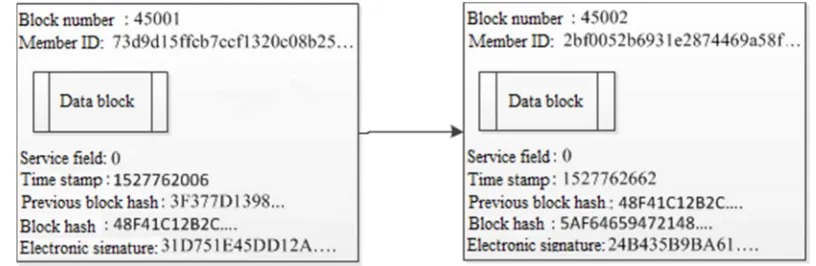
In figure 1 the common informational system structure is presented, which contains two blocks.
Figure 1. The common informational system structure.
The informational system structure illustrated in figure 1 represents two connected in series blocks with the following fields:
1. Block number (required field);
2. Member identification key (required field);
3. Data block, which contains power equipment
information (optional field);
4. Service field, which is introduced because of the
assuming that the informational system exists long time and some data parameters and the consensus algorithm can be changed. When it’s necessary to edit blockchain rules members can vote for them by sending empty blocks but this field, which contains their decision.
Moreover this field can be used as indication, attracting other members (optional field, empty by default);
5. Previous block hash provides data validity (required
field);
6. Timestamp represents Unix Timestamp (required
field);
7. Block hash is data hash including previous block hash
(required field);
8. Electronic signature allows verifying whether the data
was sent by the proper member.
The proposed system can’t be complete decentralized, because of its importance at the country level, therefore it’s necessary to the state to decide whether include a member or not, and creating state electronic signature provider makes it possible. The electronic signature provider is considered to be an information system member with exclusive rights to assign electronic signatures, register members and freeze them.
The first block in the chain is provider’s one, containing its open key allowing other members checking its electronic signature.
Process of registration consists of:
1. A member (generator, equipment manufacturer)
submits join with sending the proper papers to the state provider (SP);
2. The SP verifies the request;
3. The SP adds the member in blockchain assigning an
open key and electronic signature to it;
4. The other members check the electronic signature and
accept the block;
5. Each member gets its personal closed key to sign their
data and send it to the blockchain.
The SP also has a permission to freeze members.
Any decentralized blockchain system must follow the consensus algorithm. If a block doesn’t meet the requirement members reject it. Hence if at least 51% of members are fair, then incoming blocks are considered valid.
The consensus algorithm:
1. Block hash verifying;
2. Sender verifying: checking the last report block on
member and their status from the SP;
3. Member’s electronic signature verifying via comparing
with the report block data;
4. Block data validation;
5. Timestamp verifying: the datetime value can’t be
greater than previous block’s one;
6. Previous block hash checking;
If the consensus condition is met then block is added to the blockchain.
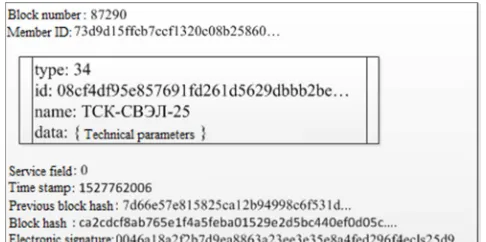
Block data validation depends on the block data type as various members use different data structures. As an example let’s analyze a power equipment manufacturer and their block data structure. Let’s suppose that the manufacturer produces transformers TSK-SVEL-25, then the data structure looks as it’s shown in figure 2.
Figure 2. Equipment model registration.
The following fields are filled:
1. Type, i.e. sent data type. In this case it takes a number
34, which means new equipment model registration code. It is a required field for block if it includes data as it’s considered in data block validation;
2. Id represent a 256-bit unique identifier, which is always
verified to be unique when it’s received (required field);
3. Name field contains the equipment model stamp
(optional field);
4. Data field can store technical parameters (optional
field).
The proposed structure can be morphed with putting field List after Type, where it can store an array of equipment stamps (figure 3). Doing so the manufacturer can register produced equipment after their registered the equipment model.
Figure 3. Produced equipment registration.
Equipment registration assigns a unique 256-bit key and sends data to the system. Therefore the following information is available:
1. The manufacturer information, which is added by the
SP;
2. The equipment models;
3. The produced equipment instances.
Then the manufacturer supplies equipment to a power generator, which is the system member too. To do so it’s necessary to create a transaction data block (figure 4).
Figure 4. The transaction block data.
Where Type value 3 means an outgoing transaction; To is the power generator address; List field contains registered equipment; Data field is for notes.
Type value equal 4. After that a generator is capable to share the equipment state information via the blockchain system.
3. Power Equipment Reliability Model
Designing new statistical data acquisition algorithm and developing complete repair process mathematical model allows its conditioning process simulation, obtaining and analyzing reliability rate of equipment in operation and making decision on optimizing repair volume and schedule, qualitative operation mode selection and forecasting equipment operating age.
Unlike the known design reliability calculation method
based on constancy of component fault rate λ(t) = λ = const
the suggested one is based on concerning both constant λ = const and time-varying λ(t) fault rate [7-12]. The technique and mathematical models are described in figures 5-8.
According to the presented schematic structure, general design calculation model has been developed, which represents product of three probability of failure-free operation components.
( )
1( ) ( ) ( )
2.
3,
об
t
P
t
P
t
P
t
P
=
(1)Where P1(t) stands for unpredictable failure regarding
probability of failure-free operation in time t; P2(t) is year failure rate probability;
P3(t) is mechanical engineering assemblies and metalwork
probability of failure-free operation in time t.
Figure 5. Engineering system component schematic structure.
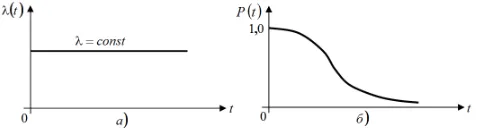
With exponential failure law and three series-connected element schematic structure (figure 5) will find engineering system reliability calculation mathematical models for each equation (1) component:
1. Unpredictable constant failure rate reliability
calculation model (Figure 6a):
( )
1 1 exp , n i iP t λt
=
= −
∑
(2)
Where λi is engineering system component failure rate
from reference literature or technical standard documentation; t is for time.
Figure 6. Stationary random function (a - failure rate, b - reliability function).
2. Year-variant failure rate reliability calculation model
(figure 6b, 7):
( )
exp
( )
,
1 3 1 2
λ
−
=
∑ ∑
= = n i j ijt
t
P
(3)Figure 7. Failure rate time history chart.
Timespans: (0 – t1), (t 1 – t 2), (t 2 – tn), (tn – tn+1).
3. Mechanical engineering assemblies and metalwork
reliability calculation model:
( )
;σ σ12 22
2 1 3 + − Φ
= m m
t
P (4)
( )
(
)
; σ 2 exp π 2 σ 1 2 1 2 1 1 1 − −= x m
x
f (5)
( )
(
)
;
σ
2
exp
π
2
σ
1
2 2 2 2 2 2
−
−
=
x
m
x
f
(6)( )
2,
2 2 1 2 2 2 1 2 1
1
σ
σ
ν
+
ν
−
=
+
−
=
n
n
m
m
U
p (7)Where m1 and m2 stand for durability and load mathematical expectation respectively (Figure 8),
σ1 and σ2 are root mean square durability and load respectively (figure 8),
2 1
m
m
n
=
is assurance factor,1 1 1
m
σ
=
ν
is durability variation coefficient,2 2 2
m
σ
=
ν
is load variation coefficient,Figure 8. Durability and load density.
Component design reliability calculation should concern 3 lifetime stages with various failure rate:
1. Implementation;
2. Operation (30 years) till complete repair;
3. Depreciation and ageing after 30 years in operation.
At each stage the failure rate is chosen according to the similar item statistic data or reference information.
Such an approach to design reliability calculation allows estimating reliability and safety level more objectively at each lifetime stage. Safety level is calculated from accident failure rate, causing fire, explosion, flooding etc. Assembly units and elements, which can cause accident, are determined by design manager of the respective unit or element.
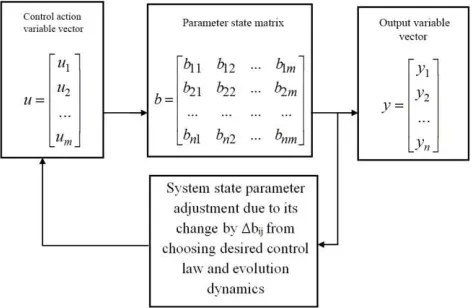
The control action method is suggested to increase level of reliability at design stage. The control actions are design, process and operational data according to the standards [7, 11, 12]. The principle of the method is outlined as follows: design calculation model is a system of input, output and condition variables (figure 9).
Figure 9. Design calculation model for reliability enhancement.
Control action variables can be defined as structural changes in design documents, process condition changes in process documents and directions for updating operational documentation. The parameter status matrix represents permissible design, process and operational parameter variation sets. Output variable vector represents reliability parameter expressed as failure rate, mean time between failures or probability of failure-free operation on each parameter status in the timespan t.
With exponential failure law control actions can be determined from formula [12]:
( ) ( ) ( ) ( ) ( ) ( ) ( ) ( ) , ... ... ... ... ... ... ... ... / exp 1 ... ... req req 2 req 1 2 1 2 22 21 1 12 11 0 0 2 0 1 2 1 + − − + = n nm n n m m m m y y y b b b b b b b b b T t T t u t u t u t u t u t u (8)
Where Uj(t) is control action; Uj0 is control action initial
value; T - construction documentation design duration; yireq(t)
is required value of reliability in timespan t for each status variable; +
nm n n m mb
b
b
b
b
b
b
b
b
...
...
...
...
...
...
...
2 1 2 22 21 1 12 11– pseudoinverse matrix
system status parameter from standards.
The technique for design calculation and achieving required level of reliability and safety is continuous cycle (figure 10).
Figure 10. The technique for design calculation and achieving required level of reliability and safety.
If in the process of designing an output variable doesn’t reach the required value then the design, process and operational documents are to be adjusted till the condition is fulfilled. The new method and approach to extents of tests planning is suggested to verify the calculated reliability value at power equipment element prototype stage [12, 15].
The feature of power equipment is that it consists of components or elements, which are designed and produced by derivative plants and factories. The components are tested both as a single element and a part of the power equipment. Should be noticed that design reliability calculations of massive metalwork and mechanical engineering assemblies (such as boiler, turbine, shaft etc.) are made, considering maximum value of critical section load or assurance factor because of normal probability law of actual load and durability.
Figure 11. The components of element prototype test method.
Control action improvement simulation is similar to the presented in figure 9, but the state variable matrix is a set of actual structural and technological change parameters during production and the documentation is improved based on test results.
In figure 11 the fixed amount of testing and sequential analysis methods are presented, which are unlike the methods, where prototype test assumes producer’s and buyer’s risk, i.e. rejection after the test. In the proposed technique producer’s risk vanishes, i.e. α=0.
The repository data can be used for equipment malfunction and failure prediction. Prediction accuracy can be increased with implementing artificial neural networks due to their capability to find complicated and ambiguous input-output data dependencies.
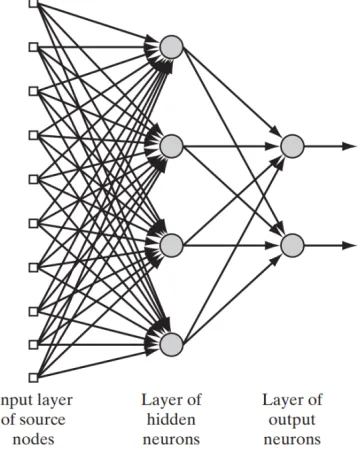
The artificial neural network unit is a neuron. Their ordered combination is a structured system (figure 12), which allows solving classification, image recognition, prediction tasks [16].
Figure 12. Neural network model.
Like natural neurons artificial ones are connected to each other with synapsis and convey weight proportional signals, which depend on synapsis coefficient (figure 13). Before a neural network can attack the problem it should be trained, i.e. its synapsis weights are to be adjusted to solve the task.
During the training it’s necessary to reach the lowest error.
Figure 13. Common neural network structure.
Because of the generalization and finding hidden relations of input and output values a trained neural network is capable to predict future parameter variable, based on previous ones. In the present issue predicted power equipment condition can be found if the neural network knows its repository data. The result of the calculation allows warn equipment malfunction and failure. Should be mentioned, that the data processing machine, applying the neural network must belong to the blockchain system.
4. Conclusions
1. The suggested technique for achieving high reliability
and levels of the power equipment using the archival data allows maintaining the stated indeces at the desired by the energy system level at each equipment life cycle stage from design to decommissioning.
2. Using the decentralized blockchain informational
system allows reliable data storage and sharing power equipment reliability information and among members of the electrial market.
3. Using the suggested power equipment condition
forecasting method by the archival data from the distributed systm can help predict equipment failures and decide whether it should be repaired. The forecasting accuracy can be achived by using neural network as a machine learning method.
References
[1] M. M. Sultanov, V. M. Truhanov, EH. K. Arakelyan, M. A. Kulikova Metody dostizheniya i obespecheniya vysokogo urovnya nadezhnosti i bezopasnosti ehnergeticheskogo oborudovaniya TEHS, GEHS, AEHS na vsekh ehtapah zhiznennogo cikla / «Novoe v Rossijskoj EHlektroehnergetike» - Ezhemesyachnyj nauchno-tekhnicheskij ehlektronnyj zhurnal; № 3, mart 2018 g; 6-15 cc.; ISSN 2312-055X
[3] Mamontova M. Y. Blokchejn i vozmozhnosti ego primeneniya v ehnergetike //Informacionnye tekhnologii v nauke, upravlenii, social'noj sfere i me. – 2017. – 417 p.
[4] Melanie Swan, Blockchain: Blueprint for a New Economy – O’Reilly, 2015.– 152 p.
[5] «Sovremennaya rynochnaya ehnergetika Rossiyskoy federacii». – M.: AHO «Uchebnyj centr NP «Sovet Rynka», - 368 p.ISBN 978-5-4253-0343-1
[6] A. V. Mashkov Ekonomika kombinirovannogo proizvodstva teplovoy i elektricheskoy energii: uchebnoe posobie: M-vo obrazovaniya i nauki Rossiyskoy Federacii, Fil. federal'nogo gos. byudzhetnogo obrazovatel'nogo uchrezhdeniya vyssh. prof. obrazovaniya "Nac. issledovatel'skiy un-t "MEI" v g. Volzhskom, Kaf. "Teplovye elektricheskie stancii". - Volzhskiy: Fil. MEI v g. Volzhskom, 2012. – 125 s.; ISBN 978-5-94721-074-3
[7] Vaskov A. Structure and Parameter Optimization of Renewable-Based Hybrid Power Complexes /A. Vaskov, M. Tyagunov, T. Shestopalova, G. Deryugina, I. Ishchenko //Handbook of Research on Renewable Energy and Electric Resources for Sustainable Rural Development. /Ed. V. Kharchenko (Russia) and P. Vasant (Malaysia), - Hershey, Pennsylvania, IGI Global, 2018 P. 352-382
[8] Salomon D., Motta G. Handbook of data compression. – Springer Science & Business Media, 2010
[9] Pravila organizacii tekhnicheskogo obsluzhivaniya i remonta oborudovaniya, zdanij i sooruzhenij ehlektrostancij i setej. SO 34.04.181-2003.-M.: OAO «CKB Energoremont»
[10] Trukhanov V. M. Nadezhnost' v tekhnike. – 2-e izd., pererab. i dop. – M.: OOO Izdatel'skiy dom «Spektr», 2017. – 656 p. [11] Druzhinin G. V. Nadezhnost' sistem avtomatiki. – Izd. 2-e,
pererab. i dop. – M.: Energiya, 1967. – 528 p.
[12] Kozlov B. A., Ushakov I. A. Spravochnik po raschetu nadezhnosti apparatury radioelektroniki i avtomatiki. – M.: Sovetskoe radio, 1975. – 430 p.
[13] Kapur K., Lamberson L. Nadezhnost' i proektirovanie sistem: Per. s angl. / Pod red. I. A. Ushakova. – M.: Mir, 1980. – 604 p. [14] Truhanov V. M. Novyy podhod k obespecheniyu nadezhnosti slozhnyh sistem. – M.: Izdatel'skiy dom «Spektr», 2010. – 247 p.
[15] Truhanov V. M., Matveenko A. M. Nadezhnost' slozhnyh sistem na vsekh etapah zhiznennogo cikla.– M.: Izdatel'skij dom «Spektr», 2016. The 2nd issue.– 664 p.
[16] Sultanov M. M. Ocenka nadezhnosti, prodlenie resursa i optimizaciya remonta oborudovaniya TES i energeticheskih sistem: ucheb. posobie. – Volzhskiy: Filial FGBOU VO «NIU «MEI» v g Volzhskom, 2016. – 100 p.
[17] Andryushin A. V., ArakelyanE. K., Cykunova S. Yu., Chernyaev A. N. Nadezhnost' sistem upravleniya. Osnovy teorii nadezhnosti: Ucheb.posobie.- Publisher INE NNRU MePHI, 2017, 88p.