Dynamics of flow behind backward-facing step in a narrow channel
V. Uruba
Institute of Thermomechanics AS CR, v.v.i., Prague, Czech Republic
Abstract.The results and their analysis from experiments obtained by TR-PIV are presented on the model of backward-facing step in a narrow channel. The recirculation zone is studied in details. Mean structures are evaluated from fluctuating velocity fields. Then dynamics of the flow is characterized with help of POD (BOD) technique. Substantial differences in high energy dynamical structures behaviour within the back-flow region and further downstream behind the flow reattachment have been found.
1 Introduction
The backward-facing step flow has been established a benchmark configuration for separated flow studies in fluid mechanics. The problem is considered as 2D or quasi 2D very often, when the domain width is order of magnitudes bigger than the step height. The presented paper deals with fully 3D case characterized by narrow channel of width only 4 step heights. The Reynolds numbers are relatively high, order of 5 104 based on hydraulic diameter of the inlet channel and the bulk velocity just upstream the step edge.
Flow separation on the step edge is a source of pressure loss, vibrations, and noise and affects heat transfer, reattachment region corresponds to maximum heat transfer however low-heat transfer appears in separation region.
Backward-facing step configuration of a channel occurs in many engineering applications ranging from various fluidic elements, cooling of turbine blades, air-conditioning pipelines to many other devices. This flow belongs to the complex-flow family defined in the pioneering paper by Bradshaw in [1]. The flow over a backward-facing step is a very simple as to its basic geometry and boundary conditions, but the flow structure is extremely complex.
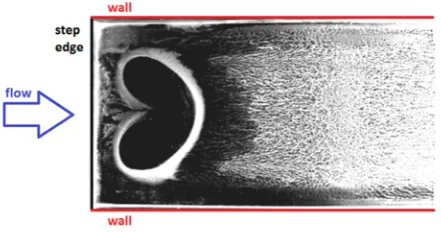
The flow-field in the recirculation region behind a step in narrow channel is described in [3]. Presence of a couple of nearly stable contra-rotating corner vortices is supposed, it is subjected to complicated spatial development downstream the step. The origin of vortices is secondary flow in the channel upstream the step. As a result near the channel bottom they form a kidney-shaped common footprint on the bottom wall behind the step. This situation has been confirmed by wall visualization on the channel bottom – see Figure 1.
Fig. 1. The footprint behind the step in a narrow channel with the backward-facing step.
However in the preparatory study [3] where mean flow field in the given configuration was studied using stereo PIV technique it was clearly shown that the secondary flow in corners is character of flow blockage without important vorticity in streamwise direction. The footprint behind the step is not connected with vortical structures, as formulated in older studies, but the low pressure generation close to the channel bottom in the recirculation region seems to be more relevant.
In the presented study the dynamics of flow in recirculation zone behind the step will be studied. Dynamical behaviour is to be considered as time deviations superimposed on the mean flow field.
2 Experiment
The study is based on experimental results. The techniques involving dynamical behaviour study are involved. To acquire the spatio-temporal data the stereo TR-PIV technique was chosen, it provides time series of velocity vectors in a measuring plane.
The experimental setup and measurement techniques and evaluation methods will be described in details.
2.1 Experimental setup
The existing blow-down test rig was modified for experiments with the separated flow in a channel with a backward facing step.
The tunnel has rectangular cross-section with filled corners (to suppress corner vortices), honeycomb and a system of damping screens followed by contraction with contraction ratio 16. The area of the test section input is 0.25 m in height and 0.1 m in width. The time mean velocity departures from homogeneity in planes perpendicular to the tunnel axis are of order tenth of percent with the exception of corners, where corner vortex starters could be detected. Height of the backward-facing step was 25 mm defining ratio 1 : 4 with the channel width. Reynolds number based on the hydraulic diameter of the inlet channel and volume velocity was about 5 104, while that based on step height was approximately 3.5 104. The back-facing step has been located very close to the channel inlet, conventional thickness of boundary layer at the step tip was approximately 0.003 m. The natural turbulence level was about 0.1% in the working section input. The channel downstream the backward facing step was 1 m in length.
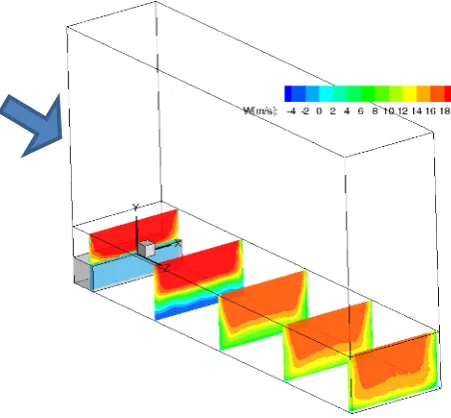
The situation is shown schematically in Figure 2 where Cartesian coordinate system is introduced.
Fig. 2. Channel with the backward-facing step.
In Figure 2 the size of the channel cross-section with the step is shown as well as the area of measurement. Measurements have been performed close to the channel bottom, the example distributions of the mean longitudinal velocity component W in z direction are shown. The flow is entering from the left over the step (in grey), the coordinate system has origin on the step edge in the middle of the channel. The z axis is oriented in the mean flow direction, x forming the step edge, y is perpendicular to the flow and to the step edge.
2.2 Measuring techniques
The time-resolved PIV method was used for the experiments.
The measuring system DANTEC consists of laser with cylindrical optics and two CCD cameras with Scheimpflug correction. The software Dynamics Studio 3.2 was used for velocity-fields evaluation. Laser New Wave Pegasus Nd:YLF, double head, wavelength 527 nm, maximal frequency 10 kHz, a shot energy is 10 mJ for 1 kHz (corresponding power 10 W per head). The cameras NanoSense MkIII with maximal resolution 1280 x 1024 pixels and corresponding maximal frequency 500 double-snaps per second. For the presented measurements the frequency 500 Hz and 1500 double-snaps in sequence corresponding to 3 s of record for mean evaluation was acquired in each measuring plane to obtain data for dynamical analysis.
Measurement planes (xy) are perpendicular to the mean flow representing by more than 30 planes with z in range 30, 400 mm. However, the measuring planes cover only part of the channel close to its bottom,
25,30
y and x 50,50 in mm. All 3 velocity components are evaluated in the measuring planes. Example results representing distributions of mean longitudinal velocity components are shown in Figure 2.
2.3 Evaluation methods
To evaluate the mean structures the classical ensemble averaging has been applied to time series.
To study the dynamics of spatial patterns in the flow the Proper Orthogonal Decomposition (hereinafter POD) and its extension Bi-Orthogonal Decomposition (hereinafter BOD) has been applied. The method allows decomposition of the spatio-temporal data into modes based on maximum kinetic energy content. Each mode consists of spatial part (Topos), temporal part (Chronos) and corresponding energy or amplitude. The modes are ordered according to energy in descending manner. Detailed description of the methods is given e.g. in [5].
3 Results
downstream the reattachment the plane distance is growing.
In Figure 2 distributions of W velocity component are shown in 5 planes along the inspected region, however all 3 velocity components have been evaluated.
The zone of measurements is shown in Figure 3, where position and shape of the kidney-shaped footprint on the bottom is depicted.
Fig. 3. Zone of measurement with kidney-shaped footprint.
3.1. Mean velocity field
Mean velocity field in the measuring zone was evaluated from measurements in all measuring planes. The velocity field was interpolated within the measuring zone to get the 3D picture of the mean flow, which was analysed in details.
In [4] the mean flow structure in the examined case was shown. The special attention has been paid to recirculation region between the step and flow reattachment close to the bottom. Reattachment line was detected 115 mm downstream the step corresponding to 4.6 step heights.
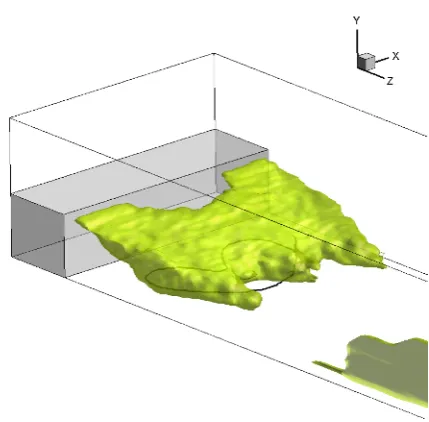
The results reveal intense rising flow just above the footprint forming trident shape of isosurface of positive vertical mean velocity, shown in Figure 4. In that region maximal negative longitudinal velocity component is detected indicating intense back-flow close to the bottom.
Fig. 4. Channel with kidney-shaped footprint with the high positive vertical velocity component region.
The high positive vertical velocity component region in trident shape was studied in details. The structure originates in corners on the top of the step forming two elongated structures, the third elongated structure arises in the middle of the channel.
The flow perpendicular to the wall generates a low pressure region close to the wall, resulting in wall shear distribution forming a kidney shape on the channel bottom.
The two sections perpendicular to the mean flow velocity were chosen for detailed study. The section 1 in
z = 54 mm is located within the recirculation zone, while the section 2 in z = 118 mm is located just downstream the point of the flow reattachment. The situation is shown in Figure 5.
Fig. 5. Measuring planes for dynamical analysis.
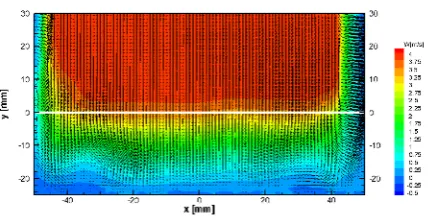
Presented information consists of three parts. In first part distribution of mean vectors is shown representing the two in-plane velocity components U, V, the third out-plane velocity component W is represented by colour – see Figure 6a and 7a for the sections 1 and 2 respectively.
Then in Figures 6b,c and 7b,c the distributions of longitudinal out-plane W and vertical V velocity components are shown in colours. The position of the step is demonstrated by white horizontal line on y = 0.
Fig. 6a. Mean velocity distribution in section 1.
Fig. 6b. Mean longitudinal velocity component W distribution in section 1.
Fig. 6c. Mean vertical velocity component V distribution in section 1.
The results for the section 1 suggest that there is strong back-flow regions located in the middle of step height on channel sides, about ¼ channel width from the wall. This region apparently coincides with maxima of vertical velocity component. Both vertical and longitudinal flow activity in terms of mean velocities is located entirely below the step edge level.
Fig. 7a. Mean velocity distribution in section 2.
Fig. 7b. Mean longitudinal velocity component W distribution in section 2.
Fig. 7c. Mean vertical velocity component V distribution in section 2.
The mean-flow in section 2 suggests no back flow, substantially blocked flow is seen behind the step on the bottom. However in vertical velocity component distribution it is clearly visible that negative vertical velocity is located on the step edge level and above it with extremes close to the walls, about 15 mm from them.
3.2 Dynamics
relevant. Both spatial (Toposes) and temporal (Chronoses) modes are to be shown.
The section 1 located within the back-flow zone is characterized by dominant dynamical activity located in the step height vertical position, as could be seen in Figures 8a and 8b. The modes 1 and 2 shown in figures represent 7.6 and 5.9 % of total kinetic energy respectively – see Figure 8.
Fig. 8a. Topos mode 1 in section 1.
Fig. 8b. Topos mode 2 in section 1.
Fig. 8c. Chronoses 1 and 2 in section 1.
Apparently, the modes 1 and 2 form quasi-periodical behaviour with typical frequency of about 80 Hz. The mode 1 is delayed by a quarter of period with regards to the mode 2.
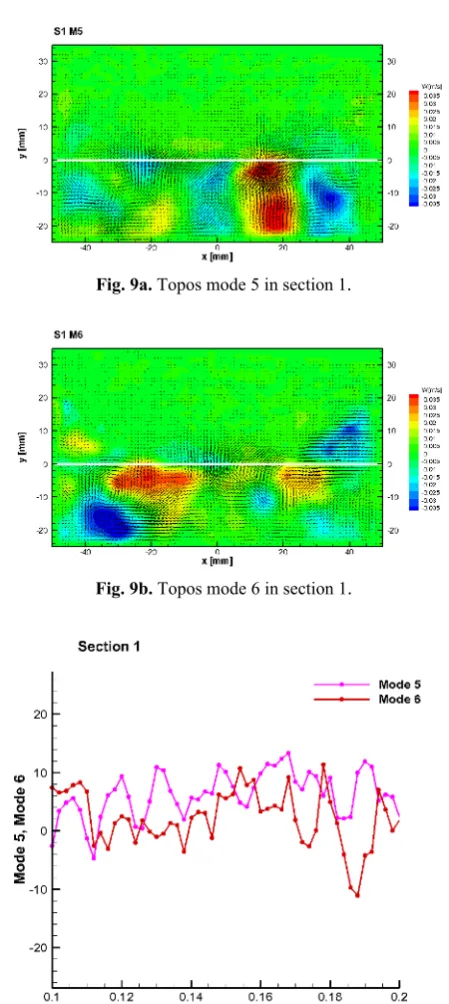
The higher order modes are characterized by dynamical activity in whole region below the step edge. No periodicity is visible in dynamic of higher modes. As an example see the modes 5 and 6 in Figures 9a, 9b and 9c, energy content is 3.7 and 3.2 % respectively.
Fig. 9a. Topos mode 5 in section 1.
Fig. 9b. Topos mode 6 in section 1.
Fig. 9c. Chronoses 5 and 6 in section 1.
The higher mode orders the more complex structures. As an example see the mode 30 in Figure 10 containing 0.7 % of the total kinetic energy.
Fig. 10a. Topos mode 30 in section 1.
Fig. 10b. Chronos 30 in section 1.
The dynamics of the velocity field in section 2 exhibits more regular behaviour, which is limited to the region below the step edge. The dynamical structure consists of big vortices and low/high velocity streaks, oriented in longitudinal z direction.
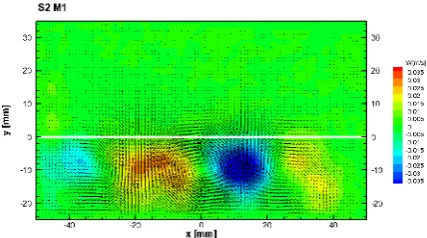
The most energetic modes 1 and 2 covering 6.0 and 5.7 % of total energy respectively are characterized by system of vortices of the same size as the step height. Toposes in Figures 11a and 11b contain 3 and 4 such vortices distributed regularly along the channel width. Between the vortical structures the low and high velocity streaks are located alternatively.
Fig. 11a. Topos mode 1 in section 2.
Fig. 11a. Topos mode 2 in section 2.
Fig. 11c. Chronoses 1 and 2 in section 2.
The modes 1 and 2 evolution in time in Figure 11c shows no periodicity, but the series are similar for the two modes. That indicates close connection between the modes 1 and 2.
The higher order modes show similar behaviour, only energy is lower and structures are smaller. As an example see Figures 11a-c. Toposes and Chronoses of modes 5 and 6 are presented with energy 2.8 and 2.7 % of total kinetic energy respectively.
Fig. 12b. Topos mode 6 in section 2.
Fig. 12c. Chronoses 5 and 6 in section 2.
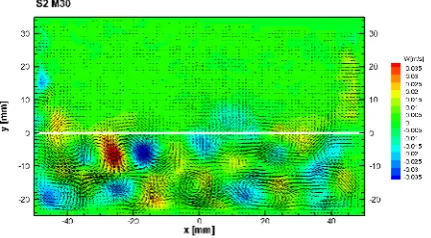
For high order modes the structures are even smaller with high number, but the character is maintained. In Figure 13 the mode 30 is shown with energy fraction of about 0.7 %.
Fig. 13a. Topos mode 30 in section 2.
Fig. 13b. Chronos 30 in section 2.
Strong randomness both in spatial and temporal domains is distinct.
Comparing the sections 1 and 2 as for the dynamics, we could conclude, that the dynamics within the recirculation zone (section 1) is concentrated in height of the step edge and it is governed by strong periodical behaviour. The corresponding Strouhal number value based on fluctuation frequency, mean velocity upstream the step and step height could be estimated on about 0.4. Higher, low energy modes are of random nature both in time and space.
Downstream the flow reattachment (section 2) we could observe distinct longitudinal structures, vortices and low/high velocity streaks filling the space below the step edge level. High energy structures are pretty regular in space, while their time behaviour is more or less random.
The connection of flow dynamics with rising fluid forming trident structure as well as the kidney shaped region on the channel bottom is not evident.
4 Conclusions
Dynamic of structures in the flow behind a step in a narrow channel were shown and studied. Results in two cross-sections are shown in details, the first section is located within the separation zone with back-flow, while the second section is downstream the flow reattachment.
Acknowledgement
This work was supported by the Grant Agency of the Czech Republic, projects Nos. 101/08/1112 and P101/10/1230.
References
1. P. Bradshaw, I.C.AeroRep., 71–73 (1971)
2. V. Uruba, P. Jonáš, Proceedings of GAMM Conference, Darmstadt, (2012)
3. V. Uruba, P. Jonáš, O. Mazur, International Journal of Heat and Fluid Flow, 28, 4, 665–672 (2007) 4. V. Uruba, 31. Setkání kateder mechaniky tekutin a
termodynamiky, Mikulov, June 26–28, 237-240
(2012)