341
Analysis Of Soil NPK, Ph And Electrical
Conductivity At Adham Area- Renk, Upper Nile
State
Abubaker Haroun Mohamed Adam, Ismail Mohamed Fangama Abdalla, Mohammed Abdelkreim, Gammareldain, A. Ibrahim
ABSTRACT: The objectives of this study were to investigate soil type, potentiality and reaction in relation to the scattered remaining vegetation species, and to quantify soil suitability for growing field crops. Adham area witnessed serious land degradation due to the rapid expansion of Rain-fed Mechanized Farming and overgrazing. Consequently, the low crop yield enforced the local communities to shift to the alternative sources of income generating activities, particularly those related to forest products like charcoal making, firewood production, logging and tree lobbing. By using Randomized Complete Block Design (RCBD), with emphasizes on Macro nutrients, particularly the Nitrogen, Phosphorous and potassium (NPK) in addition to soil pH and Electrical Conductivity (EC.), random soil samples, each with three levels of depths (0 - 15, 15 - 30, 30 - 45 cm.) were collected. All collected data were analyzed in the laboratory. The result of revealed several types of soils including the cracking and non -cracking clay, sandy, and red soils. The result of statistical analysis depicted variability in NPK, pH and EC between the different locations and soil depths. Furthermore, the result showed an association between some studied soil attributes and the spatial distribution of the vegetation species. Rational use through participatory approach is recommended for natural resources management, conservation and sustainability. Moreover, further study using space technology also recommended.
Key words: Electrical conductivity,soil pH,nitrogen, phosphorous and potassium.
————————————————————
Introduction:
Soil of Adham area is a part of the central clay plain in Sudan. It is derived mainly from the highly weathered basic igneous rocks of the Ethiopian highlands under more humid conditions, then transported by the Blue Nile, and deposited in hotter environment which was prevailing at that time (Devos, et al., 1965). The underlying basic igneous rocks are associated in some part with consolidated sedimentary rocks of Um Rawaba series. While the cracking clay soil was developed on these transported sediments. Yellowish coarse textured soils, locally known as "Azaza" (in-situ); are probably developed from locally weathered granitic rocks in place, and alternatively in situation formation is possible (Hashim, 1972). However, Harrison and Jackson, (1958) described the soil of the study area as dark cracking clay, alluvial in origin, transported by the Blue Nile. Moreover, Van Noordwijk (1984), explained that this dark cracking clays soil known as ―black cotton soils‖, are found in floodplains, deposited by the Blue Nile and its tributaries, and some have been formed by the indigenous basalt rock formations.
The main features characterizing the soil of this area are: wide deep cracking, when dried out, and seal off when wetted, and their surfaces become impermeable. Therefore, flooding occurs during the rainy season. However, study carried out by the Department of soil survey, Wad Medani (1972), identified two groups of soils, the dark clay, of order vertisol, family Montomornlite, featured by non calcareous, with low nitrogen, organic matter and Cation Exchangeable Capacity (CEC), but with adequate potassium and phosphate content. On the other hand, the Azaza, is characterized by poor nutrient content (FAO, 1998), stated that land plays an important role in the biogeochemical cycles within the ecosystem and globally. In order to meet the demand for ever increasing world population, it is vital to comprehend the complexity nature of land-use and its impact on the land, and the earth system functions at global scale (Lambin, et al., 2001). It is well known that the human activities have directly or indirect effect on natural environment. These in turn have either constructive or destructive impacts on environmental settings, at both local and global scales, among these the global warming (Lambin, et al., 2003).. On the other hand, major processes which induce changes such as land-conversions, land-modifications, deforestation or agricultural intensification have been playing critical roles in the change of vegetation-cover (Verburg, et al., 2009; Bolin, et al., 2002). However, since the human is the center for development, therefore, at present time; it became crucial to orient research to integrate the social and natural science to examine the human-environment relations in order have strategic plans for development projects which take into consideration the environmental elements (Kienas, et al., 2009). However, the soil study intended to investigate the Macro nutrients, especially the Nitrogen, Phosphorous and potassium (NPK) in addition to soil PH (a measure of the acidity or basicity in soils. The pH is defined as the negative logarithm (base 10) of the activity of hydrogen ions (H+) in solution.It ranges from 0 to 14, with 7 being neutral. A pH below 7 is acidic and above 7 is basic. Soil pH is considered a master variable in soils as it controls many chemical processes that take place. It specifically affects plant nutrient availability by controlling the chemical forms of the nutrient. The optimum pH range for ______________________
Abubaker Haroun Mohamed Adam, Ismail Mohamed Fangama Abdalla, Mohammed Abdelkreim, Gammareldain, A. Ibrahim
Department of Crop Science, College of Agriculture, University of Bahri
College of Forestry and Range Science, Sudan University of Science and Technology (SUST) Khartoum Sudan.
342 most plants is between 6 and 7.5, however many plants have
adapted to thrive at pH values outside this range. And EC. (Electrical Conductivity). Usually, the EC of a soil extract is used to estimate the level of soluble salts.
Problem
In the name of food security, wide and massive vegetation cover devastation, through trees removal without replacement was practiced to establish commercial, wide scale rain-fed mechanized farming along with overgrazing and tree lobbing in Adham area. These activities lead to disintegration of natural resources including the soil which became vulnerable to degradation. Consequently, the continuous yield decline became a general phenomenon. Therefore; the communities became less depending on agriculture as main source of income. They shifted to other quick income generating activities related to forests. This shift has aggravated the situation of natural resources in this area. Therefore it is important carryout this study can avail fresh, accurate and reliable data and information to enable planners and decision to take the right decisions.
Objectives
The main objectives are to investigate soil type, potentiality and their association with the types and distribution of the existing plant species and to determine a suitable cropping pattern.
Methodology
Soil sampling and analysis
Soil samples were taken with the help of Auger. Each sample with three levels (0 - 15, 15 - 30, 30 - 45 cm deep). All samples were transferred to paper bags. The samples were analyzed in the laboratory of the Environmental and Natural Resources Research Institute (ENRRI) Khartoum - Sudan.
Nitrogen (N) determination in the laboratory according to John Kjeldahl (1883) method:
- Sample pre-treatment: It is necessary that all samples to be pretreated to comply with the standard in the field of soil. Care was taken during the digestion so that not to loss amount of nitrogen, thus, the temperature was less than 400°C.
The procedure: Firstly, the homogeneity of the laboratory sample as well as the test sample was guaranteed.
Digestion: Dried and grinded sample portion of 0.2 gram (expected nitrogen content equal to 0.5%) to one gram (expected nitrogen content approximately 0.1%) was used. When 10 ml sulfuric acid (4.2) was added, swirled until the acid was thoroughly mixed with the sample. The mixture was allowed to stand for cooling. Then 2,5 g of the catalyst mixture 4.3 was added and heated till the digestion mixture became clear. The mixture was boiled gently for 5 hours to allow the sulfuric acid condenses about 1/3 to the end of the tube. The temperature of the solution was maintained below 400 °C.
Titration: After digestion was completed, the tube was left to cool; and 20 ml of water was added with slowly
shaking. Then the suspension was transfer to the distillation apparatus 5.4. When; 5 ml of boric acid 4.5 was added to a 200 ml conical flask and placed under the condenser of the distillation apparatus in such a way that the end of the condenser dips into the solution. Then 20 ml of sodium hydroxide 4.4 was added to the funnel of the apparatus and ran the alkali slowly into the distillation chamber. Thereafter, about 100 ml of condensate was distilled, rinse the end of the condenser, then few drops of mixed indicator 4.6 were added to the distillated and titrated with sulfuric acid 4.7 to a violet endpoint. Steam distillation was used. Distillation was stopped when 100 ml of distillation was collected.
Calibration: Calibration substances with known and unchangeable content of nitrogen were used to control the digestion and the apparatus. Sulfanil acid with known nitrogen content was used. Besides these substances certified reference materials were used too to control the whole procedure
Blank determination: Two blank determinations were carried out in each series and the average blank value was used for subsequent calculations.
Quality Assurance of the overall procedure:
Duplicate determination: From the submitted sample for analysis, two sub-samples were tested. Control limit for differences between the results of the tow sub sample was established, and precision was determined.
Expression of results: Method of calculation:
The content of nitrogen, (wN), in milligrams per gram was calculated using the formula:
wN = (V1 – V0) x c (H+) x MN x 100
m x mt
Where:
V1 is the volume in millimeters of sulfuric acid (4.7) used in the titration of the sample.
V0 is the volume in milliliters, of the sulfuric acid (4.7) used in the titration of the blank test
c (H+) is the concentration of H+ in the sulfuric acid (4.7) in moles per liter ( e.g. if 0.01 mol/l sulfuric acid is used, c(H+) = 0.02 mol/l).
MN is the molar mass of nitrogen in grams per mole (=14) m is the mass of test sample
mt is the dry residue, expressed as g/100g on the basis of oven dried
Determination of Phosphorous in the laboratory To extract Phosphorus, well shaked 1 g of air dried soil in 10 mL of 0.025 M HCl and 0.03 M NH4F for 5 minutes
was prepared. Phosphorus was determined on the filtrate by the molybdate-blue method using ascorbic acid as a reluctant. Color development was measured at 880 nm on a Brinkmann PC 800 probe colorimeter.
343 0
0.02 0.04 0.06 0.08 0.1 0.12 0.14
A B C D E F G H I
Location
0-15 cm 15-30 cm 30-45 cm
with a 1 gram scoop of soil and shaken for 5 minutes. The exchangeable potassium was measured by analyzing the filtered extract on an atomic absorption spectrophotometer set on emission mode at 776 mm. The results were reported as parts per million (ppm) of potassium (K) in the soil. Soil sample of 20 gm was well shaken with 40 ml of distilled water in a 250 ml conical flask for an hour. Then conductivity of the supernatant (saturation extract of soil) liquid was determined with the help of conductivity meter.
Determination of pH in the laboratory: pH was determined on a 1:1 (V/V) soil/water mixture (5 g NCR-13 soil scoop/5 mL DI water). Samples were stirred both
prior and after a 15 minute equilibration period. Then pH was measured on a Beckman pH meter with glass and calomel reference electrodes calibrated to buffers pH 4 and 7.
Results and Discussion
Nitrogen (N)
The study identified different types of soils in the study area, including the cracking and non cracking clay, sandy, and red soil (Fig, 5, 6, 7). Each of these different types of soils favors the growth of certain plant ecotype.
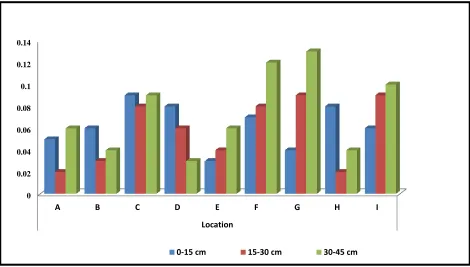
Fig. 1: Average Nitrogen content at three depths of soil in different locations and soil types – Adham area (2012).
Comparing the result of the data analysis of nitrogen content in the 8 locations, showed significant (P≥ 0.05) differences between and within the groups. Where the clay soil revealed higher content of nitrogen followed by the red and sandy soils respectively. The clay soil showed more nitrogen content at soil sub-surface (30-45 cm) compared to soil surfaces (0-15 cm) and soil subsurface (15- 30 cm) which reflected the lowest nitrogen content.
Phosphorous (P)
Table 1: Multi-comparison analysis of Phosphorous (P) at three levels of depth of soils by Post HocTest (2012).
(I) Groups (J) Groups
Mean Difference
(I-J) Std. Error Sig.
95% Confidence Interval
Lower Bound Upper Bound
0-15 cm 15-30 cm .01778 .10403 .866 -.1969- .2325
30-45 cm -.03111- .10403 .767 -.2458- .1836
15-30 cm 0-15 cm -.01778- .10403 .866 -.2325- .1969
30-45 cm -.04889- .10403 .643 -.2636- .1658
30-45 cm 0-15 cm .03111 .10403 .767 -.1836- .2458
15-30 cm .04889 .10403 .643 -.1658- .2636
344 other types of soils, and decreases with the increasing soil depth. For other types of soils, there are non-significant (P ≥ 0.05) differences at all soil depths.
Potassium (K).
Table 2:Multi-comparison analysis-Potassium in three levels of soil depth in different soil and locations Adham area (2012)
(I) group (J) group Mean Difference(I-J) Std. Error Sig. 95% Confidence Interval
Lower Bound Upper Bound
0-15 cm 15-30 cm .19333 .22615 .401 -.2734 .6601
30-45 cm .39778 .22615 .091 -.0690 .8645
15-30 cm 0-15 cm -.19333 .22615 .401 -.6601 .2734
30-45 cm .20444 .22615 .375 -.2623 .6712
30-45 cm 0-15 cm -.39778 .22615 .091 -.8645 .0690
15-30 cm -.20444 .22615 .375 -.6712 .2623
From the Table (2), the analysis revealed non- significant (P ≤ 0.05) differences in Potassium content in all locations at soil depths of 0-15, 15- 30 and 30-45 cm.
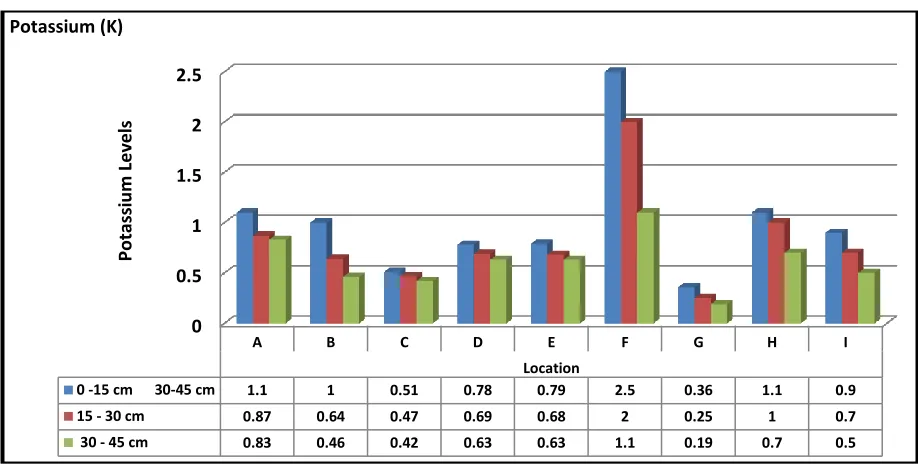
Fig.2: Average Potassium levels at different depths & soil locations -Adham area (2012)
Considering the table 2, the study showed that the nitrogen content in all locations under study is not so high. This result agrees with the result obtained by Soil Research Centre – Wad Medani in 1972. The clay soil has higher potassium content at all levels of depths compared to other soils, followed by the red and sandy soils respectively.
0 0.5 1 1.5 2 2.5
A B C D E F G H I
Location
0 -15 cm 30-45 cm 1.1 1 0.51 0.78 0.79 2.5 0.36 1.1 0.9
15 - 30 cm 0.87 0.64 0.47 0.69 0.68 2 0.25 1 0.7
30 - 45 cm 0.83 0.46 0.42 0.63 0.63 1.1 0.19 0.7 0.5
Pot
assi
u
m
Le
ve
ls
345 0
0.05 0.1 0.15 0.2 0.25 0.3
1 2 3 4 5 6 7 8 9
Sample Level 0-15 cm 0.05 0.049 0.041 0.041 0.029 0.1 0.21 0.049 0.089
Sample Level 15-30 cm 0.03 0.028 0.039 0.039 0.018 0.09 0.19 0.036 0.065
Sample Level 30 - 45 cm 0.02 0.023 0.3 0.03 0.013 0.06 0.18 0.025 0.046
EC
ds
/m
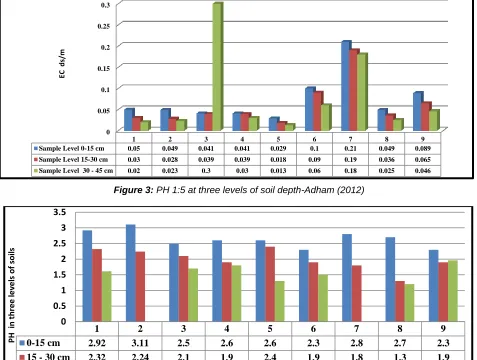
Figure 3: PH 1:5 at three levels of soil depth-Adham (2012)
The pH of clay soil is higher than red and clay soils at all depths and locations. This means clay soil tends to acidity more than any other types of soils. This may be due to greater content of Sodium (Na) in clay soils.
Fig 4: EC in three levels of soil depth-Adham (2012)
Fig. 4: The result reflected that the clay soil has higher Electrical Conductivity (EC) at all levels of depths and locations compared to red and clay soils.
1 2 3 4 5 6 7 8 9
0-15 cm 2.92 3.11 2.5 2.6 2.6 2.3 2.8 2.7 2.3
15 - 30 cm 2.32 2.24 2.1 1.9 2.4 1.9 1.8 1.3 1.9
30 - 45 cm 1.61 0 1.7 1.8 1.3 1.5 0 1.2 1.96
0 0.5 1 1.5 2 2.5 3 3.5
PH
i
n
th
re
e
le
ve
ls
o
f so
346 pH and EC
The study showed that the pH value in Adham area is moderate, ranging between 5.7-6.85, While the EC value ranges between 0.1-0.2 ds/m (Fig 3,4 and5). In general, the study showed that the nitrogen content in all locations under study is not so high. This result agrees with the result obtained by Soil Research Centre – Wad Medani in 1972. The multiple - comparisons of the soils from different locations showed some differences.
Spatial distributions of Vegetation cover:
In the clay soil; particularly the non degraded clay, the dominant plant species are Acaia spp. Avena fatua (Hamaraia), Cadaba rotundifolia, Balanites aegyptiaca (Heglej), Avena fatua (Hamaraia, Rottboellia exaltata (Um Balila), Copparis decdua (tontub), Grewia tenax (Gedeem). In the red soils the following plant species are the dominant: Sesamum alahtumm (Simsim Jemal), Cenchrus biflorus (Haskaneet), Sorghum purpureosericeum, Dalbergia melanoxyion (Abanos) Cordia africana (Andrab) Leptadenia byrotechnica (Merikh) Cobretum glutinosum (Habeel) Albizia sericocephala (Arrad) Angogeissus leicarppus (Sahab) Lannea fruticosa (Leyoon). While in the sandy sol, the dominant plant species are: Abutilon figarianum [(Gargadan(teckoya)], Boscia senegalensis (Mekheet), Acacia senegal (Hashab), Acacia seyal, Grewia tenax (Gedeem), Echinopogon colonom (Difra), Avena fatua (Hamaraia), Cenchrus biflorus (Haskaneet) Sorghum purpureosericeum.
Cultivation in relation to soil type:
There is no an ideal type of soil for all crops. This is clear from the spatial distribution of vegetation cover. However, most grown crops vary in their requirements for fertility. Accordingly, for clay soil, sorghum, sunflower and cotton are suitable crops. For sandy soil, and red soils groundnut, sesame and millet
Conclusion
The irrational anthropogenic activities have upset the environmental settings. Consequently, the socio-economic status of the communities has been negatively influenced. The study identified three types of soil in the study area, namely, the clay, sand and red soils. The results of data analysis of the macro nutrients, especially the NPK , soil pH and the EC showed variations between and within the locations and variability at different soil depths in all locations. It is observed that, the spatial distribution of the vegetation cover followed soil type and, fertility and rainfall distribution pattern. However, based on soil and nutrient variability, a suitable cropping pattern was purposed.
Recommendations:
The research has come up with the following:
1. Increase the awareness of the communities on issuon related to natural resources conservation and sustainability.
2. The communities should take active part in policy, rule and legislation formulation, mplementation and evaluation of the development projects.
3. Introduction of sutable cropping pattern and fallow course system.
4. Further research is highly recommended using high resolution space technology.
347 Fig.6: Sandy soil-Adham area (2012)
Fig. 7: Red soil –Adham area (2012)
References
[1] Bolin B, Sukumar RP, Ciais W, et al..(2002): Global perspective. In: Watson RT, Noble IR, Bolin B, et al. (Eds). IPCC, land use, land-use change, and forestry. A special report of the IPCC. Cambridge, UK: Cambridge University Press.
[2] Department of Soil Suevey (1972) Wad Medani,Sudan.
[3] Devos,J.H., and Vergo,K. J. (1965). Soil Structure in Vertisols of the Blue Nile clay plain of Sudan J. soil sce, 189,200.
[4] FAO (1998). Dimensions: Environment, Geo-information, Monitoring and Assessment, Sustainable development (SD), Food and Agriculture Organization of the United Nations
[5] Harreson,M.N. and Jackson,J.K. (1958).The Ecological classification of vegetation of the Sudan.Oxford press.Oxford,UK
[6] Hashim, Ali Dawood (1972). Reconnissance semi-detailed soil survey-Goz-oum-Renk-Upper Nile Province. Soil Survey Department, Wad Medani,Sudan-August,1972.
[7] Lamb, H. (2001): Holocene climatic change and vegetation response inferred from the sediments of Ethiopian crater lakes. The Royal Irish Academy 101.
[8] Lambin EF, Geist HJ, Lepers E (2003): Dynamics of land-use and land-cover change in tropical regions. Ann Rev Environ Resour 28:205–241
[9] Noordwijk, Van, M. (1984). Ecology textbook for the Sudan, Khartoum University Press, Khartoum, Sudan/
[10]Kienast, F., Bolliger, J., Potschin, M., de Groot, R.S., Verburg, P.H., Heller, I., Wascher, D., Haines-Young, R.H., (2009): Assessing landscape functions with broad-scale environmental data: insights gained from a prototype development for Europe. Environmental Management 44, 1099– 1120.