IJEDR2001046 International Journal of Engineering Development and Research (www.ijedr.org) 242
Model Based Site Suitability Analysis for Solid
Waste Management - A case study of Hoshiarpur
city, Punjab.
1Kanwar Deepak, 2Dr. Dheera Kalota 1Associate Professor and Head, 2Assistant Professor
1DAV College, Jalandhar, 2Lovely Professional University
_____________________________________________________________________________________________________
Abstract - Proper handling of solid waste at an appropriate site largely controls the landscape and health of urban environment. Most of the third world countries including India face the challenge of solid waste management at an appropriate site. All urban places manage solid waste at some site. But do these sites address all the factors that need to be considered before solid waste management. The present study attempts to find suitable locations for solid waste management of Hoshiarpur city of Punjab state. This city lies in plain area of bist doab region of Punjab state but this city is not far from the Shiwalik hills lying to the east. A model is applied to find suitable sites for solid waste management. Techniques of Remote Sensing and GIS (Geographic Information System) make this task easy and impeccable. The model includes several components and all of which are analyzed and processed in ArcMap. A total of nine variables are being considered which include landcover, soil drainage, groundwater level, distance from city, distance from canals, slope, distance from drains, distance from settlements and distance from roads. Buffering is done for several variables and then all data is converted into raster format. It is followed by assigning of influence and weights to all the variables and their subclasses which is based on Delphi method. Then the tool of weighted overlay analysis is run to find suitable areas in a raster format. These suitable areas are viewed in Google Earth to propose sites for solid waste management. After validation three sites are finalized where solid waste of Hoshiarpur city can be managed.
keywords - Model, Weighted Overlay Analysis, Remote Sensing, GIS, Raster, Buffers.
_____________________________________________________________________________________________________
INTRODUCTION
Solid waste has a major share in the environmental pollution specially in the urban places. The situation worsens when it is not managed at an appropriate site. Growing population and changing lifestyle of people are adding to the generation of solid waste. When solid waste is handled at a suitable site it amounts to abatement of environmental pollution. Technology of Remote Sensing and GIS (Geographic Information System) can play big role in finding a suitable site for solid waste management. A similar attempt has been made by J. Pradhan and K. Samanta (2014) for Rajarghat Gopalpur area of Kolkata and another by P.N. Karthiheyan and L. Yeshoda (2016) for Krishnagiri area of Tamil Nadu. Present study attempts to identify a site to manage solid waste of Hoshiarpur city using remote sensing and GIS techniques.
STUDY AREA
The Hoshiarpur city lies in the northeaster part of Punjab state from where the Shiwalik hills and state boundary of Himachal Pradesh are not far. Area in and around Hoshiarpur city is flat and gently sloping westward but Shiwalik hills are close to the city boundary. The area is marked with several seasonal streams locally known as ‘choes’. The city is not big in terms of size as well as population. According to Census 2011 the city of Hoshiarpur recorded a total population of 1,68,653 with decadal growth rate of 11.25%. Proximity to hills and forest cover, the climate of Hoshiarpur remains mild. Several check dams constructed on the choes raise the water surface area and make the summers pleasant.
Study area for this study has been marked by making a buffer of 10 km around the city. That means the study area begins from the outer boundary of city upto a distance of 10 km in all directions. When a buffer of 10 km is marked around the Hoshiarpur city, an area of 576 sq km is generated where suitable sites can be found. A fractional part of 0.97 sq km of area is omitted because it falls in the adjoining Jalandhar District.
CURRENT STATUS
Solid waste is transported manually and dumped in an unscientific way at various locations. Such unhygienic conditions pollute the environment and make the scenario inhabitable. Everyday around 70 tons of solid waste is generated in the city. The municipal corporation handles this waste with 384 workers at a site called ‘piplanwala’ besides ‘bhangi choe’ and some other smaller locations. Heaps of solid waste can be spotted at several places of the city and situation further deteriorates in rainy season (Master Plan of Local Planning Area, Hoshiarpur, 2010-31).
MATERIAL AND METHODOLOGY
IJEDR2001046 International Journal of Engineering Development and Research (www.ijedr.org) 244 MODEL OF SITE IDENTIFICATION FOR SOLID WASTE MANAGEMENT
The present study is based on the model which is applied on this study area and can also applied in other locations having similar features specially the terrain. The model has been designed by the authors of this study and named as “Deepak-Kalota model of site identification for solid waste management”. Since every model is a set of several variables, this model too depicts a list of its variable components which include landuse landcover, soil drainage, groundwater level, distance from city, distance from canal, distance from drains, distance from settlements, slope and distance from roads. This is the first step of model where variables are selected. It requires the comprehensive know-how of the study area. Besides inferences are also drawn by perusing through similar studies like that of Kakinada city by A. Dharnikota (2013) and of Gwalior by M. Sharma et al. (2015). In the second stage of model the moderator components are designed in which spatial datasets of all the variables are edited for analysis. Purpose of this stage of model is to divide the entire study
S. no.
VARIABLES PERCENTAGE OF
INFLUENCE
SUBCLASSES SCALE VALUE
(0-5)
1 Landuse Landcover 22 Cultivated 5
Industry 3
Plantation 2
Villages 0
2 Soil Drainage 18 D4 (moderately well
drained)
5
D5 (well drained) 4
D7 (excessively drained) 2
3 Groundwater Level 12 2-5 mbgl 2
5-10 mbgl 3
10-20 mbgl 4
20-30 mbgl 5
4 Distance from city 12 0-2 km 1
2-4 km 2
4-6 km 3
6-8 km 4
8-10 km 5
5 Distance from canals 10 0 - 250 m 1
250-500 m 2
500-750 m 3
750-1000 m 4
> 1000 m 5
6 Distance from drains 8 0 - 250 m 1
250-500 m 2
500-750 m 3
750-1000 m 4
> 1000 m 5
7 Distance from
settlements
8 0 - 500 m 1
> 500 m 5
8 Slope 7 0-10 degree 5
10-20 degree 4
20-30 degree 3
30-40 degree 2
>40 degree 1
9 Distance from roads 3 0-100 m 5
100-200 m 4
200-300 m 3
300-400 m 2
> 400 m 1
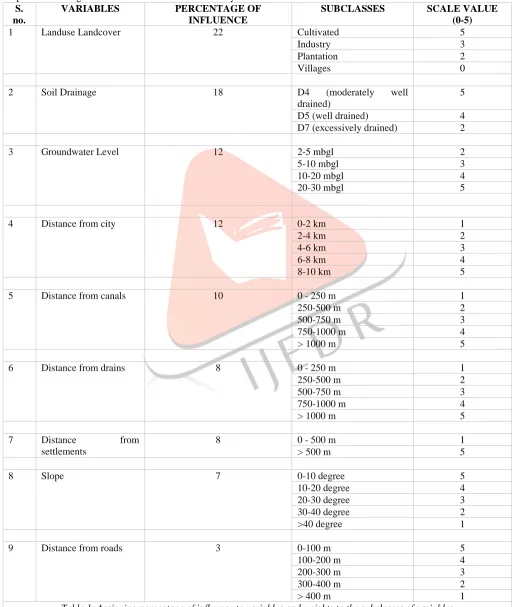
IJEDR2001046 International Journal of Engineering Development and Research (www.ijedr.org) 245 area on the basis of influence of each variable. After editing, the spatial datasets of all variables are converted into raster format. This is required because in raster format the spatial data takes the shape of matrix of cells and each cell is assigned a value on the basis of influence. Since slope data is already in raster format therefore it is not required to be converted. All factors do not influence site identification uniformly. Some factors influence more and others less. This model quantifies the influence of each factor and calculates the suitability process. Moreover it is prerequisite of the tool of ‘weighted overlay analysis’ which is run in the next stage. In this study several experts are also involved to assign the percentage of influence (in %) to all variables and weights (on scale of 1-5) to the subclasses of each variable. One more value of ‘R’ is also assigned to some of the subclasses which means ‘restricted’ or which is not to be considered for site suitability. The experts involved in assigning influence and weights include administrators, academicians, scientists of remote sensing and GIS (Geographic Information System). Influence and weights are assigned as per the table 1. In the last stage of model the tool of weighted overlay analysis is run to find the suitable areas which are viewed in Google Earth to mark sites. All these sites are validated before finalizing.
IDENTIFYING THE SITE USING MODEL
When this model is applied to identify suitable site for solid waste management for the city of Hoshiarpur the following results are divulged:
IJEDR2001046 International Journal of Engineering Development and Research (www.ijedr.org) 246 plantations. This variable is assigned highest influence of 22%. In the absence of any waste land the cultivated land is assigned maximum weightage of 5 on 1-5 scale. Second variable of soil drainage is assigned 18% of influence. This variable controls the movement of water in soil and has three subclasses : D4 (moderately well drained), D5 (well drained) and D7 (excessively drained). In D7 subclass the movement of water or leachate from solid waste will be quick hence it is assigned least weightage. Highest weightage is assigned to D4 category in which the movement of water or leachate will be slowest hence it is least likely to pollute the subsoil and groundwater. Third variable of groundwater level is given 12% of influence. It has four subclasses i.e. 0-5 mbgl (meters below ground level), 5-10 mbgl, 10-20 mbgl and 20-30 mbgl. Among these the 20-30 mbgl subclass is assigned maximum weightage of 5 because in these areas the leachate from solid waste management is less likely to pollute the groundwater because of maximum depth.
IJEDR2001046 International Journal of Engineering Development and Research (www.ijedr.org) 247 Areas closer to canal are assigned lower weightage. Next variable of distance from drains is drawn with five subclasses i.e. 0-250 mt; 0-250-500 mt; 500-750 mt; 750-1000 mt and more than 1000 mt. This variable is assigned 8% influence. Its subclass of >1000 mt is also assigned maximum weightage of 5 because of its lesser chances of getting polluted from the site. Next, the variable of distance from settlements is drawn with two subclasses of 0-500 mt and >500 mt. It is assigned 8% influence. Its subclass of >500 mt is assigned maximum weightage of 5 so that human population is not affected by the pollution emanating from the site. The variable of slope is assigned 7% influence and it has five subclasses : 0-5 degrees, 5-10, 10-15, 15-20 and more than 20 degrees. Maximum weightage is assigned to the subclass of 0-10 degrees of slope because in flat areas the pollution from site is less likely to move. Areas with steeper slope are assigned lower weightage. Lastly, the variable of distance from roads is assigned only 3% influence because there are enough roads. The roads are required to transport solid waste from city to the site on daily basis. This variable has five subclasses i.e. 0-100 mt, 100-200 mt, 200-300 mt, 300-400 mt and more than 400 mt. The 0-100 mt subclass is assigned maximum weightage because of highest road proximity. Areas farther from roads are assigned lower weightage. After drawing of spatial datasets and requisite editing, these are converted into raster format. The spatial datasets of first three variables (landuse landcover, soil drainage and groundwater level) do not require any editing and are directly converted into raster datasets because these three variables have already divided the study area.
Once the raster conversion and assigning of influence to variables and weightage to subclasses of variables is over, the crucial step of ‘weighted overlay analysis’ is ready. When this tool is run, a new raster dataset is generated that categorized the study area on the basis of suitability into five subclasses i.e. 0,2,3,4 and 5. As the value increases the suitability also increases. Since areas with suitability score of 5 are the most suitable for site, these are converted into KML file. Likewise, spatial datasets of all nine variables are also converted into KML files to view in Google Earth. In Google Earth the most suitable areas are overlaid on each variable for manual verification of machine generated results and also to mark three sites within the suitable areas which are saved as KML files. At this stage features outside the study area also considered so that the sites should remain at sufficient distance from religious, military, archaeological areas and also away from highways and airport. Then these sites are converted into shape files to bring in GIS environment. In ArcMap these sites are viewed above every variable for validation. Incase sites on any variable are not validated some modifications in Delphi stage is done by altering the percentage of influence or weightage to the subclasses of variables. In that case the tool of weighted overlay analysis is run again and sites are once again marked in Google Earth. After validation the sites are finalized for solid waste management. Three sites are selected to give choice to the administration for solid waste management. Site 1 lies in the southwest near Arjam village; site 2 is situated in the western part of study area near Badala Mahi village and site 3 lies near Gagnuli village in the west. These sites satisfy all the variables and are finalized for solid waste management of Hoshiarpur city.
CONCLUSION
In the end it is summarized that model designed for site suitability has generated impressive and valid results. All the variables mentioned in the model affect the site identification process for solid waste management. Delphi method proved very helpful in the crucial step of assigning of influence and weights to all the factors and their subclasses. The ‘Weighted Overlay Analysis’ tool generated accurate and precise results in the process of site suitability. Further, the results are verified in Google Earth by overlaying suitable areas on all variables. Three sites give choice to the administration of Hoshiarpur city for locating site of solid waste management.
REFERENCES
[1] Census 2011. Punjab Urban/Rural Population. Retrieved from: https://www. census2011.co.in/census/state/punjab.html [2] Punjab Urban Planning and Development Authority. Master Plan Report, 2009-2031, Local Planning Area Hoshiarpur.
Government of Punjab. Retrieved from: https://www.puda.gov.in/?q=hoshiarpur-2009-2031-report
[3] Ministry of Environment, Forests and Climate change. Solid Waste Management Rules Revised After 16 Years. Announced on April, 05, 2016. Retrieved from: http://pib.nic.in/newsite/PrintRelease. aspx?relid=138591
[4] M. Sharma, P. Pani & S.N. Mohapatra. Urban solid waste disposal sitesuitability analysis using geospatial technology: a case study of Gwalior city, Madhya Pradesh, India.InternationalJournal of Environmental Sciences, 2015, 6, p.p. 352-367. [5] T. Nishanth, M.N. Prakash, & H. Vijith. Suitable site determination for urban solid waste disposal using GIS and Remote sensing techniques in Kottayam Municipality, India. International journal of geomatics and geosciences, 2010, 1, p.p. 197-210.
[6] S. Sunder Rajan, L. Yeshoda & S. Suresh Babu. RS and GIS based site suitability analysis for solid waste disposal in Hosur municipality of Krishnagiri district. International Journal of Innovative Research in science, engineering and technology, 2014, 3, p.p. 10618-10625.
[7] Punjab Remote Sensing Centre, Ludhiana. Punjab, Soils, 2013. Retrieved from: http://www.punenvis.nic.in/show_file.aspx?linkid=2-226951911.jpg