IJEDR1604142
International Journal of Engineering Development and Research (www.ijedr.org)947
Result Analysis of Voltage profile and Real Power
Losses in IEEE-9 Bus System Using FACTS Devices
with Different Loading Condition
1
Ketan Sakhaparia,
2Vinod Guna,
3Anoop Budhrani
Assistant professorElectrical Engineering Department, V.V.P Engineering College, Rajkot (Gujarat), India
________________________________________________________________________________________________________
Abstract - This paper contains the result analysis of voltage profile, real power losses in IEEE 9 Bus System Using FACTS
device like TCSC and SVC with different loading condition.. Voltage stability is the ability of a power system to maintain steady state voltages at all buses in the system under normal operating conditions and after being subjected to a disturbance. This paper present the analysis of voltage profile and real power losses improving by using TCSC and SVC in power system for IEEE standard 9 bus test system by using different types of loading to change the value of active and reactive power.
Keywords - Voltage Stability, FACTS Devices, TCSC, SVC, Voltage profile, Real power losses, Different loading condition.
________________________________________________________________________________________________________
I.INTRODUCTION
FACTS devices play a vital role in Power Generation and Transmission. It is very complex process, requiring the working of many components of the power system to maximize the output. One of the main components in transmission line is the reactive power in the system. Inductive type’s load which absorb the reactive power in the system.so It is required to compensate the voltage to deliver the active power through the lines. Loads like inductive loads and other loads require reactive power for their operation. To improve the performance of ac power systems, we need to control this reactive power in an efficient way and this is known as reactive power compensation which is efficiently controlled by using different FACTS controller.
Flexible AC Transmission Systems (FACTS) can provide benefits in increasing system transmission capacity and power flow control flexibility and speed. FACTS are basically power electronics equipment which is very useful for increasing transmission capacity in the power system and have capacity to control various parameters in transmission system. These types of devices can enhance the stability of power system and can support voltage with better controllability of their parameters such as impedance, current, phase angle and voltage. They have ability to control the voltage magnitude and phase angle at specified buses. FACTS devices consist Thyristor Controlled Series Reactor (TCSC), Static Var Compensator (SVC), Unified Power Flow Controller (UPFC), and Static Compensator (STATCOM). [1,2]
There are various types of FACTS devices such as in series, shunt, or a combination of both series and shunt. Basically static VAR compensator (SVC) and static synchronous compensator (STATCOM) are shunt connected fact devices whereas Thyristor Controlled Series Compensator (TCSC), Static Synchronous Series Compensator (SSSC) is series connected fact devices. FACTS controller improves the real power handling capacity, voltage profile of a line at a more economic cost than building other transmission line of the same as well as of higher capability. This paper focuses on SVC and TCSC FACTS controller. [3,4]
II. CHARACTERISTIC OF TCSC AND SVC
A. TCSC
A TCSC is a capacitive reactance compensator, which consists of a series capacitor bank shunted by a thyristor controlled reactor in order to provide a smoothly variable series capacitive reactance. TCSC is the type of series compensator. The structure of TCSC is capacitive bank and the thyrister controlled inductive brunch connected in parallel. The principle of TCSC is to compensate the transmission line in order to adjust the line impedance, increase load ability, and prevent the voltage collapse. [5]
IJEDR1604142
International Journal of Engineering Development and Research (www.ijedr.org)948
The characteristic of the TCSC depends on the relative reactance of the capacitor bank and thyristor branch. Even through a TCSC in the normal operating range in mainly capacitive, but it can also be used in an inductive mode. The power flow over a transmission line can be increased by controlled series compensation with minimum risk of sub synchronous resonance (SSR) TCSC is a second generation FACTS controller, which controls the impedance of the line in which it is connected by varying the firing angle of the thyristor. A TCSC module comprises a series fixed capacitor that is connected in parallel to a thyristor controlled reactor (TCR). A TCR includes a pair of anti-parallel thyristor that are connected in series with an inductor. In a TCSC, a metal oxide varistor (MOV) along with a bypass breaker is connected in parallel to the fixed capacitor for overvoltage protection. A complete compensation system may be made up of several of these modules.[6,19]B. SVC
The SVC uses conventional thyristor to achieve fast control of shunt-connected capacitors and reactors.The configuration the SVC is given in Fig. 2. It is a shunt-connected device composed of several modules built of a fixed capacitance in parallel with a thyristor controlled reactor. Each of these modules corresponds to a variable susceptance. The equivalent susceptance B
eq is determined by the firing angle α of the thyristors which is defined as the delay angle measured from the peak of the capacitor voltage to the firing instant.
Uses thyristor valves to rapidly add or remove shunt connected reactors and or capacitors often in co-ordination with mechanically controlled reactors and/or capacitors.
An SVC is typically made up of the following major components: 1. Coupling transformer
2. Thyristor valves 3. Reactors
4. Capacitors (often tuned for harmonic filtering) [7,19]
FIGURE.2 STRUCTURE OF SVC
FIGURE.3 SVC CONTROL SCHEME
III.TEST SYSTEM SIMULATION
This section will discuss about the test system that is used to analyze the work in purpose of studying the effect of TCSC and SVC in increasing the voltage stability of the system and its optimal location. IEEE 9 bus system is use in the project simulation and it is done by using Power System Analysi s Toolbox (PSAT). Several steps have been achieved the objectives, the step that had been recognized were:
(a) Modeling the system by using PSAT (b) Perform the congested case.
(c) Perform the power flow analysis to analyze the Performance of the system.
(d) Perform the CPF and draw PV curve to determine weak bus of the system. SVC is placed at this bus. (e) Identify the suitable line to place TCSC so it gives optimal Performance.[8,9]
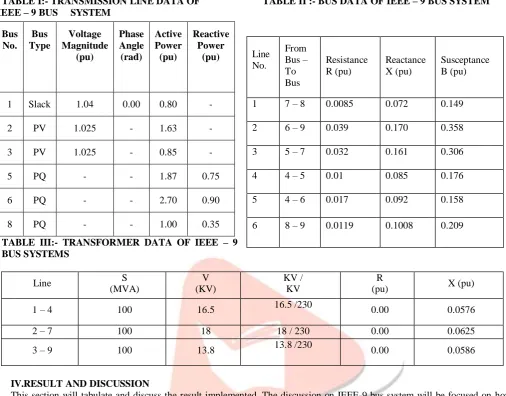
Simulation model of IEEE 9 bus system is shown in Figure 4, while the data of test system is shown in Table I to Table III.
IJEDR1604142
International Journal of Engineering Development and Research (www.ijedr.org)949
TABLE I:- TRANSMISSION LINE DATA OF TABLE II :- BUS DATA OF IEEE – 9 BUS SYSTEM IEEE – 9 BUS SYSTEM
TABLE III:- TRANSFORMER DATA OF IEEE – 9 BUS SYSTEMS
Line S
(MVA)
V (KV)
KV / KV
R
(pu) X (pu)
1 – 4 100 16.5 16.5 /230 0.00 0.0576
2 – 7 100 18 18 / 230 0.00 0.0625
3 – 9 100 13.8 13.8 /230 0.00 0.0586
IV.RESULT AND DISCUSSION
This section will tabulate and discuss the result implemented. The discussion on IEEE-9 bus system will be focused on how to determine the optimal location of TCSC in power system. [10,19]
A.Weak Bus Identification
Weak bus is defined as the bus which is near to experience a voltage collapse. The weakest bus is one that has a large ratio of differential change in voltage to differential change in load. Usually, placing adequate reactive power support at the weakest bus enhances static voltage stability margins. Changes in voltage at each bus for a given change in system load are available from the tangent vector, which can be readily obtained from the predictor steps in the CPF process. CPF is run for all construing limits such as voltage control, flow control, reactive power generation limit. [11,12]
The optimal location of TCSC and SVC can be achieved by determining the weakest voltage bus of the system. This can be done by continuation power flow analysis, The P-V curve plotted from continues power flow analysis can be use to determine the weakest bus of the system. Figure 5 shows the P-V curve of IEEE - 9 Bus systems. From figure 5, P-V curve of bus -6 voltages (yellow color) is the weakest bus among all the buses of the system. [13,14]
FIGURE.5 P-V CURVE OF IEEE - 9 BUS SYSTEM
COMPARISON OF TCSC &SVC WITH DIFFERENT LOADING CONDITION
0 0.2 0.4 0.6 0.8 1 1.2
0 0.2 0.4 0.6 0.8 1 1.2 1.4
Loading Parameter (p.u.)
Bu
s Vo
ltage(p.
u.)
123 123 123 12 3 1234 4
4
4
4 5
5
5
5
5
6
6
6
6
6
7 7
7
7
7
8 8
8
8
8
9 9
9
9
9 VBus 1
VBus 2
VBus 3
VBus 4
VBus 5
VBus 6
V
Bus 7
V
Bus 8
V
Bus 9
9
8
7
6
5 4 32
1
Bus No.
Bus Type
Voltage Magnitude
(pu)
Phase Angle (rad)
Active Power (pu)
Reactive Power
(pu)
1 Slack 1.04 0.00 0.80 -
2 PV 1.025 - 1.63 -
3 PV 1.025 - 0.85 -
5 PQ - - 1.87 0.75
6 PQ - - 2.70 0.90
8 PQ - - 1.00 0.35
Line No.
From Bus – To Bus
Resistance R (pu)
Reactance X (pu)
Susceptance B (pu)
1 7 – 8 0.0085 0.072 0.149
2 6 – 9 0.039 0.170 0.358
3 5 – 7 0.032 0.161 0.306
4 4 – 5 0.01 0.085 0.176
5 4 – 6 0.017 0.092 0.158
IJEDR1604142
International Journal of Engineering Development and Research (www.ijedr.org)950
Case – I Load on bus -6 ( P= 1.50 pu & Q= 0.50 pu ) [9,19]
Variation in bus 6 voltage and total losses in case-I
Case – II Load on bus -6 ( P= 1.60 pu & Q= 0.60 pu ) Variation in bus 6 voltage and total losses in case-II
Case – III Load on bus -6 ( P= 1.70 pu & Q= 0.80 pu)
Variation in bus 6 voltage and total losses in case-III
Case – IV Load on bus -6 ( P= 1.90 pu & Q= 0.85 pu
Bus 6 Voltage(p.u.) Real Power Loss Reactive Power Loss
Base Case 0.672683 0.665897 0.69439
TCSC 0.847764 0.512999 0.6742691
SVC 0.974033 0.155057 0.354816
0 0.2 0.4 0.6 0.8 1 1.2 1.4 B u s Vo ltage & Losse s (p .u .)
Case – I Load on bus -6 ( P= 1.50 pu & Q=
0.50 pu)
Bus 6 Voltage(p.u. ) Real Power Loss Reactive Power LossBase Case 0.615424 0.721604 0.754402
TCSC 0.834705 0.503085 0.681235
SVC 0.958503 0.193291 0.854578
0 0.2 0.4 0.6 0.81 1.2 1.4 1.6 1.8 B u s Vo ltage & Losse s (p .u
.)
Case – II Load on bus -6 ( P= 1.60 pu &
Q= 0.60 pu)
Bus 6 Voltage(p.u. ) Real Power Loss Reactive Power Loss
Base Case 0.543268 0.747581 0.751345
TCSC 0.806457 0.50997 0.719423
SVC 0.936573 0.162934 0.46358
0 0.2 0.4 0.6 0.81 1.2 1.4 1.6 1.8 B u s Vo ltage & Losse s ( p .u .)
Case – III Load on bus -6 ( P= 1.70 pu
&
Q= 0.80pu)
Sr.
No.
Location of
FACTS
device
Bus–6
Voltage
(pu)
Total Losses (pu)
Real
Power
Reactive
Power
1
Base case (No FACTS device)
0.672683 0.665897 0.694398
2
TCSC between Bus 6-9
0.847764 0.512999 0.674269
3 SVC at bus -
6 0.974033 0.155057 0.354816
Sr.
No.
Location of
FACTS device
Bus–6
Voltage
(pu)
Total Losses (pu)
Real
Power
Reactive
Power
1 Base case (No
FACTS device) 0.615424 0.721604
0.75440 2
2 TCSC at line -2 0.834705 0.503085 0.681235
3 SVC at bus - 6 0.958503 0.193291 0.85457 8 Sr No. Location of FACTS device Bus-6 Voltage (pu)
Total Losses (pu)
Real
Power
Reactive
Power
1 Base case (No
FACTS device) 0.543268 0.747581 0.751345
2
TCSC between Bus 6 - 9
0.806457 0.50997 0.719423
IJEDR1604142
International Journal of Engineering Development and Research (www.ijedr.org)951
Variation in bus 6 voltage and total losses in case-IVCONCLUSION
This paper conclude and present the review of TCSC and SVC FACTS devices which are used in transmission line for improve voltage profile and control voltage. It gives better result of real power losses and reactive power control. By changing the value of load bus means change in value active power and reactive power. Then we get better results of voltage profile and decrease in real power and reactive power losses.
REFERENCES
[1]Hingorani, N. G. and Gyugyi. L. (1999), Understanding FACTS: Concept and Technology of Flexible AC Transmission Systems. IEEE Press.
[2] Zhang, X.P., Rehtenz, C. and Pal, B. (2006). Flexible AC Transmission System: Modeling and Control. Verlag Berlin Heidelberg: Springer.
[3] B. GAO, G.K. Morison, P. Kundur, “Towards the development of a systematic approach for voltage stability assessment of largAugust 1996.
[4] Dipesh A. Patel, Snehal V. Malvi, Prabhat Kumar “Voltage Stability Enhancement and Loss Minimization By Optimally Placed TCSC” IJETAE Volume 3, Issue 11, November 2013
[5] G. Glanzmann “Coordinated Control of FACTS Devices based on Optimal Power Flow”.
[6] Chirag Tanti, Dinesh Pipalava “ Voltage profile improvement in power system using series and shunt type FACTS controller” IJSR Volume 4 Issue 2, February 2015.
7]Federico Milano, An Open Source Power System Analysis Toolbox, IEEE Transactions on Power System, Vol. 20, No. 3, August 2005.
[8] www.uclm.edu/area/gsee/Web/Federico/psat.htm
[9] Ketan Sakhaparia, Dr. Chirag K.Vibhakar2 Voltage Profile Improvement Using TCSC for IEEE-6 Bus System Using Trial And Error Method e-scale power systems," IEEE Trans. Power Syst. 11, pp. 1314–1324,
[10] C. Shankaran, “Power Quality”, CRC press, 2002, pp: 1-23
[11]Saeed Jahdi, “ Affects of TCSC Usages on Distance Protection and Voltage Profile of a System; A Novel” 978-1-4577-1250-0/11/$26.00 ©2011 IEEE
[12] Prechanon Kumkratug, “ Voltage Stability of Long Transmission Line Equipped with a Thyristor Controlled Series Capacitor”, American Journal of Applied Sciences 9 (9): 1491-1495, 2012ISSN 1546-9239© 2012 Science Publication
[13] Rupesh Kumar Mahobe, Nitin Saxena, "Voltage Profile Improvement Using Facts Devices", VOLUME :01 Issue 02 I Paper Id-IJIERM-I-I I-1160 ,April 2014
[14]B.Sharath Kumar and MD.Yaseen, "Voltage Quality Improvement by using Facts Devices",ISSN 2277 – 4106, Accepted 25 December 2013, Available online 30 December 2013, Vol.3, No.5 (December 2013).
[15]G. Glanzmann, G. Andersson; "Coordinated Control of FACTS Devices based on Optimal Power Flow",.
[16]Prechanon Kumkratug; "Voltage Stability of Long Transmission Line Equipped with a Thyristor Controlled Series Capacitor",American Journal of Applied Sciences 9 (9): 1491-1495, 2012 ISSN 1546-9239 © 2012 Science Publication.
[17]chepter-7Mathur- thyristor based facts controllers and electrical transmission systems.
[18] Irinjila Kranti Kiran 1 , Shunt versus Series compensation in the improvement of Power systemperformance Volume 2, No 1, 2011
[19] Ketan Sakhaparia1, Dr.C.K.Vibhakar2 Anoop Budhrani3,Performance Evaluation of Voltage Profile and Real Power losses in Power System FACTS Devices.
Bus 6 Voltage(p.u.
)
Real Power Loss
Reactive Power Loss
Base Case 0.49174 0.81103 0.7848615
TCSC 0.795261 0.50792 0.7375743
SVC 0.950207 0.144094 0.1493157
0 0.2 0.4 0.6 0.81 1.2 1.4 1.6 1.8
B
u
s
Vol
tag
e
&
Loss
es (p
.u.)
Case – IV Load on bus -6 ( P= 1.90 pu & Q=
0.85pu)
Sr.
No.
Location of
FACTS device
Bus–6
Voltage
(pu)
Total Losses (pu)
Real
Power
Reactive
Power
1
Base case (No FACTS device)
0.49174 0.81103 0.7848615
2 TCSC at line
-2 0.795261 0.50792 0.7375743