United Kingdom Vol. II, Issue 8, 2014
Licensed under Creative Common Page 1
http://ijecm.co.uk/
ISSN 2348 0386
EVALUATING THE EFFICIENCY OF INDIAN BANKING INDUSTRY
USING DATA ENVELOPE ANALYSIS
Arora, Gurpreet Kaur
IP University, Delhi, India [email protected]
Abstract
The banking sector plays a very crucial role in the economic growth of a country. The efficient
banking sector is thus the fundamental requirement for smooth functioning of any economy. In
the present study an attempt has been made to assess the efficiency of Indian Banking Sector.
Using data envelopment analysis (DEA), the study aims to measure the extent of technical, pure
technical and scale efficiencies of the Indian banks across different ownership categories for the
period 2011-12. Ten out of the 44 banks selected lie on the efficiency frontier and form the
reference set for their peers. The result indicates that contribution of scale inefficiency in overall
technical inefficiency has been observed to be smaller than what been observed due to
managerial inefficiency (i.e., pure technical inefficiency). Further, it is observed that efficiency
scores do not vary much across public sector, private sector and foreign banks. Performance of
public sector and private sector banks is almost at par with respect to technical efficiency
whereas in the case of foreign banks, there lays scope for improving scale efficiency.
Keywords: Data Envelope Analysis, Overall Technical Efficiency, Pure Technical Efficiency,
Scale Efficiency, Reference Set
INTRODUCTION
Licensed under Creative Common Page 2 the potential to push the economy into a slump, in what is the most extreme form of credit driven macroeconomic cycle (Caprio and Honohan 2002). Hence the study of efficiency of banking sector in particular becomes relevant as the information so generated can be utilized both by the government in designing policy framework as well as by the banks in evaluating their performance. The Indian Banking industry is governed by the Banking Regulation Act of India, 1949 and can be broadly classified into two major categories, non-scheduled banks and scheduled banks. Scheduled banks comprise of commercial banks and the co-operative banks. In terms of ownership, commercial banks can be further grouped into nationalized banks, the State Bank of India and its group banks, regional rural banks and private sector banks.
Since independence, banking industry in India has undergone structural changes to cope up with the evolving social and economic context of development. It has moved gradually from a regulated environment to a deregulated market economy. The pace of transformation has been even more significant in recent times with technology acting as a catalyst. Advances in information and communication technology have enabled banks to introduce new products and delivery channels, and strengthen their internal control systems. All these changes are expected to have significantly affected the way banks combine inputs to produce and deliver their products and services having a bearing on their efficiency and productivity. With the eruption of the global financial crisis in 2007, growth rate of the Indian economy came under arrest notwithstanding the sound banking system, negligible exposure of Indian banks to sub-prime assets and relatively well-functioning financial markets. The Indian banking sector emerged relatively unscathed from the headwinds of the west, but high inflation and depreciating rupee at the domestic front have created a challenging operational environment for Indian banks.
The present study has been undertaken to study and analyze the comparative efficiency of nationalized, private and foreign banks for the period 2011-12 using Data Envelopment Analysis (DEA). The first part of the study focuses on measuring the overall technical efficiency (OTE), pure technical efficiency (PTE) and scale efficiency (SE) of the sample 44 banks. The second part examines if there is any significant impact of ownership on the efficiency scores (as calculated in part one) of banks.
LITERATURE REVIEW
Licensed under Creative Common Page 3 that produces outputs and uses up inputs, in this study, each bank constitutes a DMU. A number of attempts in the recent years have been made by the researchers to analyze the efficiency of the banking sector using DEA. However, in the literature concerning efficiency of banks operating in India during the period 2011-2012, hardly any attention has been paid to examining technical and pure technical efficiency of banks. This research is an attempt to study the already existing literature on the efficiency appraisal of banks in India and provide a methodological framework which uses the technique of DEA to analyze the technical-scale efficiency scores for improving future performance and examining the impact of ownership of the efficiency score. Below mentioned is a succinct overview of domestic and international studies conducted in the banking sector using DEA.
Ayadi (1998) examined bank performance in Nigeria by using DEA. The inputs variables used were the interest paid on deposits, as well as expenses on personnel, administration etc and total deposits, while outputs variables were defined as total loans, interest income and non-interest income. He concluded that the weakness of Nigerian banks is attributed mainly to poor management which manifests in excessive credit and liquidity risk, poor loan quality and sluggish ability to generate capital internally. He also found that the relatively efficient Nigerian banks are those that have been in existence for a long period of time.
Al-Shammari and Salimi(1998) have examined the comparative operating efficiency of Jordanian commercial banks from 1991-1994 by using a modified version of DEA in which no inputs are specified. The only variables considered were the financial ratios, these ratios were return on investment, return on equity, earnings per share, credit to total assets, credit to deposits and cash and portfolio investments to deposits. The results obtained suggest that the majority of banks investigated were fairly inefficient over the period 1991-1994. The study results also revealed the composite reference set and their shadow prices, major determinants of banks' relative performance, and the target financial ratios.
Mukerjee et al. (2002) explored the linkage between performance benchmarking and strategic homogeneity of Indian commercial banks. They used five parameters as output variables in the DEA model namely, deposits, net profits, advances as given by each individual bank, non-interest income, interest spread, while the input parameters include net worth of the banks, borrowings of the banks, operating expenses, number of employees in the country and number of bank branches in the country. They found that the public sector banks generally outperform the private and foreign banks.
Licensed under Creative Common Page 4 They recommends that Saudi banks should continue their efforts of adapting new technologies and providing more services in order to sustain competitive advantages as Saudi Arabia continues to deregulate the banking industry.
Bonin, Hasan, Wachtel (2004) investigated the effects of ownership on bank efficiency in six transition countries. The efficiency measures are computed from stochastic frontier for the largest banks in transition countries and then used in ownership and privatization regressions having dummy variable for bank type. The study supported that the foreign owned bank are most efficient. In addition, the importance of attracting a strategic foreign owner in privatization is confirmed.
Sathye (2005) examined the impact of bank privatization on bank performance and efficiency using data of banks in India for five year period— 1998- 2002. Statistical analysis was performed using the difference of means test for three groups of banks- partially privatized, fully state owned and those already in private sector. The partially privatized banks (PPBs) showed a significant positive difference in financial performance and efficiency when compared to the fully public sector banks (FPBs). Also, the financial performance of banks already in the private sector is not significantly different from those that are partially privatized. With partial privatization of banks showing encouraging results, the study suggested that the proposal of the Government of India to bring down its stake from the capital may further help in improving the performance and efficiency of these banks.
OBJECTIVE OF STUDY
1. To undertake a comparison of efficiency gains across different groups of banks for the period 2011-2012.
2. To identify the efficient banks and inefficient banks as per DEA approach.
3. To measure the efficiencies and inefficiencies in the Indian banking sector by overall technical efficiency, Pure Technical efficiency and Scale efficiencies.
METHODOLOGY
Design and Data
Licensed under Creative Common Page 5 The study is divided into two parts as discussed. Part one deals with calculating overall technical efficiency, pure technical efficiency and managerial efficiency for different categories of banks. Max DEA version 5 software is used here for analyzing the efficiencies of banks using DEA. Part two further proceeds with hypothesis testing so as to find out if there is any difference in the efficiency of different banks with respect to their ownership structure.
DEA Framework
DEA is a linear programming model that measures the efficiency of DMUs in multiple-inputs, multiple-outputs setting. Typically, each of the DMUs in a given population use the same multiple inputs in varying quantities to produce varying quantities of the same multiple outputs. Using the actual observed values for the inputs and outputs for each DMU, DEA constructs a piecewise linear production surface, which in economic terms represents the revealed best-practice production frontier, referred to as the empirical production function or the efficient frontier. Units that lie on the surface are deemed efficient in DEA, while those units that do not, are termed inefficient. DEA provides a comprehensive analysis of relative efficiencies for multiple input-multiple output situations by evaluating each DMU and measuring its performance relative to an envelopment surface composed of other DMUs. Those DMUs forming the efficiency reference set are known as the peer group for the inefficient units. As the inefficient units are projected onto the envelopment surface, the efficient units closest to the projection and whose linear combination comprises this virtual unit form the peer group for that particular DMU. The targets defined by the efficient projections give an indication of how this DMU can improve to be efficient.
Speaking broadly, the DEA technique defines an efficiency measure of a production unit by its position relative to the frontier of the best performance established mathematically by the ratio of weighted sum of outputs to weighted sum of inputs. This ratio is normalized according to best practical peers and efficiency is calculated to be between 0 and 1, as 1 representing efficient unit.
Licensed under Creative Common Page 6 into account impact of returns to scale within the group of DMUs to be analyzed. The measure of efficiency obtained from the CRS model consists of technical efficiency of a firm which is a comparative measure of how well it actually processes inputs to achieve its outputs, as compared to its maximum potential for doing so, as represented by its production possibility frontier (Barros and Mascarenhas, 2005). A measure of technical efficiency under the assumption of CRS is known as a measure overall technical efficiency (OTE). The OTE measure helps to determine inefficiency due to the input/output configuration as well as the size of operations. In DEA, OTE measure has been decomposed into two components: pure technical efficiency (PTE) and scale efficiency (SE). This decomposition allows an insight into the source of inefficiencies. The PTE measure is obtained by estimating the efficient frontier under the assumption of variable returns-to-scale. It is a measure of technical efficiency without scale efficiency and purely reflects the managerial performance to organize the inputs in the production process. Thus, PTE measure has been used as an index to capture managerial performance. Scale efficiency is the ratio of CRS technical efficiency to VRS technical efficiency i.e. the ratio of OTE to PTE. If the ratio is equal to one, the firm exhibits CRS. If scale efficiency is less than one the respective firm exhibits VRS (increasing/decreasing). The measure of SE provides the ability of the management to choose the optimum size.
The present study undertakes the measurement of efficiency scores of banks using the input-oriented approach under both CCR and BCC models
Variable selection
Licensed under Creative Common Page 7 brokerage, and so on. The choice of output variables is consistent with the goals pursued by the Indian banks. In this study, the inputs that are identified for computing the efficiency scores comprise of (i) physical capital, (ii) labor, and (iii) loanable funds. The number of fulltime staff will be used as a measure of labor input. The input variable physical capital will represent the book value of premises and fixed assets net of depreciation. The input variable loanable funds will include both deposits and borrowings.
ANALYSIS AND FINDINGS
The DEA model has been run for all general insurance companies so considered in study, both for computing the technical efficiency under CCR model and pure technical and scale efficiency for BCC model.
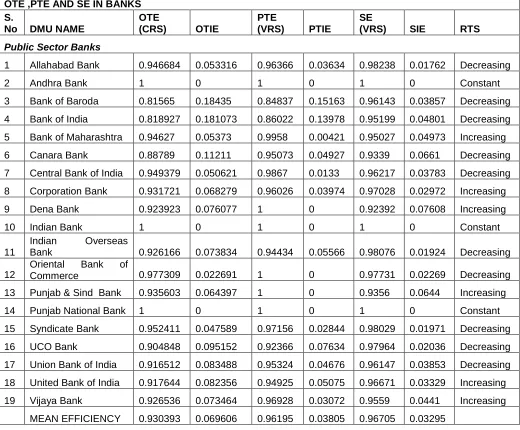
Table 1: Efficiency Score
OTE ,PTE AND SE IN BANKS S.
No DMU NAME
OTE
(CRS) OTIE
PTE
(VRS) PTIE
SE
(VRS) SIE RTS
Public Sector Banks
1 Allahabad Bank 0.946684 0.053316 0.96366 0.03634 0.98238 0.01762 Decreasing
2 Andhra Bank 1 0 1 0 1 0 Constant
3 Bank of Baroda 0.81565 0.18435 0.84837 0.15163 0.96143 0.03857 Decreasing 4 Bank of India 0.818927 0.181073 0.86022 0.13978 0.95199 0.04801 Decreasing 5 Bank of Maharashtra 0.94627 0.05373 0.9958 0.00421 0.95027 0.04973 Increasing 6 Canara Bank 0.88789 0.11211 0.95073 0.04927 0.9339 0.0661 Decreasing 7 Central Bank of India 0.949379 0.050621 0.9867 0.0133 0.96217 0.03783 Decreasing 8 Corporation Bank 0.931721 0.068279 0.96026 0.03974 0.97028 0.02972 Increasing 9 Dena Bank 0.923923 0.076077 1 0 0.92392 0.07608 Increasing
10 Indian Bank 1 0 1 0 1 0 Constant
11
Indian Overseas
Bank 0.926166 0.073834 0.94434 0.05566 0.98076 0.01924 Decreasing
12
Oriental Bank of
Commerce 0.977309 0.022691 1 0 0.97731 0.02269 Decreasing 13 Punjab & Sind Bank 0.935603 0.064397 1 0 0.9356 0.0644 Increasing
14 Punjab National Bank 1 0 1 0 1 0 Constant
Licensed under Creative Common Page 8
Foreign Banks
20 Bank of America NA 1 0 1 0 1 0 Constant
21 Barclays Bank PLC 1 0 1 0 1 0 Constant
22 BNP Paribas 0.8286 0.1714 1 0 0.8286 0.1714 Increasing 23 Citibank N.A. 0.71929 0.28071 1 0 0.71929 0.28071 Decreasing 24 DBS Bank Ltd. 0.62877 0.37123 0.74595 0.25405 0.84292 0.15708 Increasing 25 Deutsche Bank AG 0.9201 0.07991 1 0 0.9201 0.07991 Decreasing
26
JPMorgan Chase
Bank 0.89008 0.10992 0.91466 0.08535 0.97313 0.02687 Increasing
27
Standard Chartered
Bank 0.75137 0.24863 1 0 0.75137 0.24863 Decreasing
28
The Hongkong and Shanghai Banking
Corpn.Ltd. 0.70341 0.29659 0.93049 0.06951 0.75595 0.24405 Decreasing
29
The Royal Bank of
Scotland 1 0 1 0 1 0 Constant
MEAN EFFICIENCY 0.84416 0.15584 0.95911 0.04089 0.87914 0.12086
Private Sector Banks
30 Axis Bank Ltd. 1 0 1 0 1 0 Constant
31 City Union Bank Ltd. 0.981599 0.018401 1 0 0.9816 0.0184 Increasing 32 HDFC Bank Ltd. 0.945009 0.054991 1 0 0.94501 0.05499 Decreasing
33 ICICI Bank Ltd. 1 0 1 0 1 0 Constant
34 Indusind Bank Ltd. 0.986624 0.013376 0.99754 0.00246 0.98906 0.01094 Increasing 35 ING Vysya Bank Ltd. 0.965612 0.034388 1 0 0.96561 0.03439 Increasing
36
Kotak Mahindra Bank
Ltd. 1 0 1 0 1 0 Constant
37
Tamilnad Mercantile
Bank Ltd. 1 0 1 0 1 0 Constant
38
The Federal Bank
Ltd. 0.927777 0.072223 0.95525 0.04475 0.97124 0.02876 Decreasing
39
The Jammu &
Kashmir Bank Ltd. 0.864214 0.135786 0.8905 0.1095 0.97048 0.02952 Decreasing
40
The Karnataka Bank
Ltd. 0.879391 0.120609 0.89728 0.10273 0.98007 0.01993 Decreasing
41
The KarurVysya Bank
Ltd. 0.923661 0.076339 0.94067 0.05933 0.98192 0.01808 Decreasing
42
The Lakshmi Vilas
Bank Ltd. 0.942954 0.057046 1 0 0.94295 0.05705 Increasing
43
The South Indian
Bank Ltd. 0.87611 0.12389 0.89468 0.10532 0.97925 0.02075 Decreasing 44 YES Bank 0.814198 0.185802 0.83087 0.16913 0.97994 0.02006 Decreasing
MEAN EFFICIENCY 0.940477 0.0595234 0.96045 0.03955 0.97914 0.02086
Where
OTE= Overall technical efficiency, OTIE=Overall technical inefficiency= (1-OTE), PTE= Pure technical efficiency,PTIE=Pure technical inefficiency= (1-PTE), SE= Scale efficiency, SIE=Scale inefficiency= (1-SE),
RTS=returns-to-scale, IRS= increasing returns-to-scale,
Licensed under Creative Common Page 9 Of the 19 PSBs, 3 banks were found to be technically efficient since they had OTE score of 1. The remaining 16 banks have OTE score less than 1 which means that they are technically inefficient. The efficient banks in Indian public sector banking industry are Andhra Bank, Indian bank and Punjab National Bank. The PSBs results indicate that 3 efficient banks (i.e., 15.78 %) are operating at most productive scale size and experiencing CRS. Further, 6 banks (i.e., 31.57%) are operating above their optimal scale size and thus, experiencing IRS. The remaining 10 (i.e., 52.63%) banks have been observed to be operating in the zone of DRS. Of the 10 Foreign sector Banks, 3 banks were found to be technically efficient. The remaining 7 banks are technically inefficient. The efficient banks in Indian Foreign sector banking industry are Bank of America NA ,Barclays Bank PLC and The Royal Bank of Scotland. The foreign banks results indicate that 3 efficient banks (i.e.,30 %) are experiencing CRS. Further, 3 banks (i.e.,30%) are, experiencing IRS. The remaining 4 (i.e.,40 %) banks have been observed to be operating in the zone of DRS . Of the 15 Private sector Banks, 4 banks were found to be technically efficient. The efficient banks in Indian Private sector banking industry are Axis Bank Ltd., ICICI Bank Ltd., Kotak Mahindra Bank Ltd. and Tamilnad Mercantile Bank Ltd. The remaining 11 banks are technically inefficient. The Private banks results indicate that 4 efficient banks (i.e.,26.66%) are experiencing CRS. Further, 4 banks (i.e.,26.66%) are experiencing IRS. The remaining 7 (i.e.,46.68 %) banks have been observed to be operating in the zone of DRS.
Hypothesis Testing
The next part of the study is designed to test the following hypothesis:
H0 : There is no significant difference in the efficiency of public sector banks,
private sector banks and foreign banks.
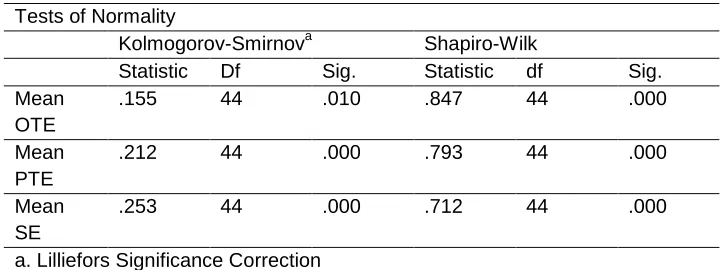
Licensed under Creative Common Page 10 Table 2: Test of Normality
Tests of Normality
Kolmogorov-Smirnova Shapiro-Wilk
Statistic Df Sig. Statistic df Sig. Mean
OTE
.155 44 .010 .847 44 .000
Mean PTE
.212 44 .000 .793 44 .000
Mean SE
.253 44 .000 .712 44 .000
a. Lilliefors Significance Correction
Observing the test statistic in Table 2, it can be concluded that data is not normally distributed (95% confidence level), hence, the study proceeds with application of Kruskal-Wallis test to find out if there is any significant difference between the efficiency of public sector banks, private sector banks and foreign banks.
Table 3: Kruskal-Wallis Test Banks
Banks N Mean Rank
Mean OTE Public Sector Banks 19 22.89
Private Sector Banks 15 25.53 Foriegn Sector Banks 10 17.20
Total 44
Mean PTE Public Sector Banks 19 20.76
Private Sector Banks 15 23.40 Foriegn Sector Banks 10 24.45
Total 44
Mean SE Public Sector Banks 19 21.89
Private Sector Banks 15 27.60 Foriegn Sector Banks 10 16.00
Total 44
Table 4: Test of Statistics Test Statisticsa,b
Mean OTE Mean PTE Mean SE
Chi-Square 2.567 .673 4.987
Df 2 2 2
Asymp. Sig. .277 .714 .083
Licensed under Creative Common Page 11 Interpreting the test statistics in Table 4, as the p value in case of all the three efficiency score is more than 0.05, so we fail to reject the null hypothesis (95% confidence level) and hence it can be conveniently inferred from the above data that there is no significant difference in the performance of public sector banks, private banks and foreign banks.
CONCLUSION, LIMITATIONS AND FUTURE SCOPE
The study examines the performance of Indian banks under different ownership structure for the period 2011-2012. DEA technique is used to evaluate the efficiency scores and it is observed that only 10 out of 44 selected banks are efficient. These 10 banks define the efficiency frontier. Out of these efficient banks, three banks are from the nationalized category (Andhra Bank, Indian bank and Punjab National Bank), the other four from private sector (Axis Bank Ltd., ICICI Bank Ltd., Kotak Mahindra Bank Ltd. and Tamilnad Mercantile Bank Ltd.) and remaining three from foreign sector (Bank of America NA ,Barclays Bank PLC and The Royal Bank of Scotland).The OTE score is found to be the least for foreign banks whereas the private sector banks have marginally outperformed the public sector banks. However, the difference in the efficiency scores is not found to be statistically significant. PTE of nationalized, private and foreign banks in the post financial crisis period is robust at more than 90% for all category of banks included in the study. Thus it is believed that with respect to managerial efficiency, the banks across different ownerships are equally competitive.SE is again the least for foreign banks and at par for nationalized and private banks.
Licensed under Creative Common Page 12 The present study is carried out for one year i.e 2011-2012, the results may differ if longer period of time is taken. Also the study considered two input variables and two output variables, however there are many other input and output variables that can be used for evaluating the efficiency. The study is concerned with computing efficiency score and impact of ownership, which can further be used to identify the variables that affect the efficiency score so computed by using regression which is not covered in the study.
The results of this study shall further be investigated by expanding the magnitude of inputs and outputs. Also the study can be carried out over a longer period of time and can incorporate returns to scale and Malmquist indices of Total Factor productivity change (TFP).
REFERENCES
Avkiran, N.K.1999. The Evidence of Efficiency Gains: The Role of Mergers and the Benefits to the Public. Journal of Banking and Finance.23,991-1013.
Banker, R.D., A. Charnes and W.W. Cooper. 1984. Some Models for Estimating Technical and Scale Efficiencies in Data Envelopment Analysis. Management Science, 30(9): 1078–92.
Berger, A.N. and D.B. Humphrey. 1997. Efficiency of Financial Institutions: International Survey and Directions for Future Research. European Journal of Operational Research, 98(2): 175–212.
Bhattacharya, A., C.A.K. Lovell and P. Sahay.1997. The Impact of Liberalization on the Productive Efficiency of Indian Commercial Banks. European Journal of Operational Research, 98(2): 332–45. Caprio, G., Jr and P. Honohan.2002. Banking Policy and Macroeconomic Stability: An Exploration. World Bank Policy Research Working Paper No. 2856, Washington DC: The World Bank Development Research Group.
Casu, B., Girardone, C., and Molyneux, P. 2004. Productivity Change in European Banking: a Comparison of Parametric and Non-Parametric Approaches. Journal of Banking and Finance 28, No. 10, 2521-2540.
Charnes, A., W.W. Cooper and E. Rhodes. 1978. Measuring the Efficiency of Decision Making Units. European Journal of Operational Research, 2(6): 429–44.
Chatterjee, G. 2006. Is Inefficiency of Banks in India a Cause for Concern? Evidence from the Post- Reforms Era. Journal of Emerging Market Finance,5(2): 151–82.
Chatterjee, G. 1997. Scale Economies in Banking: Indian Experience in Deregulated Era. RBI Occasional Papers, Vol. 18 No. 1, 25-59.
Chen, T.Y.; and Yeh, T.L.1998. A Study of efficiency evaluation in Taiwan‘s Banks. International Journal of Service Industry Management 9(5):402-415.
Chowdhury, Subroto,2011. Effect of Financial Crisis in Efficiency and Strategic Homogenity of Indian Commercial Banks: An Empirical Investigation. International Journal of Financial Management;Vol. 1 Issue 1, p1.
Cooper, W.W., Seiford L.M. Tone K., 2000. Data envelopment analysis: A Comprehensive Text with Models, Applications, References and DEA Solver Software Kluwer Academic Publishers, Boston.
Das, A. 1997a. Measurement of Productive Efficiency and its Decomposition in Indian Banking Firms. Asian Economic Review, 39(3): 422–39.
Das, A. 1997b. Technical, Allocative and Scale Efficiency of Public Sector Banks in India. Reserve Bank of India Occasional Papers, 18(2–3): 279–301; 1999.
Licensed under Creative Common Page 13 Debasish, S.S. 2006. Efficiency Performance in Indian Banking—Use of Data Envelopment Analysis. Global Business Review, 7(2): 325–33.
Dwivedi, Amit Kumar and Charyulu, D.Kumar. 2011. Efficiency of Indian Banking Industry in the Post-Reform Era, Working Paper No. 2011-03-01, Indian Institute of Ahmedabad, March 2011.
Douglas D. Evanoff & Philip R. Israilevich, 1991. Scale elasticity and efficiency for U.S. banks, Working Paper Series. Issues in Financial Regulation 91-15, Federal Reserve Bank of Chicago.
Farrell, M.J. 1957. The measurement of productive efficiency‘, Journal of the Royal Statistical Society, Series A, Vol. 120, No. 3, pp. 253-281.
Grifell-Tatjé, E. and Lovell, C.A.K. 1997. The sources of productivity change in Spanish banking. European Journal of Operational Research, 98, 364-380.
Gupta, Rachita. 2011. Evaluation of technical, pure technical and scale efficiencies of Indian banks: An analysis from cross-sectional perspective. Proceedings from The 13th Annual Conference on Money and Finance in the Indian Economy, Indira Gandhi Institute of Development Research, Mumbai,25-26 Feb. Isik, I. and Hassan, M.K. 2003. Efficiency, ownership and market structure, corporate control and governance in the Turkish banking industry, Journal of Business Finance and Accounting, 30, 1363–421
Jadhav, N and D. Ajit .1996.Role of banks in the Economic Development of India. Prajnan, 25, (3-4), pp. 309-409.
Jesus Gustavo Garza Garcia.2012. Determinants of bank efficiency in Mexico: a two-stage analysis. Applied Economic Letters, Vol.19, No.17, pp 1679-1682.
Keshari, P.K. and Paul, M.T., 1994. Relative efficiency of foreign and domestic banks‘, Economic and Political Weekly, Vol. 29, No. 9, pp. M31-M36.
Kumar, S. and S. Verma. 2003. Technical Efficiency, Benchmarks and Targets: A Case Study of Indian Public Sector Banks. Prajnan: Journal of Social and Management Sciences, 31(4): 275–300.
Kumar, S. 2008. ‗An analysis of efficiency-profitability relationship in Indian public sector banks‘, Global Business Review, Vol. 9, No. 1, pp. 115-129.
Kumar,S. and Gulati, R. 2008. ‗Evaluation of technical efficiency and ranking of public sector banks in India: an analysis from cross-sectional perspective‘, International Journal of Productivity and Performance Management, Vol. 57, No. 7, pp. 540-568.
Kumar, Mukesh and Charles, Vincent. (2012). Evaluating the Performance of Indian Banking Sector using Data Envelopment Analysis during Post-Reform and Global Financial Crisis. Working Paper No. 2012-09-0007, CENTRUM Católica‘s Working Paper Series, September 2012.
Mester L.J., 1996, A Study of Bank Efficiency Taking into Account Risk-Preferences, Journal of Banking and Finance, 20, 389 - 405.
Molyneux P., Altunbas Y. and E.P.M. Gardener, 1996, Efficiency in European Banking, John Wiley & Sons (Chichester, England).
Mukherjee, A, P. Nath and M.N. Pal. 2002. Performance Benchmarking and Strategic Homogeneity of Indian Banks. International Journal of Bank Marketing, 20(3): 122–39.
Noulas, A.G. and K.W. Ketkar. 1996. Technical and Scale Efficiency in the Indian Banking Sector. International Journal of Development Banking, 14(2): 19–27.
Noulas, A. G. 2001. Deregulation and operating efficiency: the case of Greek Banks. Managerial Finance 27(8):35-47. Banks: A DEA Approach. European Journal of Operational Research, 124(1): 187–203. Saha, A. and T.S. Ravisankar. 2000. Rating of Indian Commercial commercial banks: a DEA approach‘, European Journal of Operational Research, Vol. 124, No. 1, pp. 187-203.
Sathye, M. 2003. Efficiency of Banks in a Developing Economy: The Case of India. European Journal of Operational Research, 148(3): 662–71.