Licensed under Creative Common Page 1
http://ijecm.co.uk/
ISSN 2348 0386
IPO STOCKS INITIAL RETURNS VOLATILITY
A CAUSE-EFFECT DETERMINATION USING
VAR AND GARCH MODELS
Alex A. A. Bruce
Lecturer, Department of Business Administration, Gombe State University, Nigeria PhD scholar, University of Kelaniya, Sri Lanka
[email protected]; [email protected]
P. M. C. Thilakaratne
Senior Lecturer, Department of Accountancy
Faculty of Commerce and Management Studies, University of Kelaniya, Sri Lanka
Abstract
The wider scope of the economy in most cases subjects every movement of economic activities
to follow its direction and dictates. In such case, the operation of the macroeconomic factors
cobwebs the independence of other economic properties to their tides. We examine in
sequence, the first-day, monthly and yearly initial returns volatility of IPOs of the Nigerian stock
Exchange (NSE) and the Colombo Stock Exchange (CSE) with sample of 166 and 144IPO
stocks, respectively, in the light of shocks exerted by economic-wide/firm-specific variables.
IPOs initial returns is conveyed as a function of the selected variables and used to observe the
relationship and influence of the macroeconomic/firm-specific factors and further determination
of the volatility and shocks via the GARCH and VAR models. The result is robust such that
macroeconomic/firm-specific variables primarily exert shocks and generate volatile IPO returns
in first-day, monthly and yearly trades. In that sense, we find that investors in NSE display
character of risk-taking against their CSE counterparts who are highly risk-averse but not
withstanding, volatility rate is very high for both markets during the yearly evaluation but
relatively lower for the NSE during the first-day and monthly trades. On other hand, volatility is
more persistent over a long-run period in CSE whereas it dies out in the short-run on the NSE.
Licensed under Creative Common Page 2 INTRODUCTION
The vulnerability of the stocks market creates alarming consequence on economic development due to capital mop-up by investors owing to confidence erosion and fear of losing investments. However, in most of these trends, the cause of such confidence erosion is considered to be mostly generated by the interface of macroeconomic variables and variables within the circumference of the stocks’ issuing firms which consist of several economic policy initiatives and measures at different points in time geared towards correcting one overlap or the other while in some instances negligence and malpractices by both policy initiators, implementers and the firms representatives and participants of the stocks market hullabaloo’s the curses of wealth creation. By and large, the multiplier effect of these consequences is lambasted on the stocks market which creates bubbles and crashes owing to some other variables which the participating firms and their allies also contribute. Perhaps, the most significant aspect of these stocks is those offered via Initial Public Offering (IPO) which serves as the most paramount avenue for selling a firm’s stocks to the general public for subscription. Interestingly enough, a common sense would assume that such offer should not be influenced by any contending factor(s) especially during the first-day of its trading on the market, yet it is far beyond such presumptions. It is noteworthy to emphasize that IPOs initial returns volatility is a product of mispricing which in-turn is a product of volatility factors that are either exogenous or endogenous to the issuing firm. Ross (1976a and 1976b) models a theory called the Arbitrage Pricing Theory (hereafter APT) which suggests that, there are factor-existing variables that impede on stocks and general assets prices to cause variability in returns but such variables were not completely identified by the theory.
Licensed under Creative Common Page 3
successful or unsuccessful as the case may be as indications from early studies (e.g. Sharp, 1964, etc) on capital asset pricing show a wired link between macroeconomic variables and stock market pricing and returns.
It is in the light of this that we seek to examine some basic macroeconomic and firm-specific factors and their relative shocks on the IPOs returns during the first-day, monthly and yearly trading on the Nigerian stock exchange (NSE) and the Colombo stock exchange (CSE). We find in this paper that volatility rates in the stock markets of Nigeria and Sri Lanka is very high without bringing to light the factors responsible for the trend. In that case, IPOs initial returns volatility rate is 131.52% and information asymmetry rate of 26.53% on the NSE but -482.17% and -14.39% for the CSE during the first-day of the stocks’ trading. The trend in the NSE continues into the monthly trading resulting into volatility rate of 110.85% and information asymmetry rate of 289.66% while the CSE experience volatility rate of 82.90% and leverage effect of 230.87% during the same period. Furthermore, volatility rate escalates to 428.48% and 401.30%, for the NSE and CSE, respectively, during the 3-year period with information asymmetry rate of 14.92% and 72.76%; indicating that investors are more risk-averse on yearly basis than in the first-day and monthly periods. However, with the introduction of the macroeconomic/firm-specific variables for the determination of the volatility, we find that volatility rate of the IPOs initial returns in the NSE stands at 96.43% with information asymmetry rate of 40.79% during the first-day indicating a trend where shocks die out in the short-run, compared to CSE where volatility rate is very high at 149.14% and leverage effect of 134.37% in the same period such that shocks persist into the long-run. On the other phase, NSE IPOs initial returns experience very little volatility rate of 2% and identical information effects of 2% but volatility persist in the CSE at 129.12%, however, with identical information effect of 10.28% on the monthly trading. Above all, the yearly trend is more alarming in that, volatility reaches extreme level at the CSE market at 401.38% and leverage effect of 130.94% depicting high level of investor distrust at any news. Similar case is found in the NSE where volatility rises to 198.63% and leverage effect of 42.06% depicting a scenario for changing investment decisions on any news available. These volatility rate and leverage effect measures, perhaps, show very convincing behavior of the IPOs initial returns; which is basically engineered by the macroeconomic/firm-specific variables whether on first-day, monthly or yearly basis. In the NSE, for instance, volatility rate is high on the first-day but dies out in the short-run; with bad news as a major player. Similarly, in the CSE, volatility rate persists over a long-run period indicating enduring shocks; with very high bad news effects above what is obtainable in the NSE.
Licensed under Creative Common Page 4
even in an unfavorable economic situations and other related firm internal factors making them potential risk-takers. On the other hand, CSE vary to some extent on the behavior of the explanation variables such that in most cases in the CSE, when these variables unfavorably manifest, investors quickly tend to withdraw participation of their capital in IPO stocks for alternative investments and vice-versa making them highly risk-averse. Furthermore, investors in both markets take stock at the end of the financial year to assess the value of their stocks and the perceived impact of macroeconomic policies and firm-specific decisions and hence tend to change attitudes to investing in the IPOs when the result is not favorable. This could be the most reason why dividend per share is positively correlated to initial returns on yearly basis. But IPOs initial returns volatility rate is much persistent in the CSE accompanied by high information asymmetry on the yearly basis unlike the NSE. This is a carry-over of the fears demonstrated during the months past into the end of yearly stock-taking and evaluation.
The remainder of the paper is organized as follows. The relationship between macroeconomic/firm-specific variables and IPO initial returns volatility is presented in section 2while section 3 discusses the data, methods and model specification. Furthermore, section 4 unveils the results and consistencies of the findings and finally section 5 concludes.
MACROECONOMIC/FIRM-SPECIFIC VARIABLES AND IPO INITIAL RETURNS VOLATILITY
Licensed under Creative Common Page 5
stock returns. The factors identified by him have proven to influence stock returns but in divergent ways from economy to economy.
It is therefore, noteworthy to emphasize that there is no satisfactory theory that can argue that the relationship between financial markets and the macro-economy is entirely one direction (Chen, et al, 1986); such that the effects on the stock returns can only be identified via variables that influence discount rates and firm cash flows resulting in dividend cuts or increase. Understanding this background therefore, a study of the South African stocks market by Chinzara (2010) and that of Al-Sharkas (2004) on the Jordanian stock market show that macroeconomic uncertainties significantly affect the stock market volatility such that exchange rate volatility, short-term interest rate volatility, and financial crises impacts very negatively on stocks returns with very little effects from variability in gold prices, oil prices and inflation rate. In a classical paper on the relationship between stock market volatility and volatility of real and nominal macroeconomic variables, Schwert (1989) concludes that movements in inflation and real output has weak predictive power on volatility of stock market and return. In similar study of the NSE, Osisanwo and Atanda (2012) use OLS on the time series of the ASPI of the Nigerian stock market between 1984 and 2010 and report that interest rate, exchange rate, previous stock return levels and money supply are the main determinants of stock returns in Nigeria.
Foreign Exchange Rate Variability
Licensed under Creative Common Page 6
Olweny and Omondi (2011) document that foreign exchange rate volatility significantly affects stock return volatility on the Nairobi Stock Exchange. In a study of a relationship between the Johannesburg stock market and foreign exchange rate, Hsing (2011) observes that there is a positive relationship between stock returns and foreign exchange rate. Benita and Lauterbach (2004) note that exchange rate volatility have real economic costs that affect price stability, firm profitability and the general economy’s stability. Going by these findings, it is easier to clarify that foreign exchange rate volatility impact on the IPO stocks return variability because of its ability to impair on the general performance of the economy. This is because decisions on fiscal and monetary policies are dependent upon foreign exchange rate fluctuations and other macroeconomic factors.
Interest Rate Variability
Licensed under Creative Common Page 7
Singapore Hotel stock market (Chiang et al, 2009).There is a very great inter-woven relationship between interest rate and financial risk. For instance, Ross (2010:735) document that the most current example of financial risk effect is the collapse of the once-thriving U.S. savings and loan (S&L) industry which at a time was relatively simple because they accepted short-term deposits at lower interest rates and extended long-term, fixed rate home mortgage loans at higher rates which helped them spread profits; not until the interest rates volatility crept in suddenly, so that short-term interest rates became highly volatile, exceeding the long-term rates on various intervals by substantial amounts. This made the S&L industries business very complicated and loosing, because long-term mortgage borrowers stocked to their low-interest payments while the short-term depositors removed their funds. Although there were other economic and political factors that contributed to the disaster, but the most root cause was the high rate of interest volatility on the short-run loans. The S&L were forced to borrow more short-term funds at high interest rates believing to correct the trend but instead ended-up into higher default rates which was very unfamiliar to the S&Ls. The clear note here is that, investors in most cases deposit their excess funds in anticipation for better investment opportunities, so that whenever, investment assets prove highly investable, they rush for it because of the interest rate associated.
Walsh (2010:465) reveals that the changes in short-term interest rate that serves as the operational target for implementing monetary policy will affect aggregate spending decisions only if long-term real rates of interest are affected. He further narrates that while the use of interest rate-oriented policy reduces the importance of money demand in the transmission of policy actions to the real economy, it raises to prominence the role played by the term structure of interest rates. Some of the proponents of this expectations theory of term structure of interest rate are Shiller (1990), and Campbell and Shiller (1991) whose writings have impacted on the general outlook of short-term interest rate variations as they influence general investment and spending, given an effect on long-term rates of interest. This means that interest rate volatility sways investment patterns of investors and investments.
Inflation Rate Variability
Licensed under Creative Common Page 8
same value of assets it originally could acquire. An economy becomes highly heated up, if the demand for consumption outstrips productivity. This finding is similar to Lintner (1975), Bodie (1976), Nelson (1976), Schwert and Fama (1977), Feldstein (1980), Fama (1981), Gjerde and Saettem (1999) and Koch and Saporoschenko (2001) that there exist adverse relationship between inflation rate and stock price and returns in the US, Japanese, and Norwegian stock markets. In a study of the Nigerian stock market, Yaya and Shittu (2010) find that the previous inflation rates have significant effects on conditional stock market volatility. Changes in inflation rates, as measured by changes in these rates also have greater impact in predicting the stock market volatility in Nigeria. These results concur with Fisher’s effect in international stock market. Fisher (1930) asserts that the nominal interest rate consists of a real rate plus the expected inflation rate such that investors are ultimately concerned with what they can buy with their money, hence they require some sort of compensation for inflation, and so, Irvin Fisher demonstrated a quickening formulae to handle such situation as;1 + 𝑅 = (1 + 𝑟)(1 + ℎ), where R=Nominal interest rate; r=Real interest rate; and h=Inflation rate. He further stated that expected real rate of the economy is determined by the real factors such as productivity of capital and time preference of savers and is independent of the expected inf lation rate. If Fisher effect holds, then there is no change in inflation and nominal stock returns since stock returns are allowed to hedge for inflation. However, with the present economic development and market trends Fisher’s proposition, and claims that the real rates of common stock return and expected inflation rates are independent and that nominal stock returns vary in one -to-one correspondence with expected inflation cannot stand, yet the proposition is largely utilized by most financial economists.
Price Variability of other Securities
It is observed by Bradley and Jordan (2002) and Lowry and Schwert (2010) that initial returns are explained partly by the initial returns of previous IPOs just as economic theory suggests that the rise in the price of a product leads to rise in a similar product in the products line (Lipsey & Chrystal,, (2011). In the same vein, Loughran and Ritter (2002) and Lowry and Schwert (2010) further maintain that initial returns are positively related to market-wide stock price increases before the IPO;A finding that is consistent with Purnanandam and Swaminathan (2004) and Derrien (2005) that the offer prices reflect considerations of value relative to other publicly traded shares. Ritter (2003) also asserts that early pricing discussions focus on offer prices that are implied by the market values of publicly traded shares of comparable firms.
Licensed under Creative Common Page 9
acquired on the prices of other existing stocks is a product of adequate information that trickles down the lane to help determine the worth of the issuing firm and other related firms’ stocks that have almost the same capacity, value and similarities. On the other hand, Hsu, et al (2010) argue that companies experience negative stock price reactions to completed IPOs in their industry and positive stock price if such IPOs are later withdrawn before they are floated. They further maintain that, firms within the same industry tend to deteriorate significantly in their operating performance if a successful IPO in their industry group is floated. This means that the competitive nature of firms is also demonstrated via their IPOs, so that the news about an IPO triggers fear among the companies within an industry group thereby decreasing their performance.
The Broad Money Supply
The earlier writers on the quantity theory of money and prices (Monroe, (1923), Angell, (1926); Viner, (1937); Schumpeter, (1954); Friedman, (1956); etc) establish that there is positive relationship between quantity of money supplied and the general prices of goods and assets so that an increase in money supply leads to increase in general price levels and vice-versa. This means that the general price level is bound to change in some dependable manner in response to changes in the total quantity of money in circulation (Vaish, 2007). But to achieve stability of prices in the economy, Friedman (1946, 1959) asserts that the rate of growth of money supply should be kept constant while open market operations are employed to stabilize the economy. It is very significant to understand then, that an increase in money supply leads to prices rise in the stocks market which leads to high prices of existing stocks and new stocks as well without corresponding increase in the productivity of the firms. Osisanwo and Atanda (2012) report that broad money supply growth rate has a negative correlation with stock returns in Nigeria using period range of 1984-2010 for All-share price index but they could not measure the rate of volatility caused owing to the use of ordinary least square in their study.
Licensed under Creative Common Page 10
the IPO stocks performance is and will always be imperfect as long as the systematic and firm-specific variables have not been completely identified; or somewhat manipulated, to create more idiosyncratic shocks until they are really identified in totality; we are not yet good at it.
METHODOLOGY
Time series data on IPO stocks made of offer price, market price, volumes offered and subscribed were obtained from the All Share indexes of the NSE and CSE, respectively, while the macroeconomic time series data were accessed from the Central Banks of the respective countries. The data sequence for IPOs returns involve offering/market price of the first-day, monthly and yearly stock returns as used by Bruce and Thilakaratne (2015), Lowry et al (2010) and Loughran and Ritter (2004). On the other hand, the dividend per share (DPS) is sourced from the financial statements of the companies and the stock exchanges within the sampled indices. These data come from the trading statistics contained in the Stock Exchanges’ Fact books and publications, Securities and Exchange Commission statistical records, data library of NSE and CSE, the Central Banks annual reports on websites, and the firms’ financial statements. We develop and present the sample and information sources on the described table (1) below.
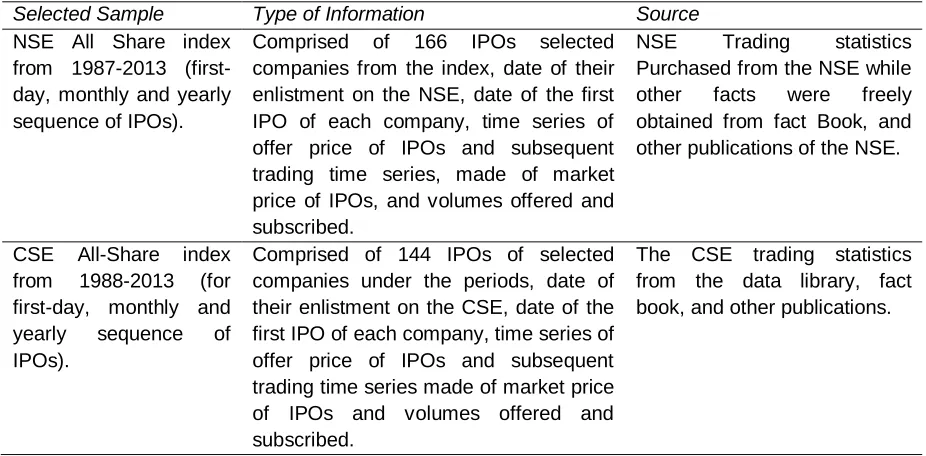
Table 1: Selected Samples and Information Source showing the sample range of period for the IPOs
selected in the NSE and CSE thereby highlighting the number of stocks and exempting deleted stocks
within those periods then presenting the nature of information and data requirements as obtained from
the various institutions and related publications on first-day, monthly and yearly documentations.
Selected Sample Type of Information Source
NSE All Share index from 1987-2013 (first-day, monthly and yearly sequence of IPOs).
Comprised of 166 IPOs selected companies from the index, date of their enlistment on the NSE, date of the first IPO of each company, time series of offer price of IPOs and subsequent trading time series, made of market price of IPOs, and volumes offered and subscribed.
NSE Trading statistics Purchased from the NSE while other facts were freely obtained from fact Book, and other publications of the NSE.
CSE All-Share index from 1988-2013 (for first-day, monthly and yearly sequence of IPOs).
Comprised of 144 IPOs of selected companies under the periods, date of their enlistment on the CSE, date of the first IPO of each company, time series of offer price of IPOs and subsequent trading time series made of market price of IPOs and volumes offered and subscribed.
Licensed under Creative Common Page 11
This means that there are 166 and 144 observations during the first-day data analysis for the two exchanges, respectively; while for the monthly analysis, a total observation of 5,760 instead of 5,976were utilized for the NSE and 4,752 instead of 5,184 observations used for the CSE to meet 36-month period coverage for each of the IPOs selected for the study. This is because the figures are short of more than two years (i.e. > 24 months) observations for stocks listed at the end of 2013 and more than 1 year (i.e. >12 months) observations for stocks listed later than January, 2012. Furthermore, the number of observations for the yearly sequence reflects 166 IPOs for 3-year trade to give 498 for the NSE but because two firms and eight firms in 2012 and 2013, respectively, could not satisfy the 3-year observations, we had 480 observations. In the same vein, the required observation for the CSE should have been 432 for the 3-year period but for the fact that seven firms and five firms listed in 2012 and 2013, respectively, could not meet the 3-year trading data, the total observation is 396.
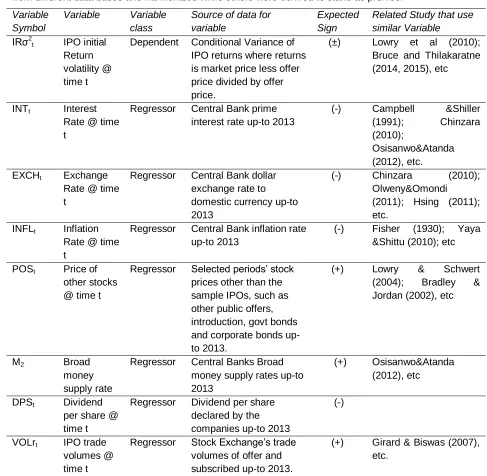
Variables Classification
Licensed under Creative Common Page 12 Table 2: Variables Description and Sources of the data especially since most of the data were collected
from different data bases and harmonized while others were derived to stand as proxies.
Variable Symbol
Variable Variable class
Source of data for variable
Expected Sign
Related Study that use similar Variable
IRσ2
t IPO initial Return volatility @ time t
Dependent Conditional Variance of IPO returns where returns is market price less offer price divided by offer price.
(±) Lowry et al (2010); Bruce and Thilakaratne (2014, 2015), etc
INTt Interest Rate @ time t
Regressor Central Bank prime interest rate up-to 2013
(-) Campbell &Shiller (1991); Chinzara (2010);
Osisanwo&Atanda (2012), etc. EXCHt Exchange
Rate @ time t
Regressor Central Bank dollar exchange rate to domestic currency up-to 2013
(-) Chinzara (2010); Olweny&Omondi (2011); Hsing (2011); etc.
INFLt Inflation Rate @ time t
Regressor Central Bank inflation rate up-to 2013
(-) Fisher (1930); Yaya &Shittu (2010); etc
POSt Price of other stocks @ time t
Regressor Selected periods’ stock prices other than the sample IPOs, such as other public offers, introduction, govt bonds and corporate bonds up-to 2013.
(+) Lowry & Schwert (2004); Bradley & Jordan (2002), etc
M2 Broad
money supply rate
Regressor Central Banks Broad money supply rates up-to 2013
(+) Osisanwo&Atanda (2012), etc
DPSt Dividend per share @ time t
Regressor Dividend per share declared by the companies up-to 2013
(-)
VOLrt IPO trade volumes @ time t
Regressor Stock Exchange’s trade volumes of offer and subscribed up-to 2013.
(+) Girard & Biswas (2007), etc.
1988-Licensed under Creative Common Page 13
2013. All the series proved I (0) variables in their original form while some were taking in their logarithmic formats.
Development and Derivation of Hypothesis
We derive our hypothesis basically from the researches on similar studies on the NSE and CSE as well as invoking the evidences of researches from other stock markets around the world to ascertaining the macroeconomic and firm-specific variables’ influence on IPOs initial returns volatility. Prominent among the reviews considered for the development of the hypothesis is Cohn and Modigliani (1979), Engle (1982), Bollerslev (1986), Benveniste and Spindt (1989), Benveniste and Wilhelm (1997), Ritter (2003), Lowry and Schwert (2004), Peter (2007), Girard and Biswas (2007), Adrain and Rosenberg (2008), Lowry et al (2010), Olweny and Omondi(2011), Osisanwo and Atanda(2012), etc, which in similar perspective, utilized some of the variables to observe the behaviour of the stock market. We therefore, postulate that:
H: There is significant effect of the macroeconomic variables (i.e., prime interest rate, exchange
rate, inflation rate, broad money supply and price of other stocks) and firm-specific variables
(i.e., dividend per share, and volume ratio) on the degree of IPOs initial returns volatility and
behaviour of investors.
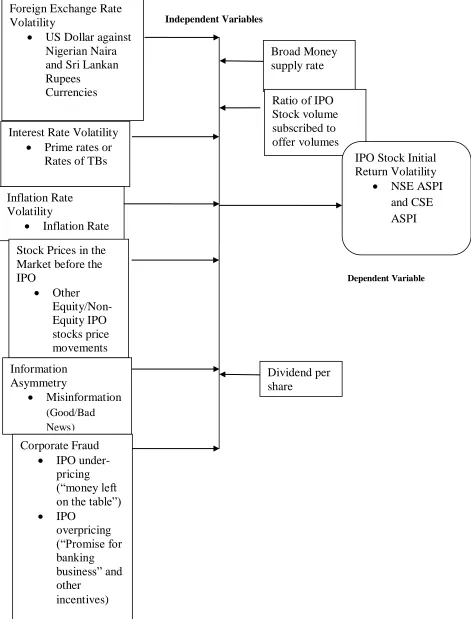
Proposed Research Framework
Since the research variables constitute dependent and independent variables as tabulated on table 2, by and large, the relationship established makes expansion on Lowry, et al (2010),Olweny and Omondi (2011), Bruce and Thilakaretne(2014, 2015) and several other authors thereby motivating us to conceptualize diagrammatically as in Figure 1 (see next page).
Therefore, that the relationship between the variables in table 2 and figure1 is statistically represented as:
𝐼𝑅𝜎𝑡2= 𝐼𝑁𝑇𝑡+ 𝐸𝑋𝐶𝐻𝑡+ 𝐼𝑁𝐹𝐿𝑡+ 𝑀2𝑡+ 𝑃𝑂𝑆𝑡+ 𝐷𝑃𝑆𝑡+ 𝑉𝑂𝐿𝑟𝑡 (1)
Licensed under Creative Common Page 14 Figure 1: Factors Responsible for IPO Stocks Initial Returns Volatility in Emerging/developed markets
from various studies of past and present along with the application variables in this paper
Independent Variables
Dependent Variable
Foreign Exchange Rate
Volatility
US Dollar against
Nigerian Naira
and Sri Lankan
Rupees
Currencies
Broad Money
supply rate
Ratio of IPO
Stock volume
subscribed to
offer volumes
Interest Rate Volatility
Prime rates or
Rates of TBs
IPO Stock Initial
Return Volatility
NSE ASPI
and CSE
ASPI
Inflation Rate
Volatility
Inflation Rate
Stock Prices in the
Market before the
IPO
Other
Equity/Non-Equity IPO
stocks price
movements
Information
Asymmetry
Misinformation
(Good/Bad News)
Dividend per
share
Corporate Fraud
IPO
under-pricing
(“money left
on the table”)
IPO
overpricing
(“Promise for
banking
business” and
other
Licensed under Creative Common Page 15 Model Estimation Methods
With the variables relationship presented in equation 1 above, we first show the method for determining the initial returns of IPOs and then the other factor-causes functional relationships. For clarity of initial returns determination, we utilise in a refined formula as earlier postulated by Roll and Ross (1986) as:
𝑅 = (𝐼𝑃𝑂 𝑚𝑎𝑟𝑘𝑒𝑡 𝑝𝑟𝑖𝑐𝑒 – 𝐼𝑃𝑂 𝑜𝑓𝑓𝑒𝑟 𝑝𝑟𝑖𝑐𝑒) / 𝐼𝑃𝑂 𝑜𝑓𝑓𝑒𝑟 𝑝𝑟𝑖𝑐𝑒 (2)
This position is further refined due to complexity of the information to obtain a logarithmic series, hence prompted the conversion of the earlier return (R) equation (2) to follow the Wang et al (2010) percent returns and as adapted by Bruce and Thilakaratne(2015) IPO initial return as
𝐼𝑅𝑗 = 𝑝𝑗0 𝑝𝑗1 − 1 ∗ 100% (3)
Where IR is the initial return of the IPO stock j, on the first day of trading 0, 𝑝𝑗0 is the closing price of IPO stock j on day 0 and 𝑝𝑗1is the offering/issuing price of IPO stock j.
Therefore to incorporate the statistical relationship of equation 1, into a multiple regression, the extended version is:
𝐼𝑅𝜎𝑡2= 𝛼 + 𝐼𝑁𝑇𝑡 + 𝐸𝑋𝐶𝐻𝑡 + 𝐼𝑁𝐹𝐿𝑡 + 𝑀2𝑡 + 𝑃𝑂𝑆𝑡 + 𝐷𝑃𝑆𝑡 + 𝑉𝑂𝐿𝑟𝑡
+ 𝑢𝑡 (4)
Where:
Alpha (α) = constant of the regression and meau at time t (𝑢𝑡)= error term or shock, representing the unknown idiosyncratic variables. This is a multiple regression model with one dependent variable (IPO initial return volatility) while all other variables remain independent. However, the regression cannot be complete without the coefficient indicators that measure the rate of effect of the independent variables on the dependent variable (Pindyck, and Rubinfeld, (1998) hence, beta (β) is introduced in equation (4) to determine such rates; the simplified extension is:
𝐼𝑅𝜎𝑡2 = 𝛼 + 𝛽1𝐼𝑁𝑇𝑡+ 𝛽2𝐸𝑋𝐶𝐻𝑡 + 𝛽3𝐼𝑁𝐹𝐿𝑡 + 𝛽4𝑀2𝑡+ 𝛽5𝑃𝑂𝑆𝑡+ 𝛽6𝐷𝑃𝑆𝑡+ 𝛽7𝑉𝑂𝐿𝑟𝑡
+ 𝜇𝑡 (5)
Licensed under Creative Common Page 16
Given the multiple variables displayed in equation (5) for determining the function for IPO initial return volatility, the Generalized Autoregressive Conditional Heteroskedasticity (GARCH, 1, 1) model of Bollerslev (1986) is employed. The model captures the thick tailed returns; volatility clustering and can readily modify to allow for several other stylized facts such as non-trading periods (lags) and predictable information releases (Bollerslev, et al, (1994). Below is the GARCH (1, 1) model.
𝜎𝑡2= 𝛼 + 𝛽
1𝜀𝑡−12 + 𝛽2𝜎𝑡−12 (6)
Where
𝛼 is constant of the regression
𝛽1, and 𝛽2are estimates or coefficients from past data 𝜎𝑡−12 Is the most recent variance forecast
𝜀𝑡−12 Is most recent squared prediction error in market returns
Since the GARCH model captures only the symmetry effects of the stock returns and neglect the asymmetry effect, i.e., in other words, ignoring the “leverage effect” of volatility, the EGARCH and TGARCH are employed to remedy and help determine such effects (bad news and good news) in the stock market indices.
The Exponential GARCH Model
The EGARCH (Nelson, (1991) is employed in this research as an advanced methodological tool to help communicate the asymmetric shocks on the conditional variance so that the degree of returns volatility could be ascertained given a situation of good news or bad news, knowing full well that ideal information disclosure on a stock results in less volatility (LeRoy and Porter, (1981), but Bollerslev et al (1994) maintains that lesser volatility on returns is attainable when there is no news; otherwise, a little bad news exerts serious shock and results in high volatility ofreturns (Lowry et al, (2010). This therefore, informs the use of the EGARCH (1, 1) model to take the form of natural logarithm of the conditional variance so that it is allowed to vary over time as a function of the lagged error terms rather than the lagged squared errors. This is written as:
𝐼𝑛ℎ𝑡2= 𝑐 + 𝛼 𝜀𝑡−1 ℎ𝑡−1 + 𝛾 𝜀𝑡−1 ℎ𝑡−1 + 𝛽1𝐼𝑛ℎ𝑡−12 (7)
Licensed under Creative Common Page 17
The VAR Model
The Vector Autoregression (Sims,1980: VAR) suggest that if there is true simultaneity among a set of variables, they should all be treated on an equal footing; there should not be any a priori distinction between endogenous and exogenous variables. This model helps in determining shocks and decomposition of regressors over time. It also shows closer cause effect relationship as the Granger Casualty test with the use of lag values. To undertake VAR estimation for the variables, the research presents the VAR model with order (k):
𝑅0𝛾𝑡 = 𝛼 + 𝑅1 𝑘
𝑗 =1
𝛾𝑡−1+ 𝑅𝑗𝛾𝑡−𝑗 𝑘
𝑗 =1
+ 𝜀𝑡 (8)
Where 𝑦𝑡 is a 7-dimensional vector of variables made of interest rate, inflation rate, broad money supply rate, Exchange rate, price of other IPO stocks, rate of IPO stock volumes traded, dividend per share, corporate fraud tendencies via under-pricing and/or overpricing; 𝑅0 is a 7*7 dimensional matrix with contemporaneous coefficients; 𝛼is a7-dimensional vector of constants; 𝑅1……𝑅𝑗 are 7*7 dimensional autoregressive coefficient matrices; while the 𝜀𝑡 is a stochastic error terms or impulse of pair wise uncorrelated structural innovations with unit variance and Kis the number of lagged terms. In most cases lags is expedient but care must be taken when doing that because too many lags tend to consume the degrees of freedom, which may further introduce the possibility of multicollinearity while including too few lags will as well lead to specification errors (Gujarati, et al, (2009). Using a sufficient lag length may help to reflect the long-term impact of variables on others. The sequential modified Likelihood Ratio test statistic (LR), suggests that lag orders between 1 and 3 are recommended for models of this nature (Wooldridge, (2002]). Hence, the researcher uses lag order 1-3, determined by the Hannan-Quinn, Schwert Information criteria and the Akaike Information criteria.
Hence for more easy understanding of the exogenous and endogenous variables, the VAR equation (8) is hereby expanded as:
𝐼𝑅1,𝑡 = 𝛼 + 𝛽1𝐼𝑅𝑡−1 𝑘
𝑗 =1
+ 𝛽2𝐼𝑛𝑡𝑡−1 𝑘
𝑗 =1
+ 𝛽3𝐸𝑥𝑐ℎ𝑡−1 𝑘
𝑗 =1
+ 𝛽4𝐼𝑛𝑓𝑡 −1 𝑘
𝑗 =1
+ 𝛽5𝑃𝑂𝑆𝑡−1 𝑘
𝑗 =1
+ 𝛽6𝑀2𝑡−1 𝑘
𝑗 =1
+ 𝛽7𝐷𝑃𝑆𝑡−1 𝑘
𝑗 =1
+ 𝛽8𝑉𝑂𝐿𝑟𝑡 −1 𝑘
𝑗 =1
+ 𝛽11𝐼𝑅𝑡−1 𝑝
𝑗 =1
+ 𝛽21𝐼𝑛𝑡𝑡−1 𝑝
𝑗 =1
+ 𝛽22𝐸𝑥𝑐ℎ𝑡−1 𝑝
𝑗 =1
+ 𝛽23𝐼𝑛𝑓𝑡 −1 𝑝
𝑗 =1
+ 𝛽24𝑃𝑂𝑆𝑡−1 𝑝
𝑗 =1
+ 𝛽25𝑀2𝑡−1 𝑝
𝑗 =1
+ 𝛽26𝐷𝑃𝑆𝑡−1 𝑝
𝑗 =1
+ 𝛽27𝑉𝑂𝐿𝑟𝑡−1 𝑝
𝑗 =1 + 𝜀𝑡 (9)
Licensed under Creative Common Page 18 EMPIRICAL RESULTS AND DISCUSSION
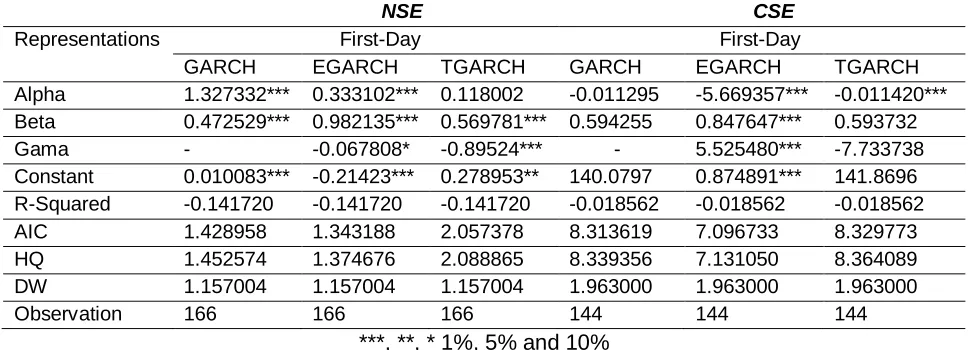
We understand from the analysis below that, IPOs initial returns during the first-day of trading through the monthly and yearly periods show very significant volatility which is caused by information asymmetry and other variables without and within the circumference of the issuing firm. This is evident, first in table (3) where the initial returns during the first-day show high volatility clustering in the NSE but none in the CSE. All three models report significant volatility in the NSE but the most accepted is the EGARCH volatility rate of 131.52% while the CSE is evidence with volatility of -482.17%.
Furthermore, information asymmetry is present during the first-day in the NSE (even though at a minimal) compared to that of the CSE. This is confirmed with the asymmetric rate of 26.53% for the NSE but -14.39% of asymmetry for the CSE. A look at the Gama coefficient of the EGARCH for CSE show positive relation while that of the TGARCH shows negative indicating no information asymmetry during this day given by the returns, hence bad and good news have identical shocks in the market. This scenario is also present in the NSE as given by the TGARCH negative Gama value; meaning that bad and good news at some points during the hours of trading tend to exert identical shocks.
Table 3: IPOs initial Returns Volatility Caused by Information (bad and good news) Dissemination in the
NSE and CSE during the initial day of sale on the Stock Market. The results here show significant impact
of news on the stock markets during the first-day but NSE experiences more impact of bad news
compared to CSE where good news tend to speak better during the first-day.
NSE CSE
Representations First-Day First-Day
GARCH EGARCH TGARCH GARCH EGARCH TGARCH
Alpha 1.327332*** 0.333102*** 0.118002 -0.011295 -5.669357*** -0.011420*** Beta 0.472529*** 0.982135*** 0.569781*** 0.594255 0.847647*** 0.593732
Gama - -0.067808* -0.89524*** - 5.525480*** -7.733738
Constant 0.010083*** -0.21423*** 0.278953** 140.0797 0.874891*** 141.8696 R-Squared -0.141720 -0.141720 -0.141720 -0.018562 -0.018562 -0.018562
AIC 1.428958 1.343188 2.057378 8.313619 7.096733 8.329773
HQ 1.452574 1.374676 2.088865 8.339356 7.131050 8.364089
DW 1.157004 1.157004 1.157004 1.963000 1.963000 1.963000
Observation 166 166 166 144 144 144
***, **, * 1%, 5% and 10%
Licensed under Creative Common Page 19
230.87% in the CSE likewise volatility rate do persist over a long period before the shocks could die out in both markets during the monthly trading period of the stocks at 110.85% and 82.90%, respectively.
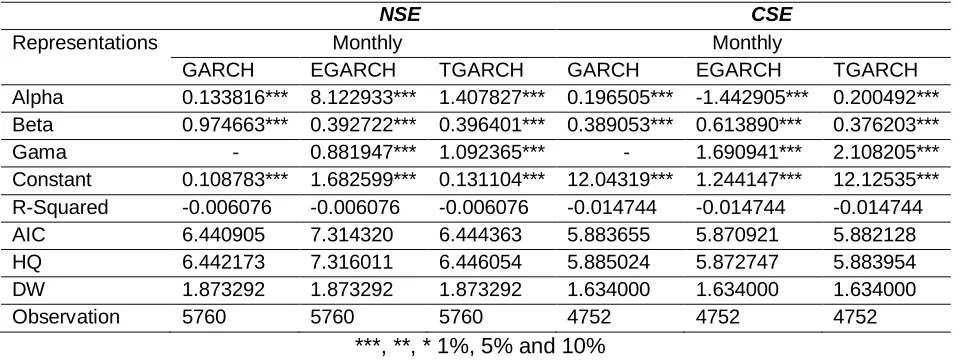
Table 4: IPOs initial Returns Volatility Caused by Information (bad and good news) Dissemination in the
NSE and CSE during the Monthly after-market trading on the Stock Market. Clearly, the models show
significant news effect on the stocks after-market trading such that bad news tend to be very significant
but in some cases especially at the CSE good and bad news exert identical shocks of 24.80% as
contained in the EGARCH.
NSE CSE
Representations Monthly Monthly
GARCH EGARCH TGARCH GARCH EGARCH TGARCH
Alpha 0.133816*** 8.122933*** 1.407827*** 0.196505*** -1.442905*** 0.200492*** Beta 0.974663*** 0.392722*** 0.396401*** 0.389053*** 0.613890*** 0.376203*** Gama - 0.881947*** 1.092365*** - 1.690941*** 2.108205*** Constant 0.108783*** 1.682599*** 0.131104*** 12.04319*** 1.244147*** 12.12535*** R-Squared -0.006076 -0.006076 -0.006076 -0.014744 -0.014744 -0.014744
AIC 6.440905 7.314320 6.444363 5.883655 5.870921 5.882128
HQ 6.442173 7.316011 6.446054 5.885024 5.872747 5.883954
DW 1.873292 1.873292 1.873292 1.634000 1.634000 1.634000
Observation 5760 5760 5760 4752 4752 4752
***, **, * 1%, 5% and 10%
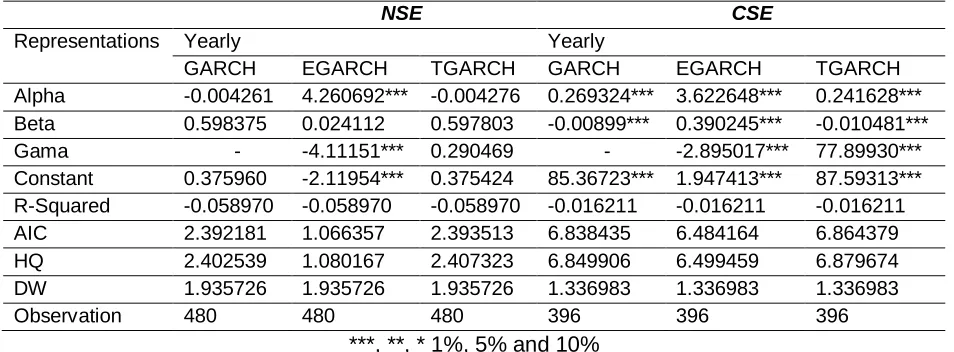
The tables (3) and (4) confirm the presence of bad and good news as well as leverage effects on the two stock markets. However, table (5) shows that the yearly after-market trading is highly volatile for the IPOs initial returns in both stock markets. The indication here is that NSE and CSE experience 428.48% and 401.30% volatility rate as shown by the EGARCH with lower AIC and HQ values. It is further shown that information asymmetry account for 14.92% and 72.76% for NSE and CSE, respectively, while bad news impact more than good news as shown by the TGARCH 28.62% for NSE and 781.14% for CSE. By and large, we understand that, IPOs initial returns volatility increases with time after the floating day period and tend to persist over a very long period of time usually 3 years and above.
Licensed under Creative Common Page 20 Table 5: IPOs initial Returns Volatility Caused by Information (bad and good news) Dissemination in the
NSE and CSE during the Yearly after-market trading on the Stock Market. The trend here is very robust
that we see the rate of volatility clustering to be very high with very significant leverage effects in both
markets. The use of a 3-year period data for each IPO stock informed our interest to capture the nature
and period-persistent ability of initial returns volatility in the two emerging markets.
NSE CSE
Representations Yearly Yearly
GARCH EGARCH TGARCH GARCH EGARCH TGARCH
Alpha -0.004261 4.260692*** -0.004276 0.269324*** 3.622648*** 0.241628*** Beta 0.598375 0.024112 0.597803 -0.00899*** 0.390245*** -0.010481*** Gama - -4.11151*** 0.290469 - -2.895017*** 77.89930*** Constant 0.375960 -2.11954*** 0.375424 85.36723*** 1.947413*** 87.59313*** R-Squared -0.058970 -0.058970 -0.058970 -0.016211 -0.016211 -0.016211
AIC 2.392181 1.066357 2.393513 6.838435 6.484164 6.864379
HQ 2.402539 1.080167 2.407323 6.849906 6.499459 6.879674
DW 1.935726 1.935726 1.935726 1.336983 1.336983 1.336983
Observation 480 480 480 396 396 396
***, **, * 1%, 5% and 10%
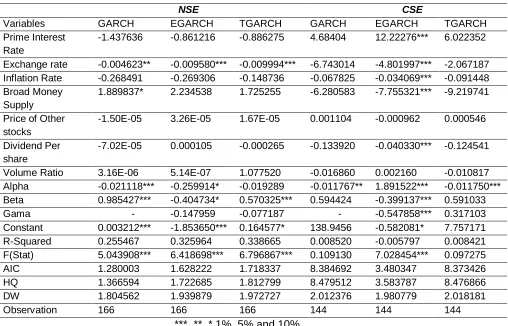
We further incorporate the selected macroeconomic/firm-specific variables into our models to determine the rates of those factor-shocks on the IPOs initial returns volatility and hence, we find that, there is convincing evidence that macroeconomic and firm-specific variables have significant effect on IPOs initial returns during the first initial floating of the stocks on the NSE and CSE. Table (6) shows the behaviour of the variables against IPOs initial returns in the two emerging markets such that prime interest rate, exchange rate (at dollar denomination of the local currencies), and inflation rate exhibit inverse correlation with initial returns of IPO stocks in the NSE as reported by the three methods.
Licensed under Creative Common Page 21 Table 6: The First-Day of IPOs trading and the effect of Macroeconomic and Firm-Specific variables on
the initial returns volatility in NSE and CSE ASPI showing a total observation of 166 and 144 IPOs,
respectively, considered for the GARCH and EGARCH with various correlations demonstrated with joint probability reports for variables’ significance and asymmetric effects regarding behaviours exhibited by
returns in the face of externalities and internal contentions.
NSE CSE
Variables GARCH EGARCH TGARCH GARCH EGARCH TGARCH
Prime Interest Rate
-1.437636 -0.861216 -0.886275 4.68404 12.22276*** 6.022352
Exchange rate -0.004623** -0.009580*** -0.009994*** -6.743014 -4.801997*** -2.067187 Inflation Rate -0.268491 -0.269306 -0.148736 -0.067825 -0.034069*** -0.091448 Broad Money
Supply
1.889837* 2.234538 1.725255 -6.280583 -7.755321*** -9.219741
Price of Other stocks
-1.50E-05 3.26E-05 1.67E-05 0.001104 -0.000962 0.000546
Dividend Per share
-7.02E-05 0.000105 -0.000265 -0.133920 -0.040330*** -0.124541
Volume Ratio 3.16E-06 5.14E-07 1.077520 -0.016860 0.002160 -0.010817
Alpha -0.021118*** -0.259914* -0.019289 -0.011767** 1.891522*** -0.011750***
Beta 0.985427*** -0.404734* 0.570325*** 0.594424 -0.399137*** 0.591033
Gama - -0.147959 -0.077187 - -0.547858*** 0.317103
Constant 0.003212*** -1.853650*** 0.164577* 138.9456 -0.582081* 7.757171
R-Squared 0.255467 0.325964 0.338665 0.008520 -0.005797 0.008421
F(Stat) 5.043908*** 6.418698*** 6.796867*** 0.109130 7.028454*** 0.097275
AIC 1.280003 1.628222 1.718337 8.384692 3.480347 8.373426
HQ 1.366594 1.722685 1.812799 8.479512 3.583787 8.476866
DW 1.804562 1.939879 1.972727 2.012376 1.980779 2.018181
Observation 166 166 166 144 144 144
***, **, * 1%, 5% and 10%
Licensed under Creative Common Page 22
while the latter’s shocks persist over a very long time before it dies out. However, bad news account for 134.37% volatility in the market.
Figure 2: The Impulse Response Function of the First-Day IPOs initial returns to Macroeconomic and
Firm-specific variables on the NSE. The shocks are very imminent in the first instance when the stocks
begin to sell in the market, thereby exhibiting independent behaviours towards the returns. It can be noticed that some of the variables are inconsistent in behaviour probably because of investors’ reaction to
news in the market as such slopes up-wards and down-wards (e.g. dividend per share, volumes ratio,
etc) but indicates that all the variables exert shocks on the IPOs initial returns.
-.2 .0 .2 .4 .6
1 2 3 4 5 6 7 8 9 10
Response of RETURNS to RETURNS
-.2 .0 .2 .4 .6
1 2 3 4 5 6 7 8 9 10
Response of RETURNS to INF
-.2 .0 .2 .4 .6
1 2 3 4 5 6 7 8 9 10
Response of RETURNS to INT
-.2 .0 .2 .4 .6
1 2 3 4 5 6 7 8 9 10
Response of RETURNS to EXCH
-.2 .0 .2 .4 .6
1 2 3 4 5 6 7 8 9 10
Response of RETURNS to POS
-.2 .0 .2 .4 .6
1 2 3 4 5 6 7 8 9 10
Response of RETURNS to M2
-.2 .0 .2 .4 .6
1 2 3 4 5 6 7 8 9 10
Response of RETURNS to DPS
-.2 .0 .2 .4 .6
1 2 3 4 5 6 7 8 9 10
Response of RETURNS to VOLR
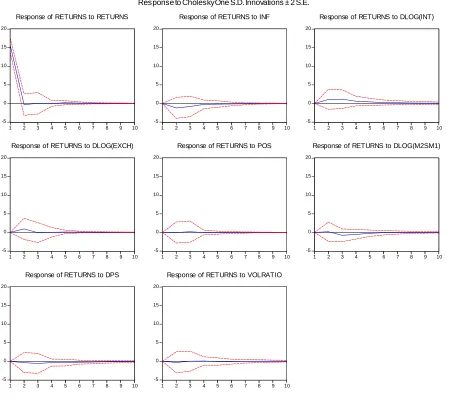
Licensed under Creative Common Page 23 Figure 3: The Impulse Response Function of the First-Day IPOs initial returns to Macroeconomic and
Firm-specific variables on the CSE. All the variables are significant in exerting considerable shocks on the
IPOs initial returns as found in the NSE. Here similar trend is observed where dividend per share, volumes ratio, and broad money supply show positive and negative relationship-trends owing to investors’
response to news about the value of the firm and the money flows in the economy.
A similar behavior is displayed on Fig. (2) and Fig. (3), where all the variables show very significant shock on the IPOs initial returns in the NSE and CSE, respectively, with similar correlations as shown by the GARCH models. The behavior of IPOs initial returns in response to macroeconomic/firm-specific variables in the course of monthly trading is similarly robust than
-5 0 5 10 15 20
1 2 3 4 5 6 7 8 9 10
Response
of
RETURNS
to
RETURNS
-5 0 5 10 15 20
1 2 3 4 5 6 7 8 9 10
Response
of
RETURNS
to
INF
-5 0 5 10 15 20
1 2 3 4 5 6 7 8 9 10
Response
of
RETURNS
to
DLOG(INT)
-5 0 5 10 15 20
1 2 3 4 5 6 7 8 9 10
Response
of
RETURNS
to
DLOG(EXCH)
-5 0 5 10 15 20
1 2 3 4 5 6 7 8 9 10
Response
of
RETURNS
to
POS
-5 0 5 10 15 20
1 2 3 4 5 6 7 8 9 10
Response
of
RETURNS
to
DLOG(M2SM1)
-5 0 5 10 15 20
1 2 3 4 5 6 7 8 9 10
Response
of
RETURNS
to
DPS
-5 0 5 10 15 20
1 2 3 4 5 6 7 8 9 10
Response
of
RETURNS
to
VOLRATIO
Licensed under Creative Common Page 24
the first-day. In table (7), it is very clear that prime interest rate, inflation rate, exchange rate, price of other stocks, dividend per share and volumes ratio are inversely correlated to the IPOs initial returns volatility on the NSE except for broad money supply; a scenario that depict that investors attitude to alternative investment opportunity is not spontaneous even in an unfavorable economic situations and other related firm internal factors.
On the other hand, CSE vary to some extent on the behavior of the explanation variables. Here only prime interest rate, dividend per share, and volumes ratio explain inverse relation with IPOs initial returns volatility while all others exhibit positive correlation depicting that, in most cases in the CSE, when these variables unfavorably manifest, investors quickly tend to withdraw participation of their capital in IPO stocks for alternative investments and vice-versa.
Furthermore in table (7), NSE IPOs initial returns experience minor volatility rate of 2% (EGARCH) and 75% (GARCH and TGARCH) however, still asserting that volatility dies out quickly during the monthly trading clearly confirming the inverse relationships between the variables and returns volatility. In the same vein, the NSE experience information symmetry of 2% (EGARCH) depicting equal rate of effects of good and bad news on IPOs initial returns; a situation that is also similar to what happens in the CSE where good and bad news (information symmetry) exert identical shocks on IPOs initial returns volatility at 10.28% (EGARCH) and 89.01% (TGARCH) but persistent volatility rate of 129.12% (GARCH) which also synchronize with the positive correlations of most variables with the IPOs initial returns.
Licensed under Creative Common Page 25 Table 7: The monthly IPOs trading in the NSE and CSE over the three-year period for each stock and the
consistent influence by macroeconomic/firm-specific variables; so that the correlation of most of the
variables on the NSE and CSE is consistent with our expected signs except for few that behave contrary
to our postulations probably due to inconsistent economic policies in the two economies.
NSE CSE
Variables GARCH EGARCH TGARCH GARCH EGARCH TGARCH
Prime Interest Rate
-13.22407 -13.22407 -13.22407 -2.751543*** -0.244140 6.554978***
Exchange rate -0.004154 -0.004154 -0.004154 3.272556*** -2.920588 6.848695 Inflation Rate -1.539633 -1.539633** -1.539633 1618.820*** 1.432561 5.198250 Broad Money
Supply
1.312953 1.312953 1.312953 3.065436*** -0.031858 0.963864*
Price of Other stocks
-0.000273 -0.000273 -0.000273 0.002938*** -0.000483 0.000583***
Dividend Per share
-0.005762 -0.005762 -0.005762 -0.002231*** 0.000460 0.002998***
Volume Ratio -1.10E-10 -7.73E-11 -7.73E-11 -0.000104*** -4.83E-06 7.10E-05*** Alpha 0.150000*** 0.010000 0.150000*** 12.70806*** 0.054860*** 0.128152*** Beta 0.600000*** 0.010000 0.600000*** 0.203380*** -0.017532* 0.566854***
Gama - 0.010000 0.050000 - 0.047968*** -1.01829***
Constant 450.3185*** 6.540738*** 450.3185*** -0.000881 3.235253*** 18.43020***
R-Squared 0.005877 0.005877 0.005877 -5.214736 0.000357 0.012563
F(Stat) 3.216606*** 2.923710*** 2.923710*** 1.272230** 0.162029 1.519106**
AIC 9.406785 9.380818 9.407186 5.090266 5.989761 6.077579
HQ 9.411434 9.385890 9.412258 5.095288 5.995240 6.083058
DW 1.895956 1.895956 1.895956 1.545528 1.658709 1.642782
Observation 5760 5760 5760 4751 4751 4751
***, **, * 1%, 5% and 10%
Licensed under Creative Common Page 26 Figure 4: The Impulse Response Function of the Monthly IPOs initial returns to Macroeconomic and
Firm-specific variables on the NSE. The variables here showed co-integration and hence the VECM is
employed to correct the anomalies. But clearly considered, shocks are less pronounced in the NSE
during the monthly IPOs trading than the first day which could be attributable to stability in information
flows as indicated also by the GARCH models.
0 10 20 30
1 2 3 4 5 6 7 8 9 10
Response of RETURN to RETURN
0 10 20 30
1 2 3 4 5 6 7 8 9 10
Response of RETURN to LOG(INFPSMSM)
0 10 20 30
1 2 3 4 5 6 7 8 9 10
Response of RETURN to INTPSMSM
0 10 20 30
1 2 3 4 5 6 7 8 9 10
Response of RETURN to LOG(M2SMSM)
0 10 20 30
1 2 3 4 5 6 7 8 9 10
Response of RETURN to DPS
0 10 20 30
1 2 3 4 5 6 7 8 9 10
Response of RETURN to EXCHSM
0 10 20 30
1 2 3 4 5 6 7 8 9 10
Response of RETURN to POS
0 10 20 30
1 2 3 4 5 6 7 8 9 10
Response of RETURN to VOLSSM
Licensed under Creative Common Page 27 Figure 5: The Impulse Response Function of the Monthly IPOs initial returns to Macroeconomic and
Firm-specific variables on the CSE. The shocks during this period are prominent even though not as the
first-day but they remain a little persistent and show that it could take longer time to die out. But the behaviour
of the variables are almost stable.
Conversely, the risk-taker attitude of investors in the NSE tends to alter as demonstrated at the yearly behavior of initial returns to factor related causes of volatility. In table (8), all the variables except price of other stocks, dividend per share and volumes ratio exhibit inverse correlation while the same behavior of risk-averse investors in the CSE in table (7) is same in table (8) for the yearly trading of the IPO stocks so that only inflation rate, broad money supply, price of other stocks and volumes ratio are inversely correlated to IPOs initial returns. IPOs initial returns volatility rate in the NSE is highly persistent on yearly basis at 198.63% (EGARCH) and information asymmetry rate of 42.06% probably because investors take stock at the end of the
-1 0 1 2 3 4 5 6
1 2 3 4 5 6 7 8 9 10
Response of RETURN to RETURN
-1 0 1 2 3 4 5 6
1 2 3 4 5 6 7 8 9 10
Response of RETURN to DLOG(INFSM)
-1 0 1 2 3 4 5 6
1 2 3 4 5 6 7 8 9 10
Response of RETURN to DLOG(INTSM)
-1 0 1 2 3 4 5 6
1 2 3 4 5 6 7 8 9 10
Response of RETURN to DLOG(M2SM)
-1 0 1 2 3 4 5 6
1 2 3 4 5 6 7 8 9 10
Response of RETURN to DLOG(EXCHSM)
-1 0 1 2 3 4 5 6
1 2 3 4 5 6 7 8 9 10
Response of RETURN to POS
-1 0 1 2 3 4 5 6
1 2 3 4 5 6 7 8 9 10
Response of RETURN to DPS
-1 0 1 2 3 4 5 6
1 2 3 4 5 6 7 8 9 10
Response of RETURN to VOLR
Licensed under Creative Common Page 28
financial year to assess the value of their stocks and the perceived impact of macroeconomic policies and firm-specific decisions and hence tend to change attitudes to investing in the IPOs when the result is not favorable. This could be the most reason why dividend per share is positively correlated to initial returns on yearly basis. But IPOs initial returns volatility is much persistent in the CSE at 401.38% and information asymmetry rate of 130.94% on the yearly basis as a carry-over of the fears demonstrated during the months past into the end of yearly stock-taking and evaluation. This means that, one major activity happens to all investors in IPOs and that is, the annual stock-taking and evaluation to ascertain the persistent/non-persistent nature of factor-influences on the value of the firm that is capable of crashing the stocks over time.
It is also pertinent to note that, the VAR result of the IRF presented in Fig. (6) and Fig. (7) did not digress from the result of the GARCH model in that the behavior of investors simultaneously changed at the end of the years because they evaluate performing IPOs to make decision to invest more or withdraw their capital as such any little news on the value of the firm or the economy tend to exert very much significant shock on their intention to either retain their investments or not to. This is why the shocks in general tend to increase at the end of the year.
Despite these sequence analysis so far, we acknowledge that 32.60%, 0.59% and 13.67% variability of IPOs initial returns is explained by selected macroeconomic/firm-specific variables in the NSE on first-day, monthly and yearly basis, respectively. On the other hand, similar factors during the first-day, monthly and yearly basis account for 0.58%, 0.036% and 0.19%, respectively, for the variability of IPOs initial returns in the CSE. These rates inevitably reveal that there are more factor-causes of variability of IPOs initial returns volatility yet to be identified other than the ones used here.
Licensed under Creative Common Page 29 Figure 6: The Impulse Response Function of the Yearly IPOs initial returns to Macroeconomic and
Firm-specific variables on the NSE. On the yearly basis, we see that the shocks though still remain low except
for the dividend per share which the investors use to value the performance of the IPOs to enable them
retain them or dispose of them; they are still highly significant and so determine the behaviour of the initial
returns of the IPOs.
-0.2 0.0 0.2 0.4 0.6 0.8 1.0
1 2 3 4 5 6 7 8 9 10
Response of RETURNS to RETURNS
-0.2 0.0 0.2 0.4 0.6 0.8 1.0
1 2 3 4 5 6 7 8 9 10
Response of RETURNS to DLOG(INF)
-0.2 0.0 0.2 0.4 0.6 0.8 1.0
1 2 3 4 5 6 7 8 9 10
Response of RETURNS to INT
-0.2 0.0 0.2 0.4 0.6 0.8 1.0
1 2 3 4 5 6 7 8 9 10
Response of RETURNS to DLOG(EXCH)
-0.2 0.0 0.2 0.4 0.6 0.8 1.0
1 2 3 4 5 6 7 8 9 10
Response of RETURNS to POS
-0.2 0.0 0.2 0.4 0.6 0.8 1.0
1 2 3 4 5 6 7 8 9 10
Response of RETURNS to VOLR
-0.2 0.0 0.2 0.4 0.6 0.8 1.0
1 2 3 4 5 6 7 8 9 10
Response of RETURNS to DPS
-0.2 0.0 0.2 0.4 0.6 0.8 1.0
1 2 3 4 5 6 7 8 9 10
Response of RETURNS to DLOG(M2)
Licensed under Creative Common Page 30 Figure 7: The Impulse Response Function of the Yearly IPOs initial returns to Macroeconomic and
Firm-specific variables on the CSE. On the yearly basis, we see that the shocks still remain a little high except
for volumes ratio. Dividend per share still remain unstable while almost half of the variables are inversely
related to the initial returns of IPOs but generally indicating that uncertainties in the market is higher here
than in the NSE, however, dividend per share seems to play identical role in both markets.
-4 0 4 8 12
1 2 3 4 5 6 7 8 9 10
Response of RETURNS to RETURNS
-4 0 4 8 12
1 2 3 4 5 6 7 8 9 10
Response of RETURNS to INFSM
-4 0 4 8 12
1 2 3 4 5 6 7 8 9 10
Response of RETURNS to INT
-4 0 4 8 12
1 2 3 4 5 6 7 8 9 10
Response of RETURNS to EXCH
-4 0 4 8 12
1 2 3 4 5 6 7 8 9 10
Response of RETURNS to POS
-4 0 4 8 12
1 2 3 4 5 6 7 8 9 10
Response of RETURNS to VOLR
-4 0 4 8 12
1 2 3 4 5 6 7 8 9 10
Response of RETURNS to DPS
-4 0 4 8 12
1 2 3 4 5 6 7 8 9 10
Response of RETURNS to LOG(M2SM)
Licensed under Creative Common Page 31 Table 8: the Yearly behaviour of IPOs initial returns in the NSE and CSE over the three-year period for
each stock and the consistent influence by macroeconomic/firm-specific variables; such that the
correlation of most of the variables on the NSE and CSE is consistent with our expected signs except for
few that behave contrary to our postulations probably due to inconsistent economic policies in the two
economies. For instance, broad money supply in both countries depict inverse relation such that an
increase in it result in decreased initial returns volatility which means investors feels better to invest when
money supply increase thereby boosting their confidence and reducing fears simply because they still
believe in more surplus capital from financial institutions and personal savings.
NSE CSE
Variables GARCH EGARCH TGARCH GARCH EGARCH TGARCH
Prime Interest Rate
-1.135240** 0.202954 -0.931071** 0.192660 0.093776*** 0.190611
Exchange rate -0.372504 -0.668744 -0.150299 0.044345 0.013606*** 0.052944 Inflation Rate -0.378422 -0.133095 -0.632024*** -0.82146 -1.81669*** -0.455514 Broad Money
Supply
-0.469599 -1.043361** -0.400043 -0.41989 0.163569*** -0.748234
Price of Other stocks
3.98E-05 4.75E-05 2.49E-05 -0.00057 -0.00048*** -0.00069
Dividend Per share
0.008052*** 0.004156*** 0.004301*** 0.022663 0.017458*** 0.026310
Volume Ratio 5.76E-05 9.22E-06 8.81E-05 -5.86E-09 -1.71E-09 -1.42E-08 Alpha 1.803412*** 1.761761*** -0.000535 0.718756*** 3.291744*** 0.604782***
Beta -0.001077 0.224587*** 0.022460 -0.003152 0.722052*** -0.004184
Gama - -1.341153*** 3.260897*** - -1.98238*** 1.020565 Constant 0.104613*** -2.181609*** 0.098572*** 82.95194*** -1.81632*** 84.34558***
R-Squared 0.234630 0.136682 0.148228 0.010551 -0.001922 0.011879
F(Stat) 14.16300*** 6.635101*** 7.293160*** 0.432928 0.4243016 0.442620
AIC 1.264214 1.018293 1.134522 6.828796 3.837088 6.838732
HQ 1.302257 1.059795 1.176024 6.870858 3.882973 6.884617
DW 2.097641 2.062179 2.075987 1.378471 1.358566 1.381589
Observation 480 480 480 396 396 396
***, **, * 1%, 5% and 10%
Licensed under Creative Common Page 32
inflation rate, exchange rate, interest rate, broad money supply, and price of other stocks as well as the two firm-specific variables- dividend per share and volumes ratio. But their significance is consistent with several studies such as Ross (1976a), Rock (1986), Purnanandam and Swaminathan (2004), Derrien (2005), Bruce and Thilakaratne (2014) and several other studies.
CONCLUSION
We document in this work that volatility rates in the stock markets of Nigeria and Sri Lanka is very high but while that of Nigeria dies out in the short-run, that of Sri Lanka persist into the long-run. The volatility rate and leverage effect measures, perhaps, show very convincing behavior of the IPOs initial returns; which is basically engineered by the macroeconomic/firm-specific variables whether on first-day, monthly or yearly basis. In the NSE, volatility rate is high on the first-day but dies out in the short-run; with bad news as a major player. Similarly, in the CSE, volatility rate persists over a long-run period indicating enduring shocks; with very high bad news effects above what is obtainable in the NSE.
The situation during the month-wise IPOs returns in the NSE create a scenario that depict a slow and none spontaneous investor attitude to alternative investment opportunity even in an unfavorable economic situations and other related firm internal factors making them potential risk-takers. On the other hand, CSE vary to some extent on the behavior of the explanation variables such that in most cases in the CSE, when these variables unfavorably manifest, investors quickly tend to withdraw participation of their capital in IPO stocks for alternative investments and vice-versa making them highly risk-averse.
Licensed under Creative Common Page 33 ACKNOWLEDGEMENT
We appreciate the contributions of friends and colleagues who helped to proof-read the paper and
contribute to some technical aspects of the work. We also appreciate the managements of Gombe State
University and University of Kelaniya for supportive and conducive atmosphere provided for us to
carry-out this research. A special gratitude to the data management officers of Nigerian stock exchange,
Colombo stock exchange, Central banks of Nigeria and Sri Lanka for making available the required data
used in this work
REFERENCES
Adrian, T. and Rosenberg, J. (2008) Stock Returns and Volatility: Pricing the Short-Run and long-Run Components of Market Risk,The Journal of Finance, Vol. LXIII, No. 6, 2997-3030.
Ahuja, H. L., (1999) Macroeconomics for Business and Management, S. Chand and Company, New Delhi.
Al-Sharkas, A., (2004)The Dynamic Relationship Between Macroeconomic Factors and the Jordanian Stock Market,International Journal of Applied Econometrics and Quantitative Studies 1 (1), 97-114. Angell, J. W., (1926) The Theory of International Prices, 13-18.
Benita, G., and Lauterbach, B., (2004)Policy Factors and Exchange Rate Volatility: Panel Data Verses a Specific Country Analysis, Research Unit, Foreign Exchange Activity Department, Bank of Israel, Jerusalem.
Benveniste, L.M., and Spindt, P. A., (1989) How investment Bankers Determine the Offer Price and Allocation of New Issues, Journal of Financial Economics 24, 343–362.
Benveniste, L.M., and Wilhelm, W.J., (1997) Initial Public Offerings: Going by the Book, Journal of Applied Corporate Finance 10, 98-108.
Bodie, Z., (1976) Common Stocks as a Hedge against Inflation, Journal of Finance, 31, 459-470.
Bollerslev, T. (1986) Generalized Autoregressive Conditional Heteroskedasticity, Journal of Econometrics, 31(3), 307-27.
Bollerslev, T., Engle, R.F., and Nelson, D.B., (1994) ARCH Models, in: Handbook of Econometrics, Edited by R.F. Engle and D.L. Mcfadden, Elsevier Science, 2959-3037.
Bradley, D. J., and Jordan, B. D., (2002) Partial Adjustment to Public Information and IPO Underpricing,Journal of Financial and Quantitative Analysis 37, 595–616.
Bruce, A. A. A., and Thilakaratne, P. M. C (2014) IPO Stocks Performance Imperfection: A Review of Models and Empirical Works, American Journal of Industrial and Business Management 4, 155-166. Bruce, A. A. A., and Thilakaratne, P. M. C., (2015) Corporate Fraud Tendencies versus Initial Public Offerings (IPOs) initial Returns Volatility, British Journal of Economics, Management and Trade, 5(1), 88-104.
Campbell, J. Y., and Shiller, R. J. (1991) Yield Spreads and Interest Rate Movements: A Bird’s Eye View,
Review of Economic Studies 58(3), 495-514.
Chen, M.H., Kim, W.G. and Kim, H.J. (2005) The Impact of Macroeconomic and Non-Macroeconomic Forces on Hotel Stock Returns. Hospitality Management, 24, 243-258. http://dx.doi.org/10.1016/j.ijhm.2004.06.008
Chen, N., Roll, R., and Ross, S.A., (1986) Economic Force and the Stock Market, Journal of Business 59, 383-403.