United Kingdom Vol. V, Issue 5, May 2017
Licensed under Creative Common Page 1
http://ijecm.co.uk/
ISSN 2348 0386
STATISTICAL NON-PARAMETRIC CORRELATION
DIAGNOSTIC FOR DYNAMIC BEHAVIOR OF MALAYSIAN
CURRENCY WITH WORLD CRUDE OIL PRICE
Nashirah Abu Bakar
Islamic Business School, College of Business, Universiti Utara Malaysia, Malaysia [email protected]
Sofian Rosbi
School of Mechatronic Engineering, Universiti Malaysia Perlis, Malaysia
Abstract
In 2015, US production of crude oil rose to 9.48 million barrels per day. Therefore, the crude oil price on international level is decreasing because there is more supply than demand. This situation is affecting Malaysian economy because main income of Malaysia depends on commodity namely crude oil. Therefore, this study tries to find the correlation between Exchange rate of Malaysian Ringgit (USD to MYR) and crude oil price. The data selected for this study is from 2010 until 2016. The statistical correlation methods are Kendall Tau and Spearman rho because the distribution of the data is follows non-normal distribution. The result shows the association coefficient is =0.647 with p-value is 0.000 for Kendall Tau correlation. Then, the result also shows the association coefficient is =0.840 with p-value is 0.000 for Spearman rho correlation .These findings implied that there is highly significant positive correlation of Malaysia exchange rate (USD to MYR) with crude oil price. The impact of this study is to inform to the economist that exchange rate of Malaysia Ringgit can be forecast and monitor by referring to crude oil price dynamic pattern.
Licensed under Creative Common Page 2
INTRODUCTION
Revenue from crude oil accounted of RM248 billion in 2015 compared to RM329 billion in 2014, prolonged lower oil price has hit the national oil company that is Petroliam Nasional Berhad (PETRONAS). Given that oil is the main source of Malaysian revenues, it is likely that oil price shocks might affect its exchange rate. Most of the exchange rates of currencies have been permitted to float freely against one another including Malaysian Ringgit. Thus, high exchange rate currency between Malaysian and United State (US) has a significant impact on the economic condition in Malaysia.
For the first time in early year 2017, the Malaysia currency fell to an average of RM4.45 to the US$1 dollar. The exchange rate between Malaysian Ringgit (MYR) and United State Dollar (USD) was RM3.16 during the Sub-prime mortgage crisis in 2008. Compared to the Asian Financial Crisis of 1997, the Malaysian currency fell from the average of RM2.24 to the US$1 dollar (Ariff and Abu Bakar, 1999). Currency rate and crude oil have a significant relationship due to the importance in generating economic stability in Malaysia. Crude oil price changes directly affects the inflow of foreign exchange rate in Malaysia. Crude oil is a key source of energy in Malaysia due to the important part in the economy and plays a strong role in influencing the economic condition specifically in generating great wealth for Malaysia.
Currently, Malaysia is facing economic instability condition. This situation happened when U.S. discovered new oilfield. According to US Geological Survey (2016) the estimate would make the oilfield, which encompasses the cities of Lubbock and Midland 118 miles apart, the largest "continuous oil" discovery in the United States.
The impact of the crude oil and currency exchange on the growth of the Malaysian economy as regards returns and productivity is still questionable. Therefore, it is important to investigate the correlation between exchange rate of Malaysia ringgit (USD to MYR) and crude oil price.
LITERATURE REVIEW
Licensed under Creative Common Page 3 fiat money in 1973 (Papaioannou, 2001), which is incidentally linked with growing instability of financial markets (Fiedor, 2014).
According to Schmittmann (2010) hedging of currency risk substantially reduced the volatility of foreign investments at a quarterly investment horizon. Monitoring of currency instability is necessary to reduce the currency risk that requires the understanding of the nature of the exchange rate risk. Maurer and Valiani (2007) study the effective of managing the currency risk with a variety of approaches such as currency swaps, multi-currency diversification, and hedging via forwards, futures and options. One of the major critical success factors of any institution is its ability to manage effectively the risks inherent in its business. Also, one of the major risks that a bank faces is currency risks (Kamau, et. al., 2015).
But it is also a problem for international investors, who do have the know-how and usually manage exchange rate risk independently from the underlying investments, considering the currencies themselves as separate assets (Allen, 2003). However, monitoring the currency rate risk is importance in order to stabilize the currency exchange. There are many study using correlations (Mantegna, 1999; McDonald et al., 2005), but financial markets and exchange rates do not behave linearly (Hsieh, 1989), thus this study opt to analyze the correlation between exchange rate and crude oil price in Malaysia.
Understanding and computing the correlation between currency exchange and crude oil are worthy of investigation because it may carry important implications for the exchange rate policy. The foreign investors can take the advantage from the international investment. According to Bagchi (2017) international investment involves a greater sensitivity to crude oil prices and exchange rates; and that entails a positive transmission mechanism between crude oil price volatility and stock returns volatility. Maghyereh and Awartani, (2016) found there are negative and significant relationship between oil price uncertainty and real stock returns in Middle East and North Africa (MENA) region. The influence of oil price risk is more serious in those economies that depend heavily on oil revenues to grow.
Spearman and kendall’s tau correlations are two accepted measures of non-parametric rank correlations. Study from Sukcharoen and Leatham (2016) that focus on the Pearson’s correlation coefficient, Spearman’s rho and Kendall’s tau found the correlation among the US
Licensed under Creative Common Page 4
METHODOLOGY The Data
The study intends to find the correlation between Exchange rate of Malaysian Ringgit (USD to MYR) and crude oil price. In this study, two types of data are selected namely Malaysian currency exchange rate and world crude oil price. The selected period for analysis is selected from 1st January 2010 until 28th February 2017. The number of monthly data involved in this calculation is 86 observations.
Normality test
In this study, the normality test is performed using Shapiro-Wilk test. Shapiro-Wilk test is selected because the number of data involved in this calculation is 86 observations. Shapiro-Wilk normality test is suitable for sample with small observation number that less than 2000.
The null-hypothesis of this test is that the population is normally distributed. Thus, if the p-value is less than the chosen alpha level, then the null hypothesis is rejected and there is evidence that the data tested are not from a normally distributed population. Then, if the p-value is greater than the chosen alpha level, then the null hypothesis that the data came from a normally distributed population cannot be rejected. Therefore, the data involved is normal distribution.
The W test, developed by Shapiro and Wilk (1965), is essentially the square of the Pearson correlation coefficient, computed between the statistical order of the sample and that for a population that is Gaussian. If the value of W is close to 1.0 the sample behaves like a Normal sample, whereas if W is below 1.0 the sample is non-Gaussian.
The Shapiro–Wilk test tests the null hypothesis that a sample
x
i,...,
x
ncame from anormally distributed population. The test statistic is:
2
1
2
1 n
i i
i
n
i i
a x
W
x
x
(1)
The variables in the Equation(1) are described as below:
( )i
x
is the order statistic in ith,
Licensed under Creative Common Page 5 The coefficient
a
i is described by next equation,
T 1
1 T 1 1 1/2
( ,...,
a
a
n)
m V
m V V m
(2)
T1
,...,
nm
m
m
,
Where,
m
1,...,
m
nare the expected values of the order statistics of independent and identicallydistributed random variables sampled from the standard normal distribution, and V is the covariance matrix of those order statistics.
Kendall Tau b correlation procedure
Kendall's Tau-b (τb) correlation coefficient is a nonparametric measure of the strength and direction of association that exists between two variables measured on at least an ordinal scale. Assumptions of Kendall’s tau-b are categorized as below:
a. Two variables should be measured on an ordinal or continuous scale. b. There is a monotonic relationship between selected two variables.
For development of Kendall’s Tau correlation mathematical equation, we need to consider
x y
1,
1
,
x y
2,
2
,…,
x y
n,
n
be a set of observations of the joint random variables x and yrespectively, such that all the values of
x
i and
y
i are unique. Any pair of observations
x y
i,
i
and
x y
j,
j
, wherei
j
,are said to be concordant if the ranks for both elements agree:that is, if bothxi xj and
y
i
y
j, if both xi xj andy
i
y
j.Any pair of observations
x y
i,
i
and
x y
j,
j
, wherei
j
,are said to be concordant if theranks for both elements agree: that is, if bothxi xj and
y
i
y
j, if both xi xj andy
i
y
j. Ifthe pair of observation is xi xj oryi yj,the pair is neither concordant nor discordant.
The equation of Kendall’s Tau-b is described as below equation:
0 1
0 2
c d
b
n n
n n n n
(3) where
0
1 2
n n
n
Licensed under Creative Common Page 6 c
n
Number of concordant (x,y) pairs
d
n
Number of discordant (x,y) pairs
11
,
2
j j jt t
n
(tj = number of x values tied at jth value)
11
,
2
k k ku u
n
(uk = number of y values tied at kth value)
Values of Tau-b range from −1 (100% negative association, or perfect inversion) to +1 (100%
positive association, or perfect agreement). A value of zero indicates the absence of association.
The properties of Kendall’s Tau b are as below:
a. The denominator is the total number of pair combinations, so the coefficient must be in the range −1 ≤ τ ≤ 1.
b. If the agreement between the two rankings is perfect (i.e., the two rankings are the same) the coefficient has value 1.
c. If the disagreement between the two rankings is perfect (i.e., one ranking is the reverse of the other) the coefficient has value −1.
d. If X and Y are independent, then we would expect the coefficient to be approximately zero.
Derivative of the rank coefficient of correlation by spearman
Assuming that no two individuals are bracketed equal in either classification, each of the variables X and Y takes the values 1,2,………..,n.
Hence, we use mean as measures of central tendency. The calculation is indicates as below:
1
1
1 2 3 ...
2
n
x
y
n
n
The variance is calculated as below:
2
2 2 2 2 2 2
1
2 2
1
1
1
1
2
...
2
1 2
1
1
1
6
2
12
n
x i
i
n
x
x
n
n
n
n n
n
n
n
n
22 1 2
12
x y
n
Licensed under Creative Common Page 7 In general, xi yj . Let
d
i
x
iy
i
i i i
d x x y y
Then, squaring and summing all values as below equation:
2
2
2
2
2
i i i i i i i
d x x y y x x y y x x y y
Dividing both sides with n, then
2 2 2
2 2
1
2
( , )
2
i x y
x y x y
d
Cov X Y
n
Where,
is the rank correlation coefficient between X and Y.Next, because of
x
y
, therefore x y .This contributes to:2 2 2
2
1
2
2
(1
)2
i x x
x
d
n
Therefore, 2 2 1 2 i X d n
The Spearman correlation coefficient is defined as below:
2 2 1 2 2
6
1
1
2
(
1)
n i i i X
d
d
n
n n
(4)RESULT AND DISCUSSION
Licensed under Creative Common Page 8
Normality test of currency exchange rate
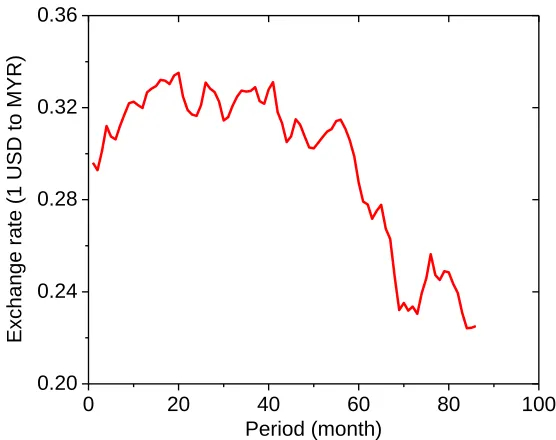
Figure 1 shows the dynamic movement of currency exchange rate for1 USD (United State Dollar) to Malaysia Ringgit (MYR). The selected period for analysis is selected from 1st January 2010 until 28th February 2017. The trading period involved in this analysis is 86 months. The minimum value of currency exchange rate was1 USD equivalent to MYR 0.224225 on December 2016 (84th month). At this point, Malaysia currency is weak with respect to USD. Then, the maximum value of currency exchange rate was 1 USD equivalent to MYR 0.335116 on August 2011 (20th month). At this point, Malaysia currency is strong with respect to USD.
Figure 1: The dynamic behavior of share price
0 20 40 60 80 100
0.20 0.24 0.28 0.32 0.36
Exchange rate (1
USD to MYR)
Period (month)
The Shapiro-Wilk normality test is performed to check the distribution of data. Table 1 shows the p-value of currency exchange rate is 0.000 according to normality test (Shapiro-Wilk). Therefore, it is shows that the distribution of currency exchange rate is deviate from normal distribution because p-value is less than 0.05. The distribution of data is validated by graphical analysis in histogram (Figure 2) and normal probability diagram (Figure 3). Both of Figure 2 and Figure 3 show an agreement that data distribution is deviate from normal distribution.
Table 1: Tests of Normality Shapiro-Wilk
Statistic df Sig.
Licensed under Creative Common Page 9 Figure 2: Histogram of exchange rate Figure 3: Normal probability plot of exchange rate
0.22 0.24 0.26 0.28 0.30 0.32 0.34
0 5 10 15 20 25
Count
Currency exchange rate (1USD to MYR)
0.20 0.25 0.30 0.35 0.40 0.01
1 10 40 70 95 99.5
Normal Probability Plot of currency exchange rate
mu = 0.29609 sigma = 0.03472
Normal
P
erc
enti
les
Currency exchange rate (1USD to MYR) Percentiles
Reference Line
Normality test of crude oil price
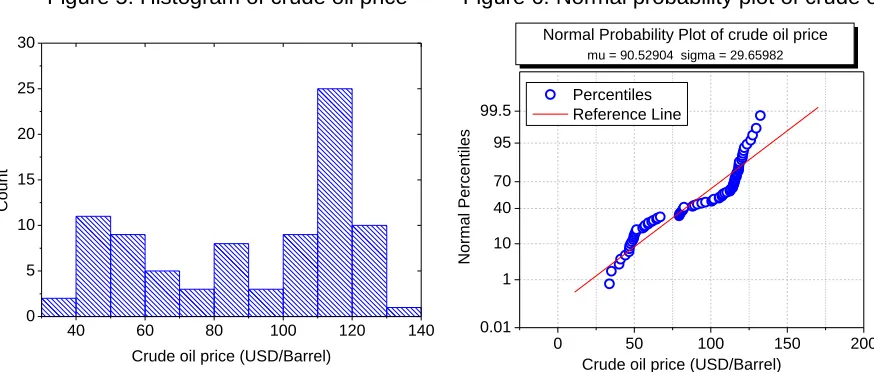
Figure 4 shows the dynamic movement of crude oil price.The unit for crude oil price is USD per barrel. Then, the selected period for analysis is selected from 1st January 2010 until 28th February 2017. The trading days involved in this analysis is 86 months. The minimum value of crude oil was33.70857 on January 2016 (73rd month). At this point, world crude oil price is weak because there are higher supplies than demand in world market. Then, the maximum value of currency exchange rate was 1 USD equivalent to MYR 0.335116 on August 2011. At this point, Malaysia currency is strong with respect to USD.
Figure 4: The dynamic behavior of crude oil price
0 20 40 60 80 100
20 40 60 80 100 120 140 160
Crude oil price (USD/Barrel)
Licensed under Creative Common Page 10 Table 2: Tests of Normality
Shapiro-Wilk Statistic df Sig. Crude oil price .879 86 .000
Figure 5: Histogram of crude oil price Figure 6: Normal probability plot of crude oil price
40 60 80 100 120 140
0 5 10 15 20 25 30
Count
Crude oil price (USD/Barrel) 0 50 100 150 200
0.01 1 10 40 70 95 99.5
Normal Probability Plot of crude oil price mu = 90.52904 sigma = 29.65982
Normal Percentiles
Crude oil price (USD/Barrel) Percentiles
Reference Line
Correlation analysis for currency exchange rate and crude oil price
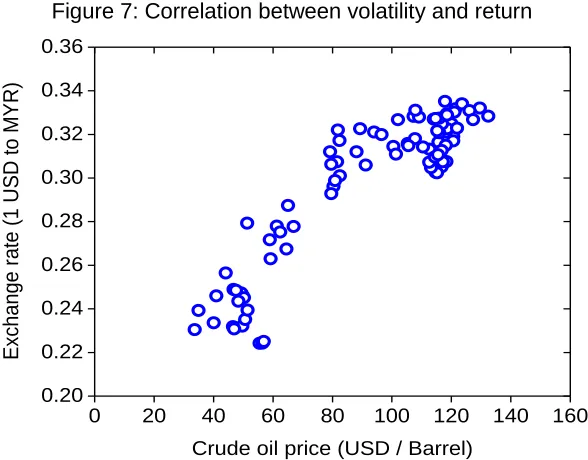
In this analysis, Spearman and Kendall tau b correlation are selected because the data for currency exchange rate and crude oil price are non-normally distributed. Figure 7 shows the data distribution between currency exchange rate and crude oil price. This figure shows there is correlation between these two variables.
To validate the correlation between these two variables, Kendall tau b and Spearman correlation analysis are performed. Table 3 shows the result for Kendall tau b correlation analysis between currency exchange rate and crude oil price. There was a strong, positive correlation between currency exchange rate and crude oil price, which is statistically significant
b
= 0.647, n = 86, p = .000).Table 4 shows the result for Spearman correlation analysis between the currency exchange rate and crude oil price. There was a very strong and positive correlation between
Licensed under Creative Common Page 11 Figure 7: Correlation between volatility and return
0 20 40 60 80 100 120 140 160
0.20 0.22 0.24 0.26 0.28 0.30 0.32 0.34 0.36
Exchange rate (1
USD to MYR)
Crude oil price (USD / Barrel)
Table 3 : Kendall tau b correlation analysis
Crude oil price (USD/Barrel)
Kendall's tau b
Currency exchange rate (1USD to MYR)
Correlation Coefficient .647**
Sig. (2-tailed) .000
N 86
**. Correlation is significant at the 0.01 level (2-tailed).
Table 4 : Spearman correlation analysis
Crude oil price (USD/Barrel)
Spearman's rho Currency exchangerate (1USD to MYR)
Correlation Coefficient .840**
Sig. (2-tailed) .000
N 86
**. Correlation is significant at the 0.01 level (2-tailed).
CONCLUSION
Licensed under Creative Common Page 12 This study concluded that following important results:
a. The Shapiro-Wilk normality test calculated the p-value of distribution data for currency exchange rate is 0.000.Therefore, the distribution data of currency exchange rate deviated from normal distribution. The trading periods that involved in this analysis is starting from January 2010 until February 2017 (86 months).
b. The Shapiro-Wilk normality test calculated the p-value of distribution data for crude oil price is 0.000.Therefore, the distribution data of crude oil price deviated from normal distribution. The trading periods that involved in this analysis is starting from January 2010 until February 2017 (86 months).
c. In this analysis, Spearman and Kendall tau b correlation were selected because the data for currency exchange rate and crude oil price are non-normally distributed.
d. Kendall tau b correlation analysis between currency exchange rate and crude oil price indicated there was a strong, positive correlation between currency exchange rate and
crude oil price, which is statistically significant (
b = 0.647, n = 86, p = .000).e. Spearman correlation analysis between currency exchange rate and crude oil price indicated there was a very strong, positive correlation between currency exchange rate
and crude oil price, which is statistically significant (
0.840, n = 86, p = .000).FURTHER RESEARCH
The extension of this research could investigate the other association variables (interest rate, gross domestic product and stock return) that contribute to the dynamics movement of Malaysia currency exchange rate.
REFERENCES
Abu Bakar, N. and Rosbi, S. (2017),Monotonic Correlation Diagnostics of share price volatility for Shariah-compliant Islamic Bank: A New Insight of Islamic Financial Engineering, International Journal of Management Science and Business Administration, Vol. 3, Issue: 2, pp. 7-16
Licensed under Creative Common Page 13 Allen, S.L. (2003), Financial Risk Management: A Practitioner’s Guide to Managing Market and Credit Risk, Wiley, Hoboken, N.J.
Bhaskar B. (2017), Volatility spillovers between crude oil price and stock markets: evidence from BRIC countries, International Journal of Emerging Markets, Vol. 12, Issue: 2, pp.352-365
Fiedor, P. (2014), Financial crises and the future of the real economy, Journal of Economics Business and Management, Vol. 2, No. 2, pp. 147-151
Haw, C. T., Teck, L.C. and Wooi, H.C. (2013),Forecasting Malaysian Ringgit: Before and After the Global Crisis, Asian Academy of Management Journal of Accounting and Finance, Vol. 9, No. 2, pp.157-175 Hsieh, D. (1989), Testing for nonlinear dependence in daily foreign exchange rates, Journal of Business, Vol. 62, No. 3, pp. 339-368
Kamau, P.,Inanga, E.L. and Rwegasira, K. (2015) Currency risk impact on the financial performance of multilateral banks, Journal of Financial Reporting and Accounting, Vol. 13, No. 1, pp. 91 – 118
Mantegna, R.N. (1999), Hierarchical structure in financial markets, European Physical Journal B, Vol. 11, No. 1, pp. 193-197
Maurer, R. and Valiani, S. (2007), Hedging the exchange rate risk in international portfolio diversification Currency forwards versus currency options, Managerial Finance, Vol. 33,No. 9, pp. 667 – 692
McDonald, M., Suleman, O., Williams, S., Howison, S. and Johnson, N.F. (2005), Detecting a currency’s dominance or dependence using foreign exchange network trees, Physical Review E, Vol. 72, No. 4 Papaioannou, M.G. (2001), Volatility and misalignments of EMS and other currencies during 1974-1998, International Finance Review, Vol. 2, pp. 51- 96.
Sukcharoen, K and Leatham, D.J. (2016) Dependence and extreme correlation among US industry sectors, Studies in Economics and Finance, Vol. 33 Issue: 1, pp.26-49