The Impact Of Water And Soil Electrical
Conductivity And Calcium Carbonate On Wheat
Crop Using A Combination Of Fuzzy Inference
System And GIS
Kazem Aliabadi, Hadi Soltanifard
Abstract: Regarding population growth, reduction of food resources, issues of water scarcity, droughts, and water and soil pollution, there is no doubt that agriculture in the form of science and by up to date technologies such as GIS and expert systems like fuzzy inference system would be important. In this study, the performance of wheat with attend to soil electrical conductivity, electrical conductivity of the water, and the percentage of calcium carbonate and using a combination of GIS and fuzzy inference system is acceptance and analysis of several parameters simultaneously. If parameters increase, the accuracy will be improved. Inference system estimated the performance using soil EC, water EC, and calcium carbonate in soil as input parameters and also analyzing them. With respect to the results of fuzzy inference system, 76 percent of accuracy for the method of Mamdani and 52 percent of accuracy for the method Sugeno were achieved.
Index Terms: Fuzzy inference system, Water electrical conductivity, Soil electrical conductivity, Calcium carbonate, GIS
————————————————————
1
I
NTRODUCTIONWheat as a strategic and economical product including important crops grown in farms. Its importance is because of the highest share of total cultivated area in the region. However, nowadays, organization and promotion of soil and water resources management have a basic and important role in the development of agricultural production and crop generation. Although more than half a century of research is on the content of saline soil and water issues, in the last decade of the twentieth century, dramatic changes in applicable saline water and modified saline soils have emerged to increase efficiency in agriculture. Application of the information in different decisions and plans has been made more and more careful decisions and more accurate programs. Determining thepotential CULTIVATION of each region with attends to soil and water conditions is a method that can create a logical and consistent stable relationship among natural ability of environment, need of communities, and human activities and uses. Geographic information system with features such as, the ability to obtain and exchange a variety of sources, organization, retrieving and displaying data, analysis of various data and possibility to provide multiple services is introduced as an efficient tool in the planning and evaluation of multi-agent (Cream, 2005, page 95). Combining GIS with fuzzy logic approach provides a relatively new land evaluation (Badenki, 2004). Combining these two methods is more flexible and reflects human ingenuity and intelligence more and more in making decisions. Fuzzy inference is considered as a deduction for mathematical modeling in imprecise and ambiguous processes, uncertainty about data and imprecision associated with the awareness of decision makers in assigning precise criteria, and thus provides a context for modeling uncertainly (Badenko&Baja et al,2002; Kurtener 2004).
2
R
EVIEW OFL
ITERATUREIn a research by Kartner and colleagues (2005), it was conducted to explore the relationships between soil factors and wheat farms using fuzzy inference system which was a very important step in support of spatial decisions in agricultural technology. Reshmidevi and colleagues(2009) in their study of fuzzy inference system using an integrated approach with GIS identified potential agricultural ability of catchment basin in western Bangal. In this study, a weighted linear combination and combining Yatgar were used. In the studied area.Yatgar was more suitable than weighted linear combination. Tirmbla and colleagues (2010) used fuzzy inference system for nitrogen fertilizer and soil fertility in the crop wheat. According to their findings, the best place to grow wheat was one with a small amount of soil electrical conductivity, high altitude and low slope. The most important result of their study was a reduction of 170 kg nitrogen per hectare to 41 kg per hectare which represented the strength of fuzzy inference system compared with other expert systems.
3
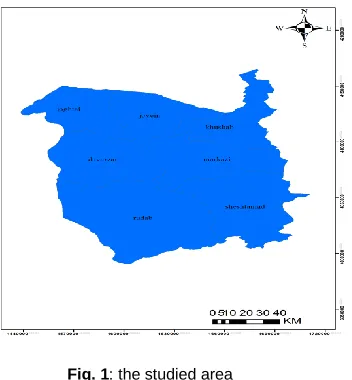
MATERIALS AND METHODSArea under study: Sabzevar city is geographically located in
the circuit 35 degrees and 25 minutes to 36 degrees and 57 minutes in north altitude and the meridian of 56 degrees, 37 minutes and 58 degrees and 17 minutes in eastern longitude and its weather is cold and dry. The main water sources for growing crops are provided in the location of groundwater (Sabzevar Agriculture Organization, 2011). According to studies by relevant agencies, the hydraulic head loss is increasing because of indiscriminate withdrawal of groundwater in this area. This caused an influx of brine from the South and East sides and will bring long-term risk of chemical contamination.In general, the assessment of land suitability for agricultural production in a region is vital and it should have been considered environmental factors and the human conditions (FarajZadeh et al, 2007, 359).One of these factors is the amount of soil and water salinity.
___________________________
Aliabadi, Kazem, Faculty of Geography Department, University of Hakim Sabzevari, Sabzevar, Iran
Soltanifard, Hadi, Faculty of Geography Department, University of Hakim Sabzevari, Sabzevar, Iran
Data: In this study, water EC, soil EC and calcium carbonate of soil are used as input to fuzzy inference system. 1500 water samples and 150 soil samples that the amount of calcium carbonate and electrical guidance has been tested. Distribution of used water and soil data is illustrated in figures 2 and 3, respectively:
Areas without water wells are actually with high gradients and lacking cultivable land. The framework and procedure of this study have been showed in the following:
Fig. 2: Distribution of Tested Soil Samples Fig. 1: the studied area
Building a Rule Base
Weighting rules with
Expert Knowledge
Compare Methods
Conclusion Determining Mechanism
Mapping by Mamdani
Method
Mapping by
SugenoMethod
Functions of Input and Output
Water Electrical Guidance Electrical
Guidance Soil Calcium
Carbonate
Water EC Soil EC
Calcium Carbonate
First Studie s Data
Gatherin g
Groundwater Layer Tested Earthy
Layer
Fig. 5: The Procedure of Wheat Crop Yield Estimation
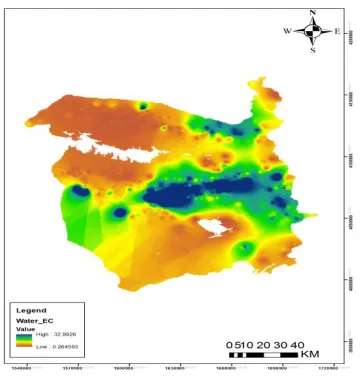
Data analysis in GIS: Soil and water samples are tested in GIS environment and outliers have been removed. Considering that the acceptable input for fuzzy inference system is matrix, an accurate interpolation should firstly be done and then raster files converted in to excel which is acceptable as input for FIS system. For calculation and analysis, the amount of RMSE has been the main criteria for using or not using the interpolation. Due to the accuracy and importance of this subject, it has been tried data values in interpolation not changed. Data are interpolated using IDW method and interpolated maps with pixel size of 200 m have been shown in the following:
White colored areas in the studied area have the flow above of 5 percent that are not suitable ones for wheat crop
Fuzzy systems and fuzzy inference system: One of the
main features of GIS is the ability of modeling. Most conventional tools in modeling, reasoning and calculation have exact nature and are clear and precise in terms of structure. In other words, it is assumed that parameters in a specified model do not exactly reflect our understanding of the phenomena or characteristics of actual modeled system and is not ambiguous. But, actual situations in most cases are ambiguous or uncertain and the future state of system may not fully be known because of the lack of knowledge or awareness. Facing with these uncertainties, several models based on probability theory, the logic of non-uniform, intervals theory, and theory of fuzzy sets have been proposed and each of these models is appropriate for a special type of uncertainty (Samadzadegan and colleagues, 2007, p174). Fuzzy inference system consider join of an element rankly and the degree of membership is stated by zero or one (Efati and Rajabi, 2011, p5). In this theory, each element is allowed a degree of dependency on a set and membership in a fuzzy set states a level of certainty or uncertainty (Anyglbrcht, 2007). To design and make a fuzzy inference system, it must be performed the following steps:
- Determining a rule system, fuzzy foundation based on observed data
- Front and consequent parts of fuzzy membership using fuzzy memberships
- Combination of different parts of front section in each rule followed by determining of extent and effect of the rule at the final output system
- Combination of consequent section of rules to obtain the final output of the system in the form of a fuzzy set - Converting the final output of system to a classical non-fuzzy number by non-fuzzy methods (Koorepazan, 2007).
In fuzzy inference system, the basic idea is similar to the expression of human thought and knowledge as linguistic variables (Menhaj and Nesaji, 2000, p32). Each linguistic Fig. 6.a: Interpolated map of studied area based on soil
electrical conductivity
Fig. 6.b: Interpolated map of studied area based on water electrical conductivity
Fig. 6.c: Interpolated map of studied area based onsoil calcium carbonate
(1)
variable can have different values that called linguistic values. In this study, linguistic variables are classifies to a set of awkward, somewhat affordable, convenient and very affordable. Since the fuzzy theory is intended to simulate the human way of reasoning, hence the fuzzy membership functions have been used. The purpose of determination of membership functions is constant weighting to factors. In this state, the weight of each pixel is obtained based on the pixel value of membership in the fuzzy set and on suitable factor.
Fuzzy making: In this stage, membership functions are
considered for each input variable to take certain inputs in to fuzzy ones and put in fuzzy inference system. Triangular membership functions are defined as follows:
S membership functions are defined as follows:
Trapezoidal Membership Function:The choice of a shape for
each particular linguistic variable is both subjective and problem dependent (Kecman, 2001). In this study, three membership functions: trapezoidal, triangular and S membership functions are used in order to determine the degree of membership of an area to the fuzzy set. A trapezoidal membership function can be defined as follows:
Membership functions of this study are the combination of all three membership functions mentioned above.
Rules base: Rules base is a set of rules that linguistic variables are used. The number of linguistic values of each variable and its membership functions has a direct effect on the base argument. I can be said that the most important part of a fuzzy inference system is development of rules base and the reason is that all output accuracy of a fuzzy inference system is its rules base. Another noteworthy point is all information from which the rules base is created. With respect to the performed operations and in identical conditions of electrical conductivity of water, electrical conductivity of soil and calcium carbonate in the studied area, performance of product is different. There are two main methods to determine fuzzy rules: the first one is using expert knowledge and the second one is using instructions like neural network. The basis of rules base in this study is based on expert knowledge. Two processes of input fuzzy making and fuzzy operators in two methods of Mamdani and Sugeno are quite similar. The only difference of these two methods is that output membership function in Sugeno is linear or deterministic. According to phasing input parameters and yields in the software MATLAB, fusion model in fuzzy inference system as suitable model and the type of input/output, combining layers and converting them in to raster as optimal processing of layers in GIS environment are chosen. According to the results of fuzzyd layers and its display in the software ARCGIS, appropriate places for wheat crop are identified based on water and soil parameters and its performance.
4
RESULTS AND DISCUSSIONAfter raster maps of electrical conductivity of soil, water and calcium carbonate and converting them in to excel as data base and fuzzy inference system input and also attending to performance of wheat crop, it should be paid on membership functions in each input of inference system and then should estimated the relationship between the membership function or building rules base and weighting these rules. The number of defined rules must be such that water and soil conditions in each pixel of a region are based on one specified rule. Because one pixel without any encompassed rules makes the software MATLAB as operator of inference system randomly choose one number as the main output for the stated pixel that may less the accuracy of output. Increasing the electrical conductivity of soil, water and percentage of calcium carbonate of soil, the amount of performance would be decreased. The fuzzy inference system works are as follows: the first pixel is taken from the first image or variable, the first pixel is taken from the second image or variable and the first pixel is taken from the third image or variable. Then it checks to put three pixels in relevant rules (if-then rules). The final output of three pixels is a pixel that related to the rules on the basis of input pixels. This process is done for all pixels and finally one image is presented as the output of fuzzy inference system. Regarding the weakness of MATLAB in illustrating the output of inference system on the format of map and capability of ARC GIS in reading the output of inference system and analysis of this output, this software has been applied for presentation and analysis of inference system.
Results and processing of standards in GIS: Correct and optimum performance in GIS is greatly dependant on input FuzzyInference System
Fig. 7: Fuzzys for Fuzzy Inference System (Fong, 2010)
(3) Data
Input
Fuzzy Maker
Obtaining Membershi p functions
Fuzzy Operat ors
Outp uts of rules
Final outputs
Rule Base
Dyfuzz y Maker
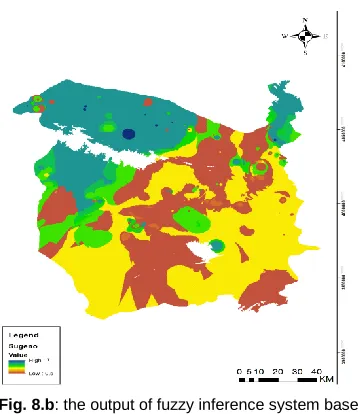
variables and the more important point is the rules that are defined for fuzzy inference system. The output of this system are shown with three input parameters of electrical conductivity of water, electrical conductivity of soil and percentage of calcium carbonate of soil and by two methods of Mamdani and Sugeno as in the following:
To check the accuracy of the output of fuzzy inference system with two methods of Mamdani and Sugeno, the performance of 67 soil points with suitable dispersion in the region have been examined and the correlation with the output has been calculated.
Table 1: check the accuracy of the output of fuzzy inference system with two methods of Mamdani and Sugeno
Closing the amount of R2 to 1, the accuracy would have been
higher. According to Table1, the value of R2 for the method Mamdani is 0.76 and for the method Sugeno is 0.52. Mamdani with the difference 0.24 is closer to 1 and its accuracy is more than Sugeno ones in this study. The main reason is related to the design of inference system and definition of membership functions for input and output variables. If the output variable (the level of performance in this study) is discrete, it would be better to use Mamdani with continuous output and in the cases with discrete outputs, Sugeno will be more accurate. In this research, the output or the performance of wheat crop is continuous; hence Mamdani would be more accurate than Sugeno.
The examination of studied points with unreal
performance: Perceived areas of land that are used in
calculating the accuracy are differentiated with the results of fuzzy inference system (Mamdani and Sugeno). The difference is one tone per hectare. However, there are points in the output of inference system that have differentiated from statistics of Sabzevar agriculture more than one tone per hectare increasingly or decreasingly. Some of these locations have identified and its water and soil samples are tested and the obtained results are not significantly different from the values I interpolated maps introduced to fuzzy inference system. But, as mentioned, there are a difference more than one tone per hectare increasingly or decreasingly that with regard to experts' findings, the following is the main reason of this difference:
1) Farm management
- Repeated plants and neglect to nourishing soil that makes poor soil
- Excessive use of chemical fertilizers that causes changes in soil electrical conductivity
- Excessive use of groundwater tables that causes changes in water electrical conductivity that finally changes soil electrical conductivity
2) Due to lack of water wells, in some parts of the studied area, fuzzy inference system have produced output by two parameters of soil calcium carbonate and soil electrical conductivity
The amount of performance in some farms is more than the amount of performance is presented by fuzzy inference system. With respect to Mamdani processes, the only reason is farmers' strong management that using modern systems of drip irrigation, fertilizers, annual test of water, and eliminate the need of plants in terms of water and soil deficits make higher performance compared to other farmers.
4
C
ONCLUSIONAccording to characteristics of fuzzy inference system, such as the ability to work with large amounts of spatial data, high flexibility, provide proper output, using a variety of analysis functions, feature coding, connection to software (GIS,Arc), and optimal decision makings expand use of this model in different organizations with various goals. One of the purposes of applying this method is selection of a suitable place on earth with regard to certain terms and conditions to make optimal decisions. This purpose is discussed in different applications, such as agriculture, resource management, and environment and so on. The relationship between this method and GIS makes regulate human relationships with environment in order to take advantages of reasonable
Methods 2
R
Regression CoefficientsMamdani
0.76
b
0.183
a
1.084
Sugeno
0.52
b
1.996
b
1.996
Fig. 8.a: the output of fuzzy inference system based on Mamdany method
operation of all features and functionalities. Hence, logical and scientific decisions to locate of plants, management, and organizing are considered as the main important objectives in agriculture. Also, this model with high reliability and flexibility in terms of defining input types and sorts of membership functions are designed and implemented through several stages: identifying, developing standards, database design, data preparation and integration, test and evaluation, implementation and finally, management, maintenance and development of the system of design. With respect to the results obtained from fuzzy inference system, more larger the land used for growing wheat crop, more real the system output. Central parts of the studied area contain water with high electrical conductivity that is increased yearly and it makes some changes of soil electrical conductivity, i.e. damage to environment. As a result, it is suggested to use intact southern regions with high water potential and qualified soil instead of using water in central regions. Also, designed fuzzy inference system has estimated the performance of 5.5 tons per hectare for this pat compared to 3.5 tons per hectare in central part that shows better performance.
REFERENCES
[1] Badenko, v., and kurtener, D. 2004. Fuzzy modeling in GISenvironment to support sustainable land use planning. The AGILEconference on geographic information science. 29 April-1may. Heralion, Greece, parallel session a.1- "geographic knowledge discovery.
[2] Baja, S., Chapman, D.M., and Dragovich, D. 2002. Fuzzy modelingof environmental suitability index for rural land use systems: anassessment using GIS. Environment and Planning B: Planning andDesign. 29:3–20.
[3] Balali, M., Mohajermilani, P., and Khademi, Z. 2000. Comprehensive computer models of chemical fertilizers in line with recommendations of sustainable agricultural productions. Soil and Water Research Institute.
[4] Bolton FE. 1991. Tillage and stubble management. In: Harris, H.C., Cooper, P.J.M., Pala, M. (Eds.), Soil and Crop Management for Improved Water Use Efficiency in Rainfed Areas. ICARDA, Aleppo, Syria, 39–47.
[5] Bouroubi, B. Panneton, S. Guillaume, P. Vigneault, and C. Bélec. 2010,"Develop and Validation of Fuzzy Logic Iference to determine optimum rate of N for corn on the basis of field and crop features". Precision Agriculture, 11:621-635,
[
6
]
[7] Briggle LW and Curtis BC. 1987, Wheat Worldwide. In: Heyne, E.G. (ed). Wheat and Wheat Improvement. American Society of Agronomy, Madison, WI. pp. 1-31.
[8] Dikshit AK, Padmavathi T, Das RK. 2001, ―Locating Potential Landfill Sites Using Geographic Information Systems.‖, Journal of Environmental Systems, 28(1), 43-54
[9] Edrees AS, Rafea A,Fathy Iand Yahia M. 2003," NEPER: a Multiple Strategy wheat expert system", Computers and Electronics in Agriculture, 40, 1-3, 27-43
[10]Effati, M. and Rajabi, M. 2011. Presentation of a new method to identify road black spots using GIS and fuzzy inference: A case study. Science and Technology Mapping, 2: 1-15.
[11]El Hajj M, Begue A, Guillaume S, Martine JF. 2010," Combining Multi _ source information for Crop monitoring", Information Fusion, 2008 11th International Conference on, 1 - 7
[12]Engelbrecht, A. P. 2007. Computational Intelligence: An Introduction, Second Edition, John Wiley Sons, Ltd
[13]Foong Kwong, ch., Chuah, T. and Lee,W.(2010). "Adaptive Network Fuzzy Inference System (ANFIS) HandoffAlgorithm". International Journal of Network and Mobile Technologies, 1(2), 54-59.
[14]Ghadirimasoum, M., Nasiri, H., and Rafiee, Y. 2012. Implementing make-up agriculture model using fuzzy inference system and GIS: A case study in Marvdasht city. GeographicalSciences andApplied Research, 25: 195-218.
[15]Ghodsipour, H. 2006. Hierarchy processes. Amirkabir University of Technology of Tehran.
[16]Hartati S, sitanggang ISM.2010,." A Fuzzy Based Decision Support for Evaluating Land Suitability and Selecting Crops", Journal of computer science, 6(4), 417-424
[17]Karimi, M., Sadimesgari, M., and Sharifi, M. 1999. Modeling ecological comptetnce of land using fuzzy logic: A case study in Barkhar and Meyme. Remote Sensing and GIS in Iran, 1: 17-38.
[18]Keshavarzi A, Sarmadiyan F, Heidari A,.2010,."land Suitability Evaluation Using Fuzzy Continuous classification (A Case Study: Ziaran Region) ", Vol 4(7) , Modern Applied Science.
[19]Khorasan Regional Water Company. 2001.
[20]Kourepazan, A. 2008. Fuzzy set theory and its applications in modeling water engineering issues. Tehran: Amirkabir Publication.
[21]Kurtener D, Green TR, Krueger–Shvetsova E, Erskine RH. 2005,"Exploring Relationships Between Geomorphic Factors and Weaht Yield Using Fuzzing Inference System", Hydrology Days, 121-130
[22]Lashgari, H. and Rezaie, A. 2011. Locating of Kalza cultivated areas in Sarpolzahab area in Iran. Geography Research, 78: 29-48.
[23]Menhaj, P. and Nasaji, M. 2000. Foundations of fuzzy reasonings. Knowledge of Management, 51: 24-34. N. Tremblay, M.Y.
[25]Parhizgar, A. 1999. Suitable model to study the location of urban centers, urban models and GIS. Ph.D. Dissertation, Tarbiat Modarres University of Tehran.
[26]Reshmidevi ,T.V., T.L., Eldho , R., Jana. 2009. A GIS-integrated fuzzy rule-based inference system forland suitability evaluation in agriculturalwatersheds. Agricultural Systems. 101: 101 –109
[27]Robin, A.K.Szmidt & Andrew. 2001. Use of compost in agriculture, Frequently Asked Question (FAQ).
[28]Samandarzadegan, F., Abbaspour, R., and Pahlavani, P.2007. Application of Geographic Information Systems (GIS) in locating emergency housing residents in disaster areas based on fuzzy theory: Disaster management, 1: 172-178.
[29]Sikora LJ, Szmide RAK.2001. Nitrogen Source, Mineralization, rates and plant nutrient benefits from copost. pp. 287-305. In: P. J. Stoffella and B. A. Kahn (eds.) Compost utilization in horticultural cropping system. New York, USA: Lewis Publishers.
[30]Slafer GA and Rawson HM. 1994." Sensitivity of Wheat Phasic Development to Major Environmental-Factors - a Reexamination of Some Assumptions Made by Physiologists and Modelers ", Australian Journal of Plant Physiology, 21(4), 393-426
[31]Slamfar, S. 2000.Wheat, ecology, physiology and performance estimation.
[32]Smith cj, Freney JR, Chapman SL, Galbally JE. 1989. Fate of urea nitrogen applied to irrigated wheat at heating. Aust.J.Agric.Res, 40, 951-963
[33]Tandon, j.p. 1984. "Wheat improvement programs for the hotter parts of India . pp: 63- 67".
[34]Welech,R.M.,W.Allaway,W.A.House.1991. Geographic distribution of trace-element problem. In: micronutrient in Agriculture., P : 31-57. Soil sci. Soc.Am. Madison, USA.