CHANGES IN MECHANICAL PROPERTIES
By
Ellen M. Rabenberg
A thesis
submitted in partial fulfillment of the requirements for the degree of
Master of Science in Materials Science&Engineering Boise State University
DEFENSE COMMITTEE AND FINAL READING APPROVALS
of the thesis submitted by Ellen M. Rabenberg
Thesis Title: Small Specimen Test Techniques for Evaluating Radiation-Induced Changes in Mechanical Properties
Date of Final Oral Examination: 5 October 2012
The following individuals read and discussed the thesis submitted by student Ellen M. Rabenberg, and they evaluated her presentation and response to questions during the final oral examination. They found that the student passed the final oral examination.
Darryl P. Butt, Ph.D. Chair, Supervisory Committee Rick Ubic, Ph.D. Member, Supervisory Committee Frank A. Garner, Ph.D. Member, Supervisory Committee
testing presented could not have been accomplished without the help of many people. First, I would like to thank my committee members; Dr. Darryl Butt, Dr. Frank Garner, and Dr. Rick Ubic; for their support and guidance through this thesis. I thank Dr. Bulent Sencer of Idaho National Laboratories for his help acquiring equipment and expertise with the materials tested and the miniaturized test techniques. This research could not have been accomplished without the support of the Advanced Materials Laboratory at Boise State University, particularly Brian Jaques, Kyle Knori, Kyle Witherspoon, and Allyssa Bateman.
Paula Freyer from Westinghouse Electric Company LLC was instrumental in obtaining material for the irradiated work. The infrastructure for conducting shear punch tests of the irradiated material could not have been done without the help and expertise of the team at the Center for Advanced Energy Studies, including Bryan Forsmann, Dr. Kerry Allahar, Joanna Taylor, and Kristi Moser-Mcintire.
Finally, I would like to thank my parents and sister for their love and support of my education.
Small Specimen Test Techniques for Evaluating Radiation-Induced Changes in Mechanical Properties
Ellen M. Rabenberg
The mechanical properties of as-received and irradiated 304 stainless steel (304SS) were evaluated by the shear punch and miniature tensile techniques. A purpose of this study was to evaluate the shear punch technique itself, which is a less developed technique versus miniature tensile testing. This was accomplished in part by comparing yield and ultimate strengths obtained from shear punch and miniature tensile data. The tests were further correlated by evaluating the mechanical properties of aluminum 6061 and Inconels 600 and 718. A linear relationship was observed between the shear strength and tensile strength data, providing a correlation between the two test methods.
The influences, if any, of specimen surface roughness, thickness, and material irradiation history on mechanical properties were evaluated. Through shear punch and miniature tensile testing techniques involving annealed 304 stainless steel, it was demonstrated that surface roughness had no influence on the observed mechanical properties. For T6 aluminum 6061, increased sample thickness lead to decreased ductility while yield and ultimate strengths were similar across the thickness range chosen. The results of specimen surface roughness and
shear punch testing of 304SS increases. Increased temperature from gamma heating was shown to decrease strength, likely due to annealing at the higher temperatures. A ferroprobe technique was developed to assess whether the changes in strength were due to irradiation damage or thermal gradients or from a martensitic transformation induced during shear punch testing. Similar ferromagnetic measurements at each irradiation and temperature condition suggest a low saturation in the formation of martensite during shear punch testing with increasing irradiation damage.
ABSTRACT . . . v
LIST OF TABLES . . . x
LIST OF FIGURES . . . xi
1 INTRODUCTION . . . 1
1.1 Motivation for Research. . . 1
1.2 Objectives . . . 1
2 BACKGROUND INFORMATION . . . 4
2.1 Shear Punch Test . . . 5
2.2 Comparisons Between Uniaxial Tensile and Shear Punch Experiments . . 7
2.3 Factors Influencing Miniature Tensile and Shear Punch Stress-Strain Curve Behavior . . . 9
2.3.1 Surface Roughness . . . 9
2.3.2 Specimen Thickness. . . 10
2.3.3 Irradiation Damage . . . 11
2.3.4 Strain-Induced Martensitic Transformations in Metastable Steels . 11 3 EXPERIMENTAL METHODS . . . 16
3.1 Miniature Tensile Testing Setup . . . 16
3.2 Shear Punch Testing Setup. . . 16
3.3.2 Surface Roughness Effects on Miniature Tensile and Shear Punch
Experiments . . . 20
3.3.3 Thickness Effects on Miniature Tensile and Shear Punch Experi-ments . . . 20
3.4 Material and Methods for Determining Irradiation Effects . . . 22
3.4.1 Irradiated Stainless Steel . . . 22
3.4.2 Test Area . . . 24
3.5 Detecting Strain-Induced Martensitic Transformations through Ferromagnetic Measurements . . . 25
4 RESULTS AND DISCUSSION . . . 26
4.1 Determination of Shear Yield Stress and Tensile/Shear Correlations . . . 26
4.2 Effect of Surface Roughness on Shear Strengths . . . 30
4.3 Effect of Specimen Thickness on Stress-Strain Curves. . . 32
4.3.1 Thickness Effects on Shear Punch Experiments . . . 34
4.3.2 Tensile Thickness Effects on Character of Stress-Strain Curves . . 35
4.4 Effect of Irradiation Damage on Mechanical Properties . . . 38
4.5 Effect of Irradiation Temperature on Mechanical Properties. . . 41
4.6 Effect of Strain-Induced Martensitic Transformations . . . 42
5 CONCLUSIONS . . . 48
in order of increased slice irradiation damage. . . 24
Table 4.1 Comparison of tensile/shear ultimate stress ratios reported in literature and this research. . . 26 Table 4.2 Shear yield stress calculated using the 0.2% and 1% offsets typically used in
literature with the2.2%offset used in this study. . . 29 Table 4.3 Comparison of tensile/shear yield strength ratios reported in literature and this
work. . . 30
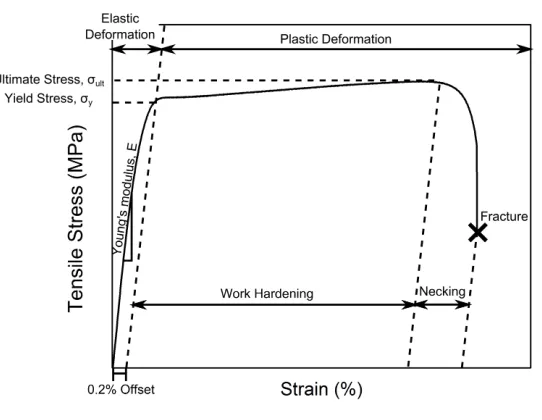
Figure 2.1 Typical engineering stress-strain curve for metals noting Young’s modulus, offset used for calculating yield stress, yield stress, and ultimate stress. . . 5 Figure 2.2 Description of shear punch test. . . 6 Figure 2.3 Schematic of first process in martensitic transformation where individual (111)f cc
planes are displaced by af cc/18h112i. . . 13
Figure 2.4 Schematic of second process in martensitic transformation where individual (110)bccplanes are displaced by abcc/8h110i . . . 15
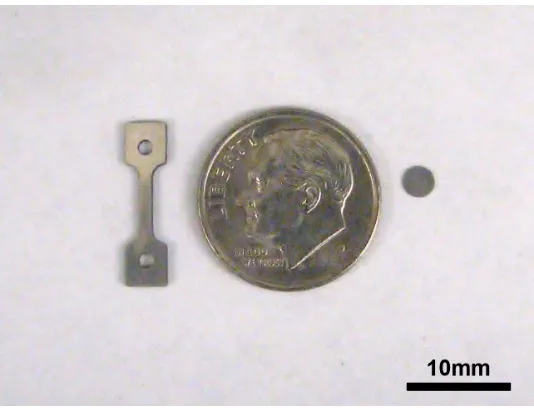
Figure 3.1 Schematic of miniature tensile and SPT specimens with gage information as compared to standard tensile specimen sizes defined in the ASTM E8 Standard [1]. . . 17 Figure 3.2 Comparison of miniature tensile and shear punch specimens with respect to a
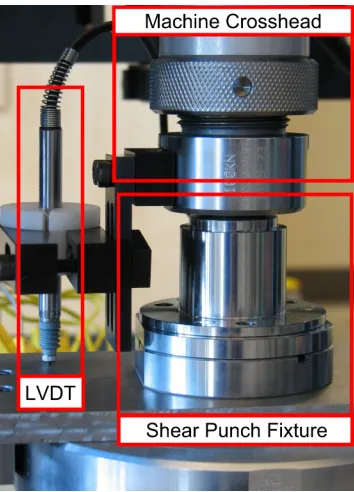
dime. . . 17 Figure 3.3 Image of the shear punch fixture used in this study where the LVDT measures
displacement. . . 18 Figure 3.4 Schematic of the shear punch fixture, noting both punch sizes and specimen
dimensions. . . 19 Figure 3.5 Images showing the 600 and 800 SiC grit, as-received from vendor, and0.5µm
diamond surface finishes tested. . . 21
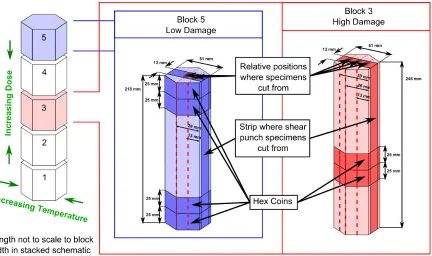
temperature dependence from the outside face to center of the individual blocks and an increasing dose is observed from the top and bottom of the stack towards the center. Center Detailed description of the hex coins and relative positions (depths) from which specimens came from in low dose Block 5. Right Detailed description of the hex coins and relative positions (depths) from which specimens came from in high dose Block 3. . . 23 Figure 3.7 Image and schematic of ferroprobe alignment tool. . . 25
Figure 4.1 Comparisons of ultimate strength obtained through the shear punch and miniature tensile techniques. . . 27 Figure 4.2 Tensile/shear ratio calculated through comparisons of shear yield stress
calcu-lated using offsets between0.2%and5%and compared to tensile yield informa-tion measured using a standard0.2%offset. The shaded region corresponds to the range of tensile/shear ratios that have been reported in [2–10]. Linear regression of the line fit was included to show the offset that provided the best fit. . . . 28 Figure 4.3 Comparisons of yield strength obtained through the shear punch and miniature
tensile techniques. . . 31 Figure 4.4 Effect of surface roughness on strength obtained through the miniature tensile
technique with surface defects introduced through grinding and polishing. . . 33
with surface defects introduced through grinding and polishing procedures. . 33 Figure 4.6 Maximum strain at failure and yield and ultimate strength for aluminum 6061,
T6 treated SPT specimens with thickness varying between100and300µm. . 36 Figure 4.7 Maximum strain at failure and yield and ultimate strength for aluminum 6061,
T6 treated miniature tensile specimens with thickness varying between100 and 300µm. . . 37 Figure 4.8 Upper and lower grips of two 0.8 mm thick, one 1 mm thick, and one 1.2 mm
thick miniature tensile specimens after miniature tensile testing. A decreasing grip mark area (circled on the lower grip positions) was noticed for an increasing specimen thickness, corresponding to an increasing yield strength shown in Figure 4.9. . . 39 Figure 4.9 Stress-strain curve behavior for four aluminum 6061, T6 treated miniature tensile
specimens tested with 0.8, 1.0, and 1.2 mm thicknesses. A higher yield strength was observed for the 1.0 and 1.2 mm thick specimens as compared to the two 0.8 mm thick specimens shown in Figure 4.8. For the two 0.8 mm thick specimens, the one with a higher yield stress (MT211) corresponded to lower observed slipping on the grip sections shown in Figure 4.8. . . 40 Figure 4.10 Yield and ultimate strengths obtained through the shear punch test with varying
irradiation exposures where a saturation in strength is observed when moving from the unirradiated condition to high doses. . . 41
Figure 4.12 Shear punch yield and ultimate strengths showing a decreasing trend in strength with increasing irradiation temperature for material exposed to 28 dpa. . . . 43 Figure 4.13 Fisher FMP-30 Feritescope, consisting of a handset and pencil-like probe . . 44 Figure 4.14 Review of fixturing used to detect ferromagnetic changes on shear punch
specimens as described in Section 3.5 and comparison of ferrite numbers before and after shear testing showing reproducibility in measurement technique for the three specimens in the 0.5 dpa set. . . 45 Figure 4.15 Comparison of changes in ferrite number measurements before and after shear
testing with respect to dose. . . 46 Figure 4.16 Comparison of the measured shear ultimate strength and ferrite number with
respect to irradiation dose. . . 47
1 INTRODUCTION 1.1 Motivation for Research
Techniques for determining mechanical properties of materials have been miniaturized for many reasons. Two such reasons are to accommodate materials where availability is limited or those that are dangerous to handle in large quantities, such as material that is radioactive. The latter was the primary motivation for this research. In order to explore the effect of irradiation damage and temperature on strength properties, a miniaturized technique called the shear punch test was used in this research.
The shear punch test is similar to a blanking process where a flat-tipped cylindrical pin shears through the center of a disk-type specimen [2–15]. Experimental results are comparable to standard tensile tests such that the stress-strain curves have similar characteristics. Both include an initial linear elastic region, a non-linear plastic region, maximum strength, and decrease in load until failure. By analyzing these regions in a shear punch curve, certain material properties can be determined, such as shear yield strength, shear ultimate strength, and work hardening exponent [2, 5–10, 12, 15, 16]. Shear strengths can linearly translate into tensile strengths [2–11], allowing comparisons in properties from the shear punch test to properties obtained from larger, standard techniques (such as tensile experiments).
1.2 Objectives
culations, and shear yield strength determinations. Since the fixturing was predetermined in this study (eliminating the need to standardize test geometry), the focus was on standardizing strain and yield strength calculations for the shear punch test. Additionally, a correlation for yield and ultimate strengths was determined for the shear punch and miniature tensile techniques. The correlation was drawn by comparing strengths obtained through the shear punch and miniature tensile techniques with 304SS, aluminum 6061, and Inconels 600 and 718.
The second objective of the research presented here was to further correlate the shear punch and miniature tensile tests by determining the effect of specimen surface roughness and thickness on the stress-strain curve behavior for both test techniques. The effect of surface roughness was done to see whether grinding and polishing steps were required to obtain reliable and repeatable results. The effect of specimen thickness was tested to determine the minimum thickness required for the shear punch and miniature tensile tests.
2 BACKGROUND INFORMATION
The uniaxial tensile test is a common technique for determining the strength of materials [18–20]. The tensile test consists of the lengthening of a material of a specified geometry [18]. The geometries are typically either rectangular or cylindrical and are defined in the ASTM standard E 8M-04 [1].
During a tensile test, changes in applied load P and specimen length ∆l are measured [18–20]. From these values, a stress-strain curve can be generated using the equations:
σ=engineering stress= P
A0
(2.1)
=engineering strain= ∆l
l0
= lf −l0
l0
(2.2)
whereP is applied load,A0is initial specimen cross-sectional area,lf is the final gage length,
andl0 is the initial gage length.
Figure 2.1: Typical engineering stress-strain curve for metals noting Young’s modulus, offset used for calculating yield stress, yield stress, and ultimate stress.
2.1 Shear Punch Test
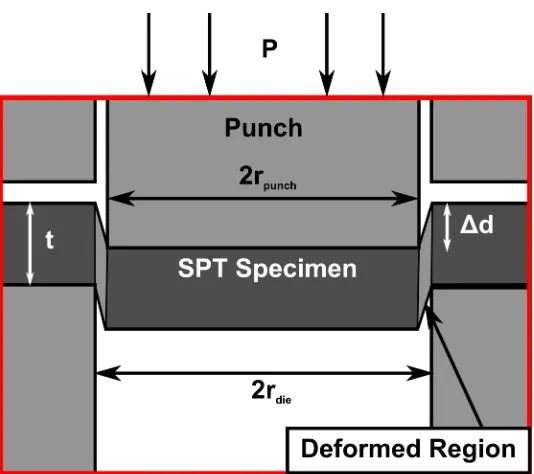
Another testing technique that gives similar materials information as the tensile test is the shear punch test. The shear punch test is a non-standard technique that is similar to a blanking operation [2–15]. The test consists of a cylindrical punch shearing a fraction of a round specimen into a receiving die, as shown in Figure 2.2. During the test, applied load
P and punch displacement ∆d are measured. These two measured values can be used to calculate stress and strain.
The applied load and punch displacement measurements are used to calculate shear stress as
τ =engineering shear stress = P
2πravet
Figure 2.2:Description of shear punch test.
whereP is the applied load,rave is the average radius of the punch (rpunch) and receiving die
(rdie), andt is the specimen thickness [2–7, 10–15]. The2πravetvalue is the cross-sectional
area corresponding to the deformed region of the shear punch sample, similar to theA0 value
of Equation 2.1.
Strain is defined as the change in length divided by the initial length, defined in Equation 2.2. For the shear punch test, shear strain has been defined in a few ways. In one method, the initial lengthl0 was taken as the difference in the radii of the punch and receiving die,
making shear strain equal to = ∆d/(rdie−rpunch)[8, 14, 15]. The resulting stress-strain
To compensate for differences in curve behavior with differing specimen thicknesses, some authors defined shear strain as
=normalized displacement = ∆d/t (2.4)
where∆d is the punch displacement andtis specimen thickness [2, 3, 6, 12, 16]. By using the normalized displacement definition for strain, the linear region of the stress-strain curve obtained using specimens with different thicknesses were similar. Additionally, yield strength calculations were similar with varying specimen thickness as yielding was perceived to occur at similar strains.
2.2 Comparisons Between Uniaxial Tensile and Shear Punch Experiments
While similarities exist between the materials properties obtained through the tensile and shear punch techniques, the two cannot be directly correlated. As observed in literature, a lower stress is required to fracture a shear punch specimen as compared to tensile experiments. The reason for this lies in differences in the stress state of the material for each test. For the uniaxial tensile test, the stress tensor is
σ1 0 0
0 0 0 0 0 0
(2.5)
τ21 0 0
0 0 0
(2.6)
whereσ12equalsσ21.
The equivalent stress for each defined stress state can be calculated using the Von Mises yield criterion, which states [18]:
σeq,M =
s
1
2[(σ1−σ2)
2+ (σ
1−σ3)2+ (σ2−σ3)2] + 3(τ232 +τ132 +τ122 ) (2.7)
The equivalent stress defined in Equation 2.7 can be solved in general terms for both the tensile and shear punch stress states. Because the equivalent stresses obtained through both test techniques should be equal for a given material, the quantities can be set equal to one another and solved in terms of tensile stress,σ, and shear stress,τ.
σeq,M,tensile = σeq,M,shear
σ1 =
√
3τ12
σ1 = 1.73τ12 (2.8)
The empirical correlation between tensile and shear strengths is also used to determine the optimum offset for determining shear yield stress as there is not a standard strain offset used between authors. Authors have varied the offset from approximately 0.2% [6, 16] and 1% [2, 3, 5, 8, 10]. These experimentally determined offsets were established by plotting tensile yield stress (calculated using a 0.2%strain offset) verses shear yield stress calculated with various shear strain offsets. The offset that allowed the least deviation from linearity was used to calculate shear yield stress [2, 3, 5, 6, 8, 10, 16]. Finite element analysis studies suggest die compliances affect measurements [3]. However, little has been reported on other factors that might influence shear punch results.
2.3 Factors Influencing Miniature Tensile and Shear Punch Stress-Strain Curve
Behavior
When transitioning from bulk material properties obtained through tensile experiments to the small scale of the shear punch test, surface characteristics may have a greater impact on the measured properties. To ensure the accuracy of data when investigating irradiation damage and thermal gradient effects, as reviewed in Sections 2.3.3 and 2.3.4, surface roughness and thickness effects were studied. Once it was known how specimen thickness and surface roughness affected the measured data, the shear punch test was used to correlate the effect of irradiation damage and temperature on austenitic stainless steels. As austenitic steels are susceptible to strain-induced martensitic transformations, a non-destructive ferromagnetic measurement technique was developed to detect transformed martensite.
2.3.1 Surface Roughness
effects were received in a “rough” surface condition from polishing with 600 grit SiC papers. A study by Guduru et al. [2] noted varying surface finish minimally impacted strength measurements although this was not discussed in much detail.
2.3.2 Specimen Thickness
The effect of specimen thickness has been explored extensively for the shear punch test and has shown yield and ultimate strengths are not affected by specimen thickness [6, 15, 16]. As different geometries have been used by different authors, this study investigated the thickness effect for a 1 mm diameter punch geometry with the goal of determining the minimum thickness required to obtain repeatable results. Reproducibility was particularly important when transitioning to the limited radioactive material obtained to explore irradiation effects. While material is typically available to repeat tests involving non-irradiated materials, a limited quantity of irradiated specimens were obtained.
Ductility correlations were also investigated to determine the impact of specimen thick-ness on stress-strain curve behavior. If specimen thickthick-ness was not shown to impact ductility, large unexpected variations in curve behavior might indicate further investigations are needed to explain the behavior.
to exhibit brittle behavior. Further investigations revealed the large increases in ductility corresponded to the formation of martensite during the tensile experiment.
As the present study involved testing 304SS, a material known to be susceptible to strain-induced martensitic transformations [24, 25], the ability to correlate large variations in ductility to a potential martensitic transformation rather than specimen thickness would be beneficial.
2.3.3 Irradiation Damage
Irradiation damage occurs when energy is transfered from highly energized bombarding particles, typically neutrons, to the target material. As energy is transferred, atoms are displaced in the lattice. These displaced atoms, referred to as primary knock-on atoms, in turn displace more atoms. These bombardments cascade through the material until the energy is dissipated. The overall damage from irradiation is typically reported in terms of dose, the average number of displacements each atom has been displaced (i.e., displacements per atom, dpa).
As the damage cascade occurs, various defects are formed including defect clusters, dislocation loops, voids and bubbles, and precipitates [20, 26]. Typical characteristics of metal exposed to increasing levels of radiation are increased strength, decreased ductility, and decreased work hardening. This occurs because dislocation motion is impeded by the defects formed during radiation exposure.
2.3.4 Strain-Induced Martensitic Transformations in Metastable Steels
For the austenitic stainless steel tested, which was irradiated to 26 and 55 dpa, a total strain of ≈6-7% was expected for these irradiation exposures. Through microscopy and ferromagnetic measurements, the irregularity was determined to be from a deformation-induced transformation fromγ austenite toα’ martensite [17, 21–23].
The γ austenite to α’ martensite phase transformation occurs through a rearrangement in atomic structure from an FCC to BCC stacking [27, 28]. The rearrangement is a result from the interaction of a traveling dislocation with other dislocations or defects in the atomic structure. If the traveling dislocation becomes pinned, it might dissociate into af cc/6 h112i
Shockley partial dislocations.
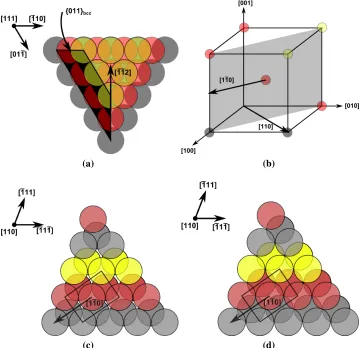
The transformation from FCC to BCC occurs in two processes, as described by Bogers and Burgers [28]. In the first process, a Shockley partial dislocation is “spread” over three consecutive (111)f cc planes. Figure 2.3 (a) defines three (111) planes in the FCC structure
that are affected by the transformation. Figure 2.3 (b) shows the three (111)f ccplanes stacked
upon one another, as seen looking down the [111]. During the transformation, the three consecutive (111)f cc planes are displaced by a/18h112i(1/3 the magnitude of the a/6 h112i
Shockley partial dislocation) such that the atoms in each (111)f cc plane are stacked along the
row of atoms underneath, as shown in Figure 2.3 (c).
As the first transformation process does not form a truly BCC structure, the second process involves shifting the atoms of the stretched (111)f cc planes, shaded in Figure 2.4 (a). This
shaded plane is similar to the (110)bcc plane in the BCC structure, shaded in Figure 2.4 (b),
(a)
(b) (c)
Figure 2.3: Schematic of first process in martensitic transformation where individual (111)f cc
planes are displaced by af cc/18 h112i where (a) shows the (111) planes in the
fcc structure, (b) is a view of the (111)f cc planes along the [111], and (c) is the
(a) (b)
(c) (d)
Figure 2.4: Schematic of second process in martensitic transformation where individual (110)bcc planes are displaced by abcc/8 h110i where (a) shows which stretched
(111)f cc plane (shaded) is equal to (110)bcc, (b) shows the (110)bcc planes in the
BCC lattice with respect to the BCC lattice, where atoms of similar shading are related to the (111)f ccplanes of the first shear process, (c) is a view of the (110)bcc
3 EXPERIMENTAL METHODS 3.1 Miniature Tensile Testing Setup
A miniaturized version of the sheet-type, dog-bone specimen defined in the ASTM standard E 8M-04 [1] was used for testing, referred to in this thesis as “miniature tensile” specimens. The miniature tensile specimens had a reduced length of 5 mm and a gage width of 1.22 mm. The overall size of the miniature specimens are compared to the full size counterparts in Figure 3.1. An image of the miniaturized specimens used in comparison to a dime is shown in Figure 3.2.
Miniature tensile experiments were carried out on an Instron 5967 electromechanical test frame with a wedge-grip fixture. A tool was developed to ensure proper alignment of the specimens within the grips. Displacement was measured using the frame crosshead measurement. Tests were conducted at room temperature using a3.3×10−3 s−1 strain rate. Four specimens were tested to failure for each material and processing condition.
3.2 Shear Punch Testing Setup
Figure 3.1: Schematic of miniature tensile and SPT specimens with gage information as compared to standard tensile specimen sizes defined in the ASTM E8 Standard [1].
Figure 3.3: Image of the shear punch fixture used in this study where the LVDT measures displacement.
Figure 3.3. Tests were conducted at room temperature using a 4µm/sdisplacement rate. Six specimens were tested to failure for each material and processing condition.
3.3 Material and Methods for Determining Correlations Between Miniature Tensile
and Shear Punch Experiments
3.3.1 Non-Radioactive Materials
Four different non-radioactive materials were tested to correlate properties obtained through the miniature tensile and shear punch techniques. Two different heat treated conditions were tested for each material. The materials and corresponding treatments tested are listed in Table 3.1.
(a) (b)
Figure 3.4: Schematic of the shear punch fixture where (a) notes the dimensions of the punch and (b) notes the dimensions of a specimen after shear punch testing.
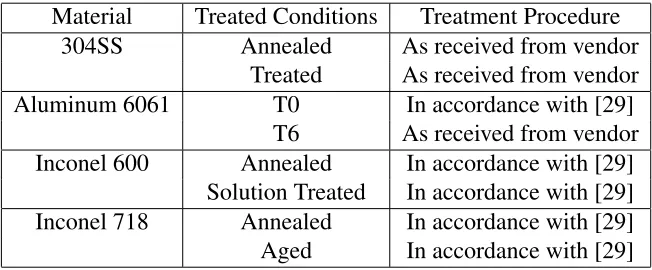
Table 3.1:Non-Radioactive Materials and Corresponding Heat Treatments Tested Material Treated Conditions Treatment Procedure
304SS Annealed As received from vendor Treated As received from vendor
Aluminum 6061 T0 In accordance with [29]
T6 As received from vendor Inconel 600 Annealed In accordance with [29]
3.3.2 and 3.3.3.
3.3.2 Surface Roughness Effects on Miniature Tensile and Shear Punch Experiments
The effect of surface roughness was studied to ensure accurate analysis when exploring irradiation effects. Testing was accomplished using non-radioactive annealed 304SS that was of similar grade to that of the material tested in the irradiation experiments, as described in Section 3.4.1. Four different surface finishes were tested. Specimens polished with 600 and 800 grit SiC paper and 0.5µmdiamond paste were compared to the as-received surface finish from the vendor. These finishes are shown in Figure 3.5. The direction of scratches of the final polishing step were oriented parallel to the specimen gage for the miniature tensile specimens. Since the punch and specimens for the shear punch test are round, scratch orientation was irrelevant.
3.3.3 Thickness Effects on Miniature Tensile and Shear Punch Experiments
(a) (b)
(c) (d)
3.4.1 Irradiated Stainless Steel
To study the effect of irradiation damage and temperature, shear punch specimens were obtained from two solid 304SS hexagonal (hex) blocks used as neutron reflectors in the now decommissioned Experimental Breeder Reactor II (EBR-II) located at the Idaho National Laboratory (INL) facility located in Idaho Falls, ID. Within the reflector region of the reactor there were many reflector assemblies whose purpose was to reflect escaping neutrons back into the active core. In each reflector assembly there were five 51 mm (2 in) wide hex blocks of various lengths stacked upon one another, shown in Figure 3.6. The assembly used to supply specimens for this study was located just outside the active core in Row 8.
The top (#5) block and center (#3) block were investigated in this study. These two blocks represented a low and high neutron irradiation damage state, respectively. Block 5 was 214 mm long and was located well above the active core, receiving a lower range of neutron dose. Specimens were obtained from both the top and bottom of Block 5, marked in Figure 3.6. Block 3 was 245 mm long and was vertically centered with respect to the core center plane, receiving the largest neutron dose at its center. Specimens were obtained from the center of Block 3, marked in Figure 3.6. The doses were defined in units of dpa (displacements per atom) and values are shown in Table 3.2.
Hex Coin Irradiation 25 mm Depth 13 mm and 38 mm Depth Damage (dpa) Temperature (◦C) Temperature (◦C)
Unirr 0 N/A N/A
5D 0.3 416 415
5C 0.5 415 415
5B 3 420 416
5A 4 422 417
3E 28 450 420
3D 28 448 418
in the center as a result of internal heating from deposition of gamma rays. Temperatures for the various positions are reported in Table 3.2. Standard shear punch specimens from a similar block not irradiated in the reactor were also provided. Because of limited material availability, only three specimens were tested for each position within the blocks.
3.4.2 Test Area
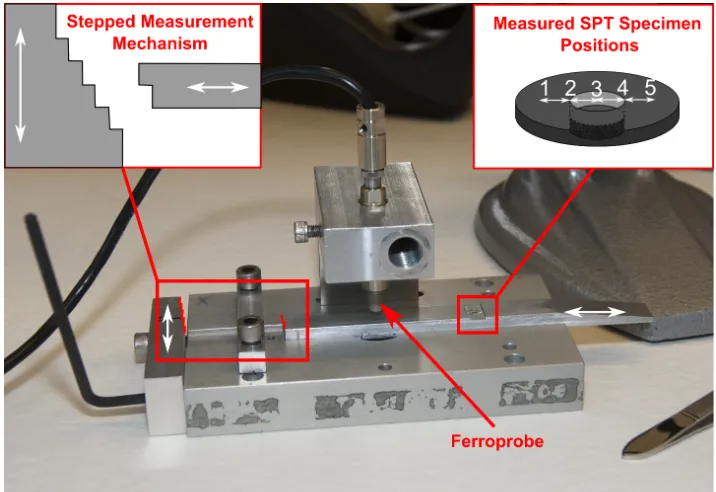
Figure 3.7: Image and schematic of ferroprobe alignment tool.
3.5 Detecting Strain-Induced Martensitic Transformations through Ferromagnetic
Measurements
4 RESULTS AND DISCUSSION
4.1 Determination of Shear Yield Stress and Tensile/Shear Correlations
Correlations between the miniature tensile and shear punch techniques were accomplished by comparing experimentally obtained strengths measured through the two test techniques. This correlation was done by finding the linear fit of the data defining an intercept through (0,0). Figure 4.1 (a) shows comparisons of ultimate strength obtained through the shear punch test with the strength obtained using the miniature tensile technique. A linear correlation of
σult,tensile = 1.4τult,shear was observed. This value is similar to the tensile-to-shear ultimate
strength ratio of1.29 − 2.049 reported in literature [2, 5–7, 9]. A comparison to the ratio measured in this research to reported tensile/shear ratios is shown in Figure 4.1 (b) and Table 4.1.
Yield strength correlations were made by comparing experimentally obtained yield strengths determined using the strain offset method. For tensile experiments, yield stress is calculated using the standard 0.2% offset. As there is not a standardized strain offset
Table 4.1:Comparison of tensile/shear ultimate stress ratios reported in literature and this research.
Reference σult/τult
Guduru,et al. [2] 1.8 Karthik,et al. [5] 2.042 Karthik,et al. [6] 1.29 Toloczko,et al.[9] 1.31
(a)
(b)
Figure 4.2: Tensile/shear ratio calculated through comparisons of shear yield stress calculated using offsets between 0.2% and 5% and compared to tensile yield information measured using a standard 0.2% offset. The shaded region corresponds to the range of tensile/shear ratios that have been reported in [2–10]. Linear regression of the line fit was included to show the offset that provided the best fit.
used to determine shear yield stress, this value had to be established before the tensile/shear correlation was made.
Table 4.2:Shear yield stress calculated using the 0.2% and 1% offsets typically used in literature with the2.2%offset used in this study.
Shear yield stress (MPa) measured using: Material Treated Condition 0.2%Offset 1%Offset 2.2%Offset
304SS Annealed 161±39 182±36 202±34
Treated 553±44 608±22 639±13
Aluminum 6061 T0 57±13 60±11 64±9
T6 130±12 146±8 157±5
Inconel 600 Annealed 96±22 120±14 145±11
Solution Treated 81±30 97±26 118±20
Inconel 718 Annealed 188±73 254±8 286±8
Aged 510±5 584±5 633±5
Figure 4.2 shows a comparison of the tensile/shear yield strength ratio measured using strain offsets between0.2% and 5%. Highlighted in the figure is the range of tensile/shear yield strength ratios reported in literature for easy comparisons. These measured yield strength ratios are compared to the linear regression for the calculated slopes. While the3.6% offset showed the least deviation from linearity (highest linear regression), this offset was not chosen for two reasons. First, this offset showed the highest deviation from the tensile/shear yield strength ratio range reported in litereature. Second, shear yield strength measurements using this high offset may not be representative of yielding as it can be well into the plastic deformation region of the stress-strain curve.
Reference σy/τy
Guduru,et al. [2] 1.77 Guduru,et al. [3] 1.773 Karthik,et al. [5] 2.093 Karthik,et al. [6] 1.73 Toloczko,et al.[9] 1.67 This work 1.5
Figure 4.3 (a) shows the tensile/shear yield strength correlation using the2.2%shear yield offset which correponded to a σy,tensile(0.2%of f set) = 1.5τy,shear(2.2%of f set). This value is a
bit lower than the1.67 − 2.3range reported in literature [2, 5–7, 9] and 1.73 ratio derived using the Von Mises yield criterion [18], shown in Figure 4.3 (b) and Table 4.3. This variance might be explained if the shear punch specimen is not stressed in pure shear.
4.2 Effect of Surface Roughness on Shear Strengths
A limited number of studies have noted that surface roughness does not appear to impact the strength measured by shear punch experiments [2]. Because the valuable irradiated specimens obtained for determining irradiation effects were received in a rough polished surface finish, the effect of surface roughness was re-visited. The material used for determining the effect of surface finish was an annealed 304SS, a similar grade to the material tested in the irradiation tests. The effect of surface roughness was also studied for miniature tensile experiments to further develop the technique.
(a)
(b)
were observed in both yield and ultimate strengths for various surface roughnesses ranging from a relatively rough 600 SiC grit to a smooth0.5µmdiamond paste polishes. This finding is similar to those reported by [2], where the specimens were not sensitive to the 600 grit and 2400 grit tested.
The insignificant differences in strength with various surface finishing ranging from “rough” to “smooth” suggest that the surface layer damaged from the polishing process is minimal as compared to the specimen thickness. For both the miniature tensile and shear punch experiments, this study shows that surface finish will not affect measured strength. This knowledge reduces specimen preparation time and gives confidence that varying surface roughness between specimens will not convolute analysis in the study of irradiation effects, as discussed in Sections 4.4 through 4.6.
4.3 Effect of Specimen Thickness on Stress-Strain Curves
The effect of specimen thickness on both the shear punch and miniature tensile tests were studied mainly to determine the minimum specimen thickness required to obtain accurate data, particularly when studying the impact of irradiation effects on strength properties. Aluminum 6064 T6 treated material was chosen for this study as the low strength provided the best opportunity to observe variations in strength based on specimen thickness.
Figure 4.4: Effect of surface roughness on strength obtained through the miniature tensile technique with surface defects introduced through grinding and polishing.
to martensite formed during mechanical testing or note variations in specimen thickness. 4.3.1 Thickness Effects on Shear Punch Experiments
Figure 4.6 (b) shows how yield and ultimate strengths vary with specimen thickness for the shear punch test. A statistically significant difference (one-way ANOVA, Tukey means comparison) was observed for the 100 µm thickness when compared to the 200 through 300µmthicknesses. No statistically significant difference was observed in ultimate strength with varying thickness. Another characteristic of Figure 4.6 (b) is the increased error (±1 standard deviation of data set) for the100 and150 µm thick specimens. This suggests that 200µmis the minimum specimen thickness required for shear punch experiments to obtain accurate strength data.
Figure 4.6 (a) shows how the maximum strain until failure varies with thickness for shear punch experiments. A larger variation in elongation was observed for 100 µm
thick specimens as compared 150 through 300 µm thicknesses. Additionally, there was a decreasing trend in maximum strain before failure as specimen thickness increased, though there was no statistical difference between the150through300µmthick specimens. Similar to comparisons of varying specimen thickness and strength, approximately 200 µm thick specimens are required to avoid major differences in maximum elongation.
to factors other than varying specimen thickness, such as the formation of martensite in irradiated steels.
4.3.2 Tensile Thickness Effects on Character of Stress-Strain Curves
Figure 4.7 (a) shows how the maximum strain to failure varies with thickness for miniature tensile experiments. For the tested thickness range, a significant difference in elongation is observed. With the thicker specimens, the larger amount of material within the specimen cross-section resists dislocation movement until the specimen fails brittlely. For the thinner specimens, less material is available and there are a lower number of obstacles restricting how the material deforms. This allows the thinner specimens to stretch more than the thicker specimens resulting in a decrease in ductility with increasing specimen thickness for miniature tensile experiments.
Figure 4.7 (b) shows how ultimate and yield strength vary with specimen thickness for aluminum 6061, T6 treated miniature tensile experiments. A statistical difference was observed for ultimate strength (see inset of 4.7 (b)), though the difference between the values was less than 10 MPa, a minimal difference as compared to the overall strength. Additionally, no variations were observed in ultimate strength with increasing specimen thickness.
(a)
(b)
(a)
(b)
Figure 4.8 shows the surface of two of the 0.8 mm thick specimens as well as the surface of one 1 mm and 1.2 mm thick specimen. Comparing the divots formed from gripping the specimen in the test fixture (circled in Figure 4.8), it appears some reseating may have occurred in the lower grip for the 0.8 mm thick specimens. In the 0.8 mm thick specimens, a “smeared” divot with a large surface area is observed while the 1 mm and 1.2 mm thick specimens have a more “pinpoint” appearance with a smaller divot area. Further inspection of the individual curves for the four 0.8 mm thick specimens tested also shows this effect where a lower divot area corresponds to a higher measured yield stress.
Comparing the images of specimens labeled MT208 (Figure 4.8 (a) and (e)) and MT211 (Figure 4.8 (b) and (f)) and the individual stress-strain curve behavior for the specimens in Figure 4.9, the larger slip area in MT208 corresponds to a lower yield stress. This variation suggests that if the specimens were held correctly within the grips and no reseating occurred, a similar yield stress would have been observed for the 0.8 mm thick specimens as the 1 mm and 1.2 mm thick specimens. Then the data might have shown that the 0.8 mm thick specimens would obtain repeatable data.
4.4 Effect of Irradiation Damage on Mechanical Properties
(a)0.8 mm thick, Top MT208
(b)0.8 mm thick, Top MT211
(c)1 mm thick, Top (d)1.2 mm thick, Top
(e)0.8 mm thick, Bottom MT208
(f)0.8 mm thick, Bottom MT211
(g)1 mm thick, Bottom (h)1.2 mm thick, Bottom
Figure 4.10:Yield and ultimate strengths obtained through the shear punch test with varying irradiation exposures where a saturation in strength is observed when moving from the unirradiated condition to high doses.
A closer examination of strength from the low dose region, shown in Figure 4.11, shows an initial decrease in measured yield strength when moving from the non-irradiated to a low (< 1 dpa) irradiation exposure conditions. While any irradiation damage on annealed material would result in the formation of defects that impede dislocation motion, subsequent examination by electron microscopy indicated the material tested had a dislocation density consistent with about5%residual cold-work. Therefore, the drop in yield strength from the unirradiated to doses less than 1 dpa is speculated to be from a reduction in dislocation density with irradiation. This finding is consistent with observations from other studies [26].
4.5 Effect of Irradiation Temperature on Mechanical Properties
Figure 4.11:A closer look of Figure 4.12 where the shear punch yield and ultimate strengths is shown for low doses showing initial decrease in strength for the 0.3 dpa dose compared to the unirradiated condition.
a decreasing trend in strength with temperature. One explanation for this trend is some annealing occurred at the higher temperatures.
Another explanation for the observed decreases in strength with increasing temperature could be due to higher defect motion at higher temperatures. The greater defect motion gives a higher probability of defect interactions leading to defect annihilation. If some defects annihilate, a lower number of obstacles remain to resist dislocation motion and lead to a decrease in strength.
4.6 Effect of Strain-Induced Martensitic Transformations
Figure 4.12:Shear punch yield and ultimate strengths showing a decreasing trend in strength with increasing irradiation temperature for material exposed to 28 dpa.
technique itself. The 304SS austenitic stainless steel tested has been shown to be susceptible to strain-induced martensitic transformations [17, 21–24]. As the transformed martensite phase is ferromagnetic, it is possible to detect how much material was transformed in tensile specimens using a ferroprobe [17].
A Fisher FMP-30 Feritescope was used to measure ferromagnetic content where ferro-magnetism was reported in ferrite number (FN). The probe consists of a handset and probe similar to a pencil, as shown in 4.13. A series of measurements were made across the SPT specimen width both before and after SPT in order to detect a relative change in FN values.
Figure 4.13: Fisher FMP-30 Feritescope, consisting of a handset and pencil-like probe
positions along the width of the SPT specimen: two undeformed regions (marked 1 and 5 on Figure 4.14 (a)), two on the edge of the punched region (directly above deformed material, marked 2 and 4), and one in the center of the punched region.
(a)
(b)
Figure 4.15:Comparison of changes in ferrite number measurements before and after shear testing with respect to dose.
(TEM), though is not part of the scope of this thesis due to issues associated with preparing radioactive samples.
Another other interesting characteristic observed in Figure 4.14 (b) was the increased reading in the center of the punched region as compared to the “ring” measurement directly above the deformed region in the specimen. Since the flat punched portion was not deformed during testing, the increase in readings are likely due to increased contact between the sides of the probe and the deformed edge. Because of the increased contact, only measurements from this center position are reported.
Figure 4.16:Comparison of the measured shear ultimate strength and ferrite number with respect to irradiation dose.
5 CONCLUSIONS
Property-property correlations were made on unirradiated material between shear punch and standard miniature tensile techniques. To ensure the reliability of the shear punch test, the effect of surface roughness and specimen thickness on measured strength was investigated. These experiments showed that surface roughness has no effect on strength. It was demonstrated that for aluminum 6061, the softest of the materials tested, strength was minimally affected by strength above200µm.
The resulting tensile/shear yield strength correlation was shown to be 1.5, on the lower end of the correlation of 1.67 - 2.3 [2–10] reported in literature. The tensile/shear ultimate strength correlation was shown to be 1.4, similar to published data where the trend has been reported as between 1.29 - 2.042 [2, 5–7, 9].
Based on the standardization of the shear punch test, this technique was applied to material irradiated to 0.3-28 dpa. The following was noticed for the shear punch experiments:
1. Good reproducibility between data sets.
2. Shear punch experiments showed the same tendencies with respect to hardening, as shown in many other studies using tensile experiments.
3. Tendency for yield and elongation to saturate early in irradiation strength parameters and also shown to fall with temperature, as noted in other studies.
REFERENCES
[1] ASTM Standard E 8M-04, 2005 “Standard test methods for tension testing of metallic materials [metric]” , ASTM International, West Conshohocken, PA, 2005.
[2] R. K. Guduru, K. A. Darling, R. Kishore, C. C. Koch, and K. L. Murty, “Evaluation of mechanical properties using shear-punch testing,” Mater. Sci. Eng. A Struct. Mater.,395 [1-2] 307–314 (2005).
[3] R. Guduru, R. Scattergood, C. Koch, K. Murty, and A. Nagasekhar, “Finite element analysis of a shear punch test,” Metall. Mater. Trans. A,371477–1483 (2006).
[4] G. L. Hankin, M. B. Toloczko, K. I. Johnson, M. A. Khaleel, M. L. Hamilton, F. A. Garner, R. W. Davies, and R. G. Faulkner, “An investigation into the origin and nature of the slope and x-axis intercept of the shear punch-tensile yield strength correlation using finite element analysis,” ASTM STP 1366, 1018–1028 (2000).
[5] V. Karthik, K. Laha, P. Parameswaran, K. V. Kasiviswanathan, and B. Raj, “Small specimen test techniques for estimating the tensile property degradation of mod 9Cr-1Mo steel on thermal aging,” J. Test. Eval.,35[4] 1–11 (2007).
[7] G. E. Lucas, J. W. Sheckherd, G. R. Odette, and S. Panchanadeeswaran, “Shear punch tests for mechanical property measurements in TEM disc-sized specimens,” J. Nucl. Mater.,122-123429–434 (1984).
[8] M. B. Toloczko, R. J. Kurtz, A. Hasegawa, and K. Abe, “Shear punch tests performed using a new low compliance test fixture,” J. Nucl. Mater.,307-3111619–1623 (2002).
[9] M. B. Toloczko, R. J. Kurtz, K. Abe, and A. Hasegawa, “Tensile property estimates obtained using a low compliance shear punch test fixture,” ASTM STP 1447, 612–622 (2004).
[10] M. B. Toloczko, K. Abe, M. L. Hamilton, F. A. Garner, and R. J. Kurtz, “The effect of test machine compliance on the measured shear punch yield stress as predicted using finite element analysis,” ASTM STP 1418,4339 – 349 (2002).
[11] G. L. Hankin, M. B. Toloczko, M. L. Hamilton, and R. G. Faulkner, “Validation of the shear punch-tensile correlation technique using irradiated materials,” J. Nucl. Mater., 258-2631651–1656 (1998).
[12] G. E. Lucas, “The development of small specimen mechanical test techniques,”J. Nucl. Mater.,117327–339 (1983).
[13] D. A. Smith and R. Bakerjian,Die Design Handbook, 3rd edition; pp. 4.1–4.32, Society of Manufacturing Engineers, Dearborn, MI, 1990.
shear punch test,” ASTM STP 1418,4371–379 (2002).
[16] R. K. Guduru, A. V. Nagasekhar, R. O. Scattergood, C. C. Koch, and K. L. Murty, “Thickness and clearance effects in shear punch testing,” Adv. Eng. Mater., 9[3] 157– 160 (2007).
[17] M. N. Gusev, O. P. Maksimkin, and F. A. Garner, “Peculiarities of plastic flow involving “deformation waves” observed during low-temperature tensile tests of highly irradiated 12Cr18Ni10Ti and 08Cr16Ni11Mo3 steels,” J. Nucl. Mater.,403121–125 (2010).
[18] J. Roesler, H. Harders, and M. Baeker,Mechanical Behaviour of Engineering Materials: Metals, Ceramics, Polymers, and Composites; pp. 63–118, Springer, Berlin, NY, 2007.
[19] R. W. Hertzberg, Deformation and Fracture Mechanics of Engineering Materials; pp. 3–56, John Wiley&Sons, Inc., New York, 1996.
[20] G. S. Was, Fundamentals of Radiation Materials Science; pp. 581–642, Springer, Berlin, 2007.
[21] M. N. Gusev, O. P. Maksimkin, I. S. Osipov, and F. A. Garner, “Anomalously large deformation of 12Cr18Ni10Ti austenitic steel irradiated to 55dpa at 310C in the BN-350 reactor,” J. Nucl. Mater.,386-388273–276 (2009).
neutron exposure at 310-432C”; pp. 1385–1391 14th Int. Conf. on Environmental Degradation of Materials in Nuclear Power Systems.
[23] M. N. Gusev, O. P. Maksimkin, I. S. Osipov, N. S. Silniagina, and F. A. Garner, “Unusual enhancement of ductility observed during evolution of a “deformation wave” in 12Cr18Ni10Ti stainless steel irradiated in BN-350,” J. ASTM Int.,6[7] 1–7 (2009).
[24] P. L. M. Jr. and G. Thomas, “The martensite phases in 304 stainless steel,” Metall. Trans.,11577–1586 (1970).
[25] S. S. Hecker, M. G. Stout, K. P. Staudhammer, and J. L. Smith, “Effects of strain state and strain rate on deformation-induced transformation in 304 stainless steel: Part i. magnetic measurements and mechanical behavior,” Metall. Trans. A, 620–626 (1982).
[26] F. A. Garner, “Radiation damage in austenitic steels”; pp. 33–95 in Comprehensive Nuclear Materials, Elsevier, Amsterdam, 2012.
[27] G. B. Olson and M. Cohen, “General mechanism of martensitic nucleation: part II. FCC->BCC and other martensitic transformations,” Metall. Trans. A, 7A 1905–1914 (1976).
[28] A. J. Bogers and W. G. Burgers, “Partial dislocations on the{110}planes in the b.c.c. lattice and the transition of the f.c.c. into the b.c.c. lattice,” Acta Metall., 12255–261 (1964).