© 2017 IJSRSET | Volume 3 | Issue 1 | Print ISSN: 2395-1990 | Online ISSN : 2394-4099 Themed Section: Engineering and Technology
Comparative Analysis of Social Network Analysis and
Visualisation Tools
Prof. Priyanka Shah, Dr. Richa Mehta
BCA, BPCCS College, KSV University, Gandhinagar, Gujarat, IndiaABSTRACT
Data Analysis and Visualization is very important for big organizations. When social network data grows rapidly, it becomes difficult to analyse and visualize the data and perform complex comparisons. Various Data Analysis and Visualization tools are used to overcome this problem. The research provides a comparative study on popular visualization tools -Gephi, Cytoscape, SocNetV and yEd that could be used in the analysis of large datasets. Comparison study is categorized based on their significance-basic functionalities, network types, graph layouts, input file formats, graph attributes. Researcher uses denotation to measure social network analysis and visualization tools based on attributes.
Keywords: Graph Mining, Social Network Analysis, Graph Attributes
I.
INTRODUCTION
Graphs become progressively essential in modeling complicated structures, such as images, biological networks, circuits, social networks, the Web, and XML documents. Social Network Analysis (SNA) studies relations between individual actors including the analysis of social structures, social position, role analysis, and many others. These relationship between nodes are presented as a network. [1]
There are various Social network analysis (SNA) software are available that includes two packages based on graphical user interfaces (GUIs) or packages made for programming / scripting. [2] GUI packages are generally easier to learn while programming tools are powerful and extensible. GUI packages have been well documented. Programming tools have been also well documented and used to analyze network.[3]
The features of SNA software are the calculation of network standards and statistics (eg, Density, Diameter, Betweenness, Centrality, Clustering, etc.), creating adjacency matrix, list edges, or edges, visualization and more.[4] Social Network Analysis Tools may include discovering the structure of social
network, finding different attributes of the network, visualizing whole social network and finding communities.[5]
II.
METHODS AND MATERIAL
Social network analysis and visualisation tools are used to analyse and visualise all nodes and edges from various social networks.
Researcher has selected four analysis tools for comparison- Gephi, Cytoscape, SocNetV and yEd. All these four software are freely available and can handle large size of graph. These tools are deeply studied in term of language implementations, features (access to plug-ins and library functions , calculating statistical measures like centrality, betweenness, the degree of nodes, the leading index, density, diameter and more), platform, input and output formats, volume of received data, download (free or not), open sources.
SocNetV: Social Network Visualizer (SocNetV) is a cross-platform, user-friendly free software application for social network analysis and visualization. Social networks are displayed and analyzed as mathematical graphs, where vertices depict actors/agents and edges represent their relations. The application enables you to import social network field data, edit actors and links through point-and-click, analyse their social and graph properties, produce reports for these properties and embed visualization layouts to the network. [7]
Cytoscape : Cytoscape is an open source software platform which is used for visualizing complex networks and integrating with any type of data. Cytoscape was originally designed for biological research, now it is a general platform for complex network analysis and visualization. Cytoscape core distribution provides a basic set of features for data integration, analysis, and visualization. [8] yEd is a powerful desktop application that can be used to generate high quality of network very quickly and effectively. It provides large set of layout options through which we can visualize network in different ways. [9]
The research work concentrates on proposing a methodology for all standard attributes of Graph Mining that can be considered to derive accurate and precise outcomes of Social Network Analysis.
The researcher divides comparative study into five stages:.
Stage 1: Comparison based on Basic functionalities Stage 2:Comparison based on Network Types Stage 3: Comparison based Core Graph Attributes Stage 4: Comparison based Graph Layouts
Dataset for Social Network Analysis and Visualisation
Tools:
The dataset used for the implementation is airlines. gml that was converted into airlines.graphml a common file format that
can be used in Gehhi, SocNetV, Cytoscape, and yEd file. The graphical data has 235 nodes and 2594 edges.
III.
RESULTS AND DISCUSSION
Stage 1: Comparison based on core functionalities
Mostly all Social Network Analysis and visualization tools
are freely available. All tools can run on Windows, Mac OS
X, and Linux Operating Systems. Stage 1 shows the
comparison based on core functionalities like nature,
platform, supported no of edges, supported no of nodes,
licence and language that are shown in table 3.1.
Table 3.1 : Comparison based on Core Functionalities
Basic Features
Social Network Analysis FOSSs
Gephi SocNet
V yEd Cytoscope
Nature Stand alone Software Stand alone Software Cross Platform software Stand alone Software
Platform Any OS supporti ng Java 1.6 and OpenGL Windows, Linux, Mac OS X Window s, Linux, Mac OS X,Unix Windows, Linux, Mac OS X Supported no of nodes 1,00,000 nodes More then 1000 nodes More than 1000 nodes More then 1,00,000 nodes
Licence CDDL + GNU GPL 3 GNU General Public Licence 3 (GPL3)
Freeware GNU LGPL
Language JAVA 1.7+
C++ and Qt
JAVA JAVA
Supported no of edges 1,00,000 edges 10,000 edges 10000 edges 1,00,000 edges
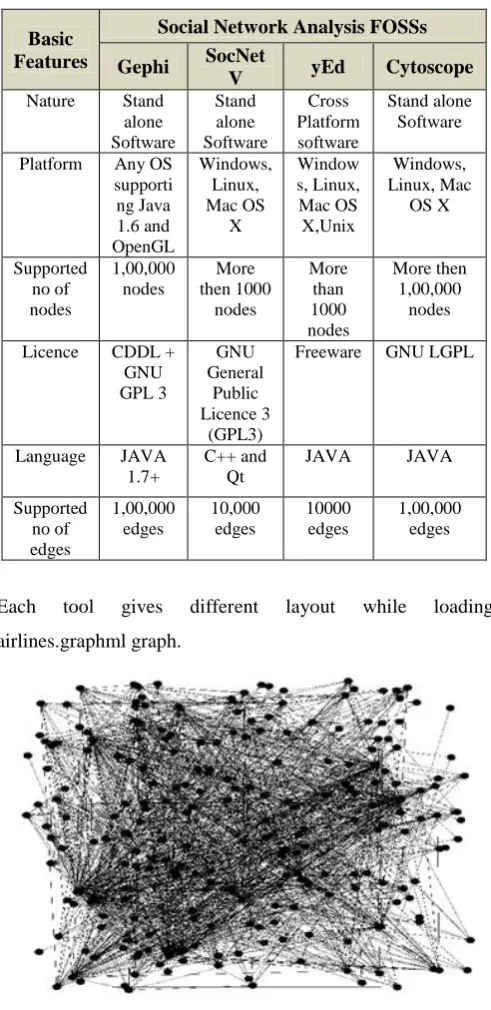
Each tool gives different layout while loading
airlines.graphml graph.
Figure 3.2 Loaded graph in SocNetV
Figure 3.3 Loaded Graph in yEd
Figure 3.4 Loaded Graph in Cytoscape
Stage 2: Comparison based on Network Types
In Social Network Analysis, there are four types of network
types. For one mode or two mode network analysis there is
Gephi, SocnetV and Cytoscapes. yEd can support only one
mode network layouts as shown in Table 3.2.
Table 3.2 : Comparison based on Network Types
Network Types
Social Network Analysis FOSSs
Gephi Cytoscope SocNetV yEd
One Mode network Graph
YES YES YES YES
Two Mode network Graph
YES YES YES NO
Multi relational NO NO NO NO
network Graph Temporarily network Graph
NO NO NO NO
The totals count obtained in the Table.3.1 is based on the Supported Graph layouts and is obtained from study and implementation of User Interface features available in particular of Social Network Analysis Tools.
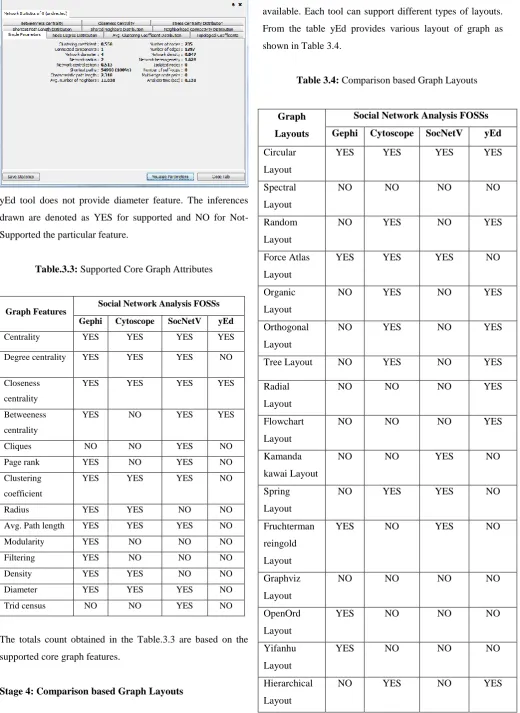
Stage 3 : Comparison based Core Graph Attributes
All Social Network Analysis and Visualisation tools supports various graph attributes represented in Table.3.3: Supported core Graph Features.
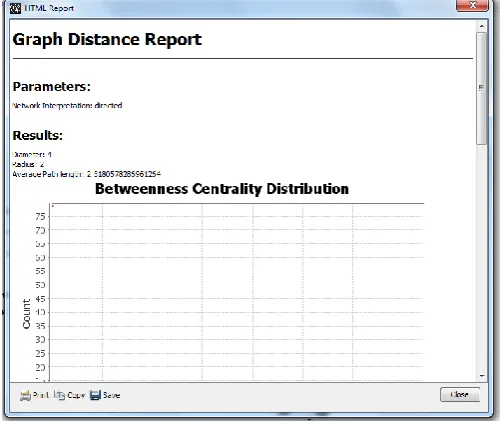
Figure 3.5 Diameter measured in Gephi tool
Diameter=4
Figure 3.7 Diameter measured in SocNetV tool
yEd tool does not provide diameter feature. The inferences
drawn are denoted as YES for supported and NO for
Not-Supported the particular feature.
Table.3.3: Supported Core Graph Attributes
Graph Features Social Network Analysis FOSSs
Gephi Cytoscope SocNetV yEd
Centrality YES YES YES YES
Degree centrality YES YES YES NO
Closeness centrality
YES YES YES YES
Betweeness centrality
YES NO YES YES
Cliques NO NO YES NO
Page rank YES NO YES NO
Clustering coefficient
YES YES YES NO
Radius YES YES NO NO
Avg. Path length YES YES YES NO
Modularity YES NO NO NO
Filtering YES NO NO NO
Density YES YES NO NO
Diameter YES YES YES NO
Trid census NO NO YES NO
The totals count obtained in the Table.3.3 are based on the
supported core graph features.
Stage 4: Comparison based Graph Layouts
In Social Network Analysis, different graph layouts are
available. Each tool can support different types of layouts.
From the table yEd provides various layout of graph as
shown in Table 3.4.
Table 3.4: Comparison based Graph Layouts
Graph
Layouts
Social Network Analysis FOSSs
Gephi Cytoscope SocNetV yEd
Circular
Layout
YES YES YES YES
Spectral
Layout
NO NO NO NO
Random
Layout
NO YES NO YES
Force Atlas
Layout
YES YES YES NO
Organic
Layout
NO YES NO YES
Orthogonal
Layout
NO YES NO YES
Tree Layout NO YES NO YES
Radial
Layout
NO NO NO YES
Flowchart
Layout
NO NO NO YES
Kamanda
kawai Layout
NO NO YES NO
Spring
Layout
NO YES YES NO
Fruchterman
reingold
Layout
YES NO YES NO
Graphviz
Layout
NO NO NO NO
OpenOrd
Layout
YES NO NO NO
Yifanhu
Layout
YES NO NO NO
Hierarchical
Layout
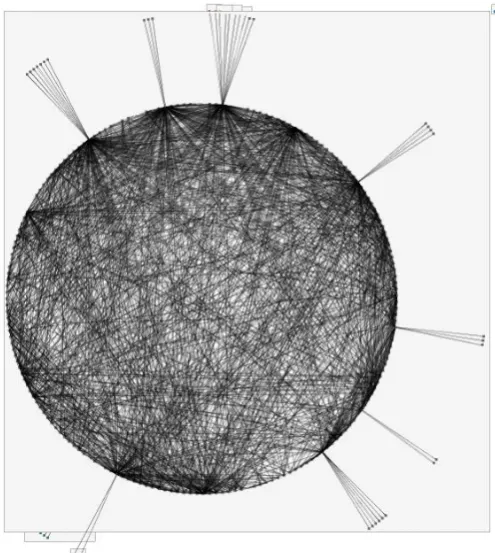
Figure 3.8 Circular layout in Gephi tool
Figure 3.9 Circular layout in SovNetV tool
Figure 3.10 Circular layout in Cytoscape tool
Figure 3.11 Circular layout in yEd tool
The totals count obtained in the Table.3.4 is based on the Supported Graph layouts and is obtained from study and implementation of User Interface features available in particular tool.
For the result analysis, Researcher has used measuring denotation to derive the result outcomes for Comparative Analysis. The depth Analysis of Social Network Analysis and Visualization tools is based on a count measuring scale as shown in Table 3.5. The “B“ denotation indicates that Social Nework Analysis tools provide Weak result whereas, “B+“ denotation indicates that Social Network Analysis tools provide Average result. The third “A” denotation indicates that Social Network Analysis tools provide Good result while the fourth “A+” denotation indicates that the Social Network Analysis tools provide Strong result.
Table 3.5: Measuring Denotation
Measuring Scale Meaning
B Weak
B+ Average
A Good
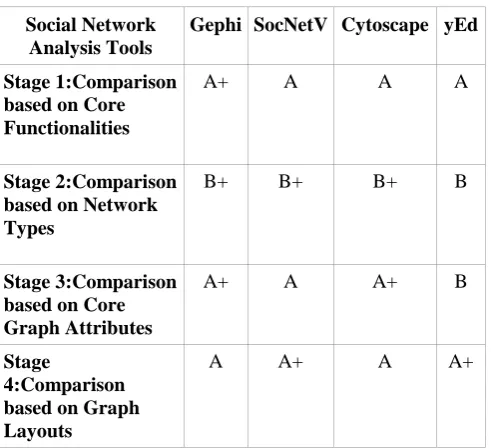
Table 3.6 : Comparative Analysis
Social Network Analysis Tools
Gephi SocNetV Cytoscape yEd
Stage 1:Comparison based on Core Functionalities
A+ A A A
Stage 2:Comparison based on Network Types
B+ B+ B+ B
Stage 3:Comparison based on Core Graph Attributes
A+ A A+ B
Stage
4:Comparison based on Graph Layouts
A A+ A A+
Above Table 3.6 displays Stage wise comparative analysis of different social network analysis and visualization tools. Gephi is in the Strong category to provide core functionalities because it can run on any Operating System and supports maximum number of nodes compare to other tools. Gephi and SocnetV provide maximum number of graph attributes. Gephi, SocNetV and Cytoscape provide Average denotation to support network types because they can support only one and two mode Network Types. SocNetV and yEd are Strong to support graph layouts. It supports maximum no of graph layouts.
IV.
CONCLUSION
It is very clear that all social network analysis and visualization tools are differing from each other in multiple aspects. All these tools give quantitative and qualitative analysis of social networks. These tools give interesting results for calculating network matrices and statistics. All these tools are stand alone software that are very useful for graph visualization and data format conversion. All these tools can run on Windows, Mac OS X and Linux operating system. Gephi and SocNetV tools can handle most of all input file formats. Gephi tool provides maximum features of graph that are centrality, degree centrality, closeness centrality, betweeness centrality, pagerank, density, and diameter. It is not possible to calculate cliques and triad census in Gephi tool. SocNetV tool gives excellent to calculate graph features. This tool analysis each and every vertex very deeply and display outcome in summarized
manner. Cytoscape tool provides less graph features compare to Gephi and SocNetV tools. Average execution time of Cytoscape tool is faster than others. The Graph Mining Analyst Professional can avail the optimized Graph Mining Attributes based Inference for Social Network Analysis and Visualization for the accurate and precise outcomes of Graph Mining Knowledge Discovery and to resolve any specific Graph Mining and Visualization research work.
V.
REFERENCES
[1]. Lei Tang and Huan Liu, "GRAPH MINING APPLICATIONS TO SOCIAL NETWORK ANALYSIS",Computer Science & Engineering Arizona State University
[2]. C. L. E. E.-Z. a. M. G. David Combe, "A comparative study of social network analysis and tools," International Workshop on Web Intelligence and Visual Enterprises 2, pp. 1-12, 2010.
[3]. Nadeem Akhtar, "Social Network Analysis Tools", Department of Computer Engineering, Zakir Husain College of Engineering & Technology Aligarh Muslim University Aligarh, India, DOI: 10.1109/CSNT.2014.83, April 2014 [4]. "Basics of Graph," [Online]. Available:
https://www.khanacademy.org/computing/comput
er-science/algorithms/graph-representation/a/describing-graphs.
[5]. Ioana-Alexandra , "An overview of Software Applications for Social Network Analysis ", Volume 3, Issue 3, October 2013, 71-77
[6]. https://gephi.org
[7]. http://socnetv.sourceforge.net [8]. http://www.cytoscape.org