ISSN: 2149-214X
www.jeseh.net
The Predictive Effect of Some Variables
on Fifth and Sixth Grade Students’
Scientific Process Skills
Cemal Tosun Bartın University
To cite this article:
Tosun, C. (2020). The predictive effect of some variables on fifth and sixth grade students’
scientific process skills.
Journal of Education in Science, Environment and Health (JESEH),
6
(1), 10-23.
DOI:10.21891/
jeseh.657339.
This article may be used for research, teaching, and private study purposes.
Any substantial or systematic reproduction, redistribution, reselling, loan, sub-licensing,
systematic supply, or distribution in any form to anyone is expressly forbidden.
Authors alone are responsible for the contents of their articles. The journal owns the
copyright of the articles.
DOI:10.21891/
jeseh.657339
The Predictive Effect of Some Variables on Fifth and Sixth Grade
Students’ Scientific Process Skills
Cemal Tosun
Article Info
Abstract
Article History
Received: 05 March 2019
The aim of this research was to investigate whether there was a predictive effect of the frequency of laboratory use of students, their academic success and attending various opportunities to learn science outside the classroom on the fifth and sixth grade students’ scientific process skills performance (SPSP). Also, it was investigated whether there was a significant relationship between the students’ SPSP and the grade level in which the concepts included in the test items were appropriate. The quantitative research methods were used in this study. Data were collected from 458 fifth and sixth grade students. Regression analysis was conducted to determine the effects of the frequency of laboratory use of students, their academic success and attending various opportunities to learn science outside the classroom on students’ SPSP. As a result, it was determined that students’ academic success was important predictor variables that affect the fifth and sixth grade students’ SPSP. It was also determined that the frequency of laboratory use of students had an important predictive effect on students’ causal scientific process skills performance (C-SPSP). Additionally, it was determined that various opportunities to learn science outside the classroom such as attending in science fairs and reading scientific journals had an important predictive effect on students’ SPSP. Although, it was also determined that the students’ SPSP differs according to the grade level, statistically significant relationship was not found between the students’ SPSP and the grade level in which the concepts included in the test items were appropriate.
Accepted: 10 November 2019
Keywords
Academic success Laboratory practice Scientific process skills performance Opportunities to learn science outside the classroom
Introduction
In today’s world, new knowledge is constantly produced and developed in science education. Contemporary science teaching programs (Next Generation Science Standard [NGSS], 2013) propose research and inquiry-based methods so that their students do not remain under this increasing knowledge. One of the special aims of the Turkish science teaching curriculum in the process of exploration of nature and understanding of the relationship between human and environment, is to adopt scientific process skills and scientific inquiry approach and to find solutions problems encountered in these fields (Ministry of National Education [MoNE], 2017).
The skills necessary to do scientific inquiry is not unique to scientists. The ability of middle school students to make scientific inquiry should be improved (National Research Council [NRC], 1996). Middle school students should be provided opportunities to engage in scientific inquiries. In-class and out-of-school learning environments should be designed to research and inquiry-based learning methods so that students can learn knowledge comprehensively and permanently.
Scientific Process Skills
Koslowski (1996) defines scientific process skills as the application of scientific methods in solving a problem. Scientific process skills are a most important tool to knowledge production and to edit the knowledge produced (Ostlund, 1998). Scientific process skills can be used at every stage of everyday life (Williams, Papiermo, Makel, & Ceci, 2004). Scientific process skills are important because it creates the basis of science education (Myers, Washburn, & Dyer, 2004). It is emphasized as one of the prime gains for the students (Germann, 1989). In addition, scientific process skills should be acquired to students with several activities in science teaching (Huppert, Lomask, & Lazarorcitz, 2002). Scientific process skills are used in decision making (NRC, 1996). Students who acquire scientific process skills are less dependent on their teachers in the class and they become independent learners (Settlage & Southerland, 2007). High-level thinking skills such as questioning, researching, problem solving and communication can be improved via scientific research (Cuevas, Lee, Hart, & Deaktor, 2005).
The Categories of Scientific Process Skills
Scientific process skills are divided into basic and high-level scientific process skills (Saat, 2004; Rezba, 2007). Basic skills are a pre-requisite for higher level skills (Rambuda & Fraser, 2004). Basic skills can be acquired by students from pre-school, while high-level skills can be acquired from the second level of primary education. Students are expected to acquire more complex scientific process skills in middle school. In some researchers, the scientific process skills divided into three as basic, causal and experimental scientific process skills, (Çepni, Ayas, Johnson, & Turgut, 1997).
The basic scientific process skills dimension includes observing, classifying, measuring, communicating, and recording data sub-dimensions. Ango (2002) mentioned that almost every scientific activity of science begins with observation. Classifying is the skill of grouping objects in accordance with their observed features. Measuring is defined as the skill to determine the size of events and objects using appropriate measuring tools. Communication is to convey one’s thoughts to others (Martin, 2003, p.86). Data recording is to convert the qualitative and quantitative data that is collected during experiments and observations into a form that is comprehendible by everyone.
The causal scientific process skills dimension includes inferring, predicting, defining operationally and identifying variables sub-dimensions. Inferring is the best estimate related to the reason of an existing situation (Martin, 2003, p.114). Prediction is to express opinion on what might happen in relation with an existing situation (Martin, 2003, p.106). Operational definition is that students know what process they do while experimenting and which tool they use and why. Identifying variables is to identify all variables that can affect the process of an experiment and is to express them.
The experimental scientific process skills consists of sub-dimensions such as hypothesizing, designing an experiment, changing and controlling variables, modeling and data interpretation (conclusion-decision). Hypothesizing is the best expression of the relationship between the variables (Martin, 2003, p.132). Designing an experiment is the skills that include the students’ original experiment design to test a hypothesis. Changing and controlling variables is that student to change or to control variables affected by the result and affecting the result and control variables and to identify the relationship between variables. Modeling is the skill of the student to materialize the data that they obtain from the experiment that they have designed to make that data more significant. Decision making is assessing the data obtained from an authentic experiment that is designed by using scientific process skills to come to a decision.
The Potential Variables Effect on Scientific Process Skills
fathers’ education level, number of family members, income level of family, having a computer and a study room on the students’ SPSP.
In addition, the studies in the literature also investigated the effect of the teaching approaches and methods on students’ scientific process skills level (e.g.: Akben, 2015), its relationship between students’ SPSP with their attitudes (e.g.: Downing & Filer, 1999; Germann, 1994; Lee, Eichinger, Anderson, Berkheimer, & Blakeslee, 1993; Zeidan & Jayosi, 2015) and their academic success (e.g.: Karar & Yenice, 2012b). There are also studies that conducted to define the result how measuring the same scientific process skills of test items developed with different contents (e.g.: Temiz, 2010). The studies in the literature investigated the effects of science textbooks and curriculums on the students’ SPSP and representation status of scientific process skills in textbooks and curriculums (e.g.: Soyibo, 1998; Şen & Nakiboğlu, 2012). It is stated in the literature that there are many studies that have been conducted on some demographic characteristics affecting students’ SPSP. The author did not find any research related to the predictive effects of frequency of laboratory use of students (FLUS) and students’ academic success (SAS) and opportunities to learn science outside the classroom on the students’ SPSP.
Importance of the Study
Contemporary science teaching programs (NGSS, 2013; MoNE, 2017) propose research and inquiry-based methods. Because such abilities not solely coordinated the higher order cognitive skills and the scientific process skills (NRC, 1996, p. 23), but also facilitated students' science learning. Students need to develop their scientific inquiry skills to facilitate science learning and to ensure that they are lifelong learners. It is important to provide opportunities to develop scientific process skills to improve students’ inquiry abilities. While basic scientific process skills can be acquired from pre-school period, higher level skills can be acquire from middle school. Therefore, it is expected that students will acquire high-level scientific process skills starting with middle school (Ergin, Şahin-Pekmez, & Öngel-Erdal, 2005). This study was carried out with fifth and sixth grade students since it was the first years of middle school.
Many studies have found that the students’ SPSS is low (Walters & Soyibo, 2001) or moderate level (Shahali & Halim, 2010). It is important to know the factors that effect of students’ SPSP. Educational policy-makers are interested in what factors a more significant impact on students’ SPSP. Science teaching is usually carried out in classrooms, laboratories and out-of-classroom learning environments (Orion & Hofstein, 1994). Science education in middle schools should expand beyond the classroom walls and out-of-classroom learning environments offer many opportunities for students to science learning (Carrier, 2009). Observations, presentations and laboratory practices are the best away of identifying students’ SPSP (Lavinghousez, 1973). Understanding the change students’ SPSP depends on the presentation and applicability of the subject (Buck, Bretz, & Towns, 2008; Pyle, 2008). The reach of the purpose of experimental activities in science courses requires some scientific process skills. These skills are generally applied in the laboratory. The quality of laboratory activities is an important factor in the students’ SPSP (Ercan, 1996). The scientific process skills are acquired during the learning process. Hence the factors affecting scientific process skills are found in the process itself (Nwosu, 1991). Therefore, the effect of three learning environments on students’ SPSP was investigated in this study.
Teacher’s competence, teaching methods, instructional materials, parents' background, gender, school location, school type, teacher sensitivity, students’ cognitive abilities and cognitive demands, teachers’ experiences, and the family’ socio-economic status are some factors that affect students' SPSP (Martina, 2007). Students' SPSP and the factors affecting these performances is important field of study in educational research. But the author did not find any research related to the predictive effects of FLUS and SAS and opportunities to learn science outside the classroom on the students’ SPSP.
Aims of the Study
1- What are the predictive effects of FLUS, SAS and opportunities to learn science outside the classroom on the fifth and sixth grade students’ basic scientific process skills performance (B-SPSP), causal scientific process skills performance (C-SPSP), experimental scientific process skills performance (E-SPSP) and total scientific process skills performance (T-(E-SPSP).
2- Are there a significant relationship between the students’ SPSP and the grade level in which the concepts included in the test items were appropriate?
Method
The correlational-research method was used while identifying whether there were predictive effects of FLUS, SAS and opportunities to learn science outside the classroom on the fifth and sixth grade students’ SPSP. The relationship between two or more groups or phenomena is examined in the correlational-research design (McMillan & Schumacher, 2010).
Sample
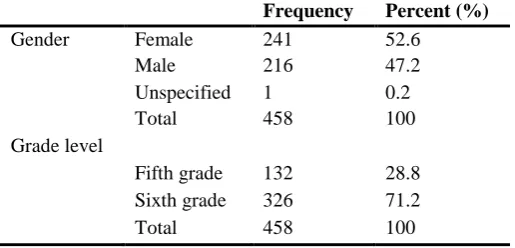
The sample of the study was composed of totally 458 fifth and sixth grade students from six provinces in Turkey designated via non-random sampling method. Sample group selected by using the convenience sampling method consists of individuals who are available for study easier (Fraenkel & Wallen, 2006, p.99). The sample group was not represent all fifth and sixth grade students in Turkey. Necessary permissions were obtained from the school administrations to collect data. Participation in the test was based on volunteerism. The participants were explained that the test items did not contain questions and situations that would cause personal discomfort. However, if participants feel uncomfortable with questions or any other reason during the participation, they are told that they may stop answering. It has been explained that in case of non-participation or withdrawal from the research, academic achievement, relations with school and teachers will not be affected. Detailed information about the sample group is shown in table 1.
Table 1. The sampling for the application of the scientific process skills test (SPST) (N=458) Frequency Percent (%)
Gender Female 241 52.6
Male 216 47.2
Unspecified 1 0.2
Total 458 100
Grade level
Fifth grade 132 28.8
Sixth grade 326 71.2
Total 458 100
Data Collection Tools
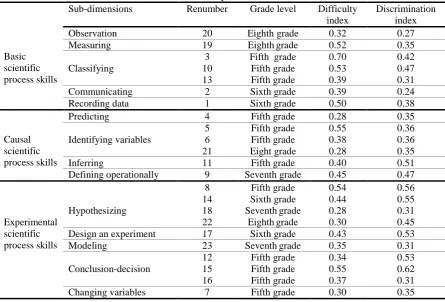
Table 2. The items’ difficulty and discrimination indexes Sub-dimensions Renumber Grade level Difficulty
index
Discrimination index
Basic scientific process skills
Observation 20 Eighth grade 0.32 0.27
Measuring 19 Eighthgrade 0.52 0.35
Classifying
3 Fifth grade 0.70 0.42
10 Fifth grade 0.53 0.47
13 Fifth grade 0.39 0.31
Communicating 2 Sixth grade 0.39 0.24
Recording data 1 Sixth grade 0.50 0.38
Causal scientific process skills
Predicting 4 Fifth grade 0.28 0.35
Identifying variables
5 Fifth grade 0.55 0.36
6 Fifth grade 0.38 0.36
21 Eight grade 0.28 0.35
Inferring 11 Fifth grade 0.40 0.51
Defining operationally 9 Seventh grade 0.45 0.47
Experimental scientific process skills
Hypothesizing
8 Fifth grade 0.54 0.56
14 Sixth grade 0.44 0.55
18 Seventhgrade 0.28 0.31
22 Eighthgrade 0.30 0.45
Design an experiment 17 Sixth grade 0.43 0.53
Modeling 23 Seventhgrade 0.35 0.31
Conclusion-decision
12 Fifth grade 0.34 0.53
15 Fifth grade 0.55 0.62
16 Fifth grade 0.37 0.31
Changing variables 7 Fifth grade 0.30 0.35
Subsequent to item analysis, a total of 24 items from the basic, causal and experimental scientific process skills dimensions were put through confirmatory factor analysis, after which one item was excluded from the test. In this study, SPST which was developed by Tosun (2017) and containing 23 items in 3 dimensions was used. Below, some of the items included in the basic, causal and experimental scientific process skills dimensions are given (All names mentioned in test items are not the students’ real names).
Sample item for the basic scientific process skills
Upon entering the science laboratory, Zehra and her friends find the experimental setup. The experimental setup has two different amounts of the same liquid being heated. The teacher asks the students to find the boiling point of the liquids. Examining the experimental set up observantly, Zehra notices that the lower-amount liquid is giving out vapor and bubbles. Immediately, she writes the thermometer value down. Soon after she sees that the bigger-amount liquid is giving out only vapor and she writes the thermometer value down.
Item3. Looking at the results, the teacher tells Zehra that she has made a mistake. According to the information above, which two concepts classified below did Zehra confuse and make a mistake?
Concept I Concept II A) Boiling Evaporation B) Evaporation Condensation C) Melting Freezing D) Boiling Condensation
Sample item for the causal scientific process skills
mother and Ahmet are made of the same material; they have the same length; and they are lit in the same room temperature, they last different periods of time since their diameters are different.
Item5. Which one of the below is the independent variable in this sample problem? A) The material the candles are made of
B) The lasting time of the candles C) The diameters of the candles D) The difference in the candles’ length
Sample item for the experimental scientific process skills
Melis goes on a tour in Cappadocia with her family in the summer vacation. She convinces her father to take a touristic hot-air balloon ride. Looking for answers to many questions in her mind about the processing principle of the balloons, Melis observes the ride. She notices that the balloon is initially filled with cool air via a powerful fan up to a certain point; and then it is elevated with the heating of the air with heaters.
Item14. With her observation, which of the below hypotheses does Melis test? A) Hot air is lighter than cool air.
B) Cool air is lighter than hot air. C) The balloon was elevated by the wind.
D) The balloon will also rise if it is filled with helium which has a lower density than air
Data Analysis
The students were given 1 point for each correct answer and 0 points for each wrong answer. The t-test was used to determine the relationship between the students’ SPSP and the grade level in which the concepts included in the test items were appropriate. The ANOVA was conducted to determine whether there was effect of attending various opportunities to learn science outside the classroom on the students’ SPSP. In the next step, the data was analyzed according to some predictor variables. At this step, regression analysis was used.
All of the predictive variables were nominal. Predictive variables such as FLUS, SAS, attending in science trips (AST) attending in science competitions (ASC), attending in science fairs (ASF) and designing projects (DP) and reading scientific journals (RSJ) are the qualitative variables with two categories. Before the regression analysis, FLUS codes were determined as “usually = 1” and “sometimes = 0”. Academic success codes were determined as “the previous semester’s grade averages 85 and over = 1” and “the previous semester’s grade averages below 85 = 0”. Science trips, competitions and, fairs codes were determined as “attending = 1” and “not attending = 0”. Projects coded were determined as “DP = 1” and “not DP = 0”. Scientific journals coded were determined as “RSJ = 1” and “not RSJ = 0”. All of the predictive variables were included in regression analysis at the same time.
Results
Descriptive Findings for the SPST
The normality of the data was checked according to the measures of central tendency. It was found that the mode, median and the mean values of the basic, causal, experimental and total scientific process skills, were close. Besides, skewness and kurtosis coefficients are given in table 3.
Table 3. Skewness and kurtosis coefficient for sub-dimensions and overall the test
Sub-dimensions Skewness Kurtosis
When table 3 is examined, it is acknowledged that the data is within the normal distribution range as the skewness and kurtosis coefficients for the total scientific process skills test and the sub-dimensions (the basic, causal and experimental) are between -1 and +1 (Morgan, Leech, Gloeckner, & Barret, 2004).
Reliability for the SPST
The reliability coefficient was calculated using the data gathered from 458 fifth and sixth grade students. The reliability coefficient of the basic scientific process skills sub-dimension was calculated as 0.61. The reliability coefficient of the causal scientific process skills sub-dimension was calculated as 0.57. The reliability coefficient of the experimental scientific process skills sub-dimension was calculated as 0.53. Cronbach’s alpha for all dimensions of the SPST was calculated to be 0.62. According to these results, the test is reliable (Shum, O’Gorman, & Myors, 2006).
Confirmatory Factor Analysis
Confirmatory factor analysis was conducted to verify the accuracy of data gathered from 458 fifth and sixth grade students. Confirmatory factor analysis was conducted via the LISREL 8.8 statistics program. The results of confirmatory factor analysis are given in table 4.
Table 4. Confirmatory factor analysis results for SPST
χ2 sd χ2/sd GFI AGFI RMSEA RMR SRMR
380.07 227 1.67 0.93 0.92 0.038 0.011 0.052
The ratio of the Chi squared value to the degree of freedom (χ2/sd ratio) (380.07/227=1.67) is below 3, which means a good fit index (Kline, 2005). The fact that the RMSEA value (0.038) is below 0.05 indicates a good fit index (Jöreskog & Sörbom, 1993). The fact that the GFI fit indexes (0.93) and AGFI fit indexes (0.92) are above 0.90 shows an acceptable fit index. According to Table 4, RMR value (0.011) is below 0.05 indicates a good fit index, while SRMR value (0.052) is below 0.08 indicates an acceptable fit index (Brown, 2006).
Results for Research Question 1
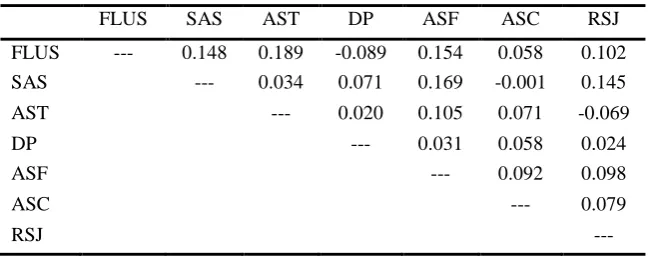
The correlation values among the independent variables were calculated and the results are presented in Table 5. Table 5. Correlation between all of the variables
FLUS SAS AST DP ASF ASC RSJ
FLUS --- 0.148 0.189 -0.089 0.154 0.058 0.102
SAS --- 0.034 0.071 0.169 -0.001 0.145
AST --- 0.020 0.105 0.071 -0.069
DP --- 0.031 0.058 0.024
ASF --- 0.092 0.098
ASC --- 0.079
RSJ ---
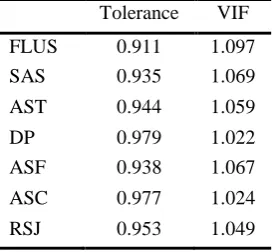
Correlation values of more than 0.80 means a high correlation between variables (Field, 2005, p.224). When Table 5 is examined it is seen that there is not a high correlation between the predictive variables. Another way to determine the multiple correlations between the predictive variables is to examine the variance inflation factor (VIF) or tolerance values. Tolerance and VIF values were examined as shown in Table 6.
Table 6. Tolerance and variance inflation factor (VIF) values Tolerance VIF
FLUS 0.911 1.097
SAS 0.935 1.069
AST 0.944 1.059
DP 0.979 1.022
ASF 0.938 1.067
ASC 0.977 1.024
RSJ 0.953 1.049
The predictive effect of all variables on the B-SPSP
Regression analysis was conducted to identify the predictive effect of FLUS, SAS and attending various opportunities to learn science outside the classroom on the students’ B-SPSP (See Table 7).
Table 7. Regression analysis for the predictive effect of all variables on the B-SPSP
Variables B Std. Error β t p Zero-order (r) Partial (r)
Constant 1.691 0.168 10.042 0.000
FLUS 0.011 0.163 0.004 0.066 0.947 0.038 0.004
SAS 0.717 0.168 0.226 4.257 0.000 0.279 0.232
AST -0.156 0.187 -0.044 -0.833 0.405 -0.027 -0.047
DP 0.675 0.162 0.217 4.175 0.000 0.236 0.228
ASF 0.530 0.194 0.145 2.728 0.007 0.190 0.151
ASC -0.254 0.248 -0.053 -1.027 0.305 -0.023 -0.057
RSJ 0.294 0.159 0.097 1.844 0.066 0.149 0.103
The results of the analysis reveal that FLUS, SAS levels and students’ AST, ASF, ASC, DP and RSJ show a significant relationship (R2 = 0.159) with students’ B-SPSP (F (7-318) = 8.583; p< 0.05). The 7 variables together
explain the 15.9% of change in basic scientific process skills scores. SAS levels (β = 0.226, p<0.05), DP (β = 0.217, p<0.05) and ASF (β = 0.145, p<0.05) are significant predictors of the students’ B-SPSP.
The predictive effect of all variables on the C-SPSP
Regression analysis was conducted to identify the predictive effect of FLUS, SAS and opportunities to learn science outside the classroom on the students’ C-SPSP (See Table 8).
Table 8. Regression analysis for the predictive effect of all variables on the C-SPSP
Variables B Std. Error β t p Zero-order (r) Partial (r)
Constant 1.536 0.150 10.206 0.000
FLUS 0.343 0.146 0.133 2.351 0.019 0.164 0.131
SAS 0.431 0.150 0.159 2.864 0.004 0.200 0.159
AST -0.171 0.167 -0.057 -1.020 0.309 -0.031 -0.057
DP -0.051 0.145 -0.019 -0.353 0.724 -0.018 -0.020
ASF 0.153 0.174 0.049 0.881 0.379 0.098 0.049
ASC -0.112 0.221 -0.027 -0.505 0.614 -0.012 -0.028
RSJ 0.281 0.142 0.109 1.975 0.049 0.152 0.110
The results of the analysis reveal that FLUS, SAS levels, students’ AST, ASF, ASC, DP and RSJ show a significant relationship (R2 = 0.077) with students’ C-SPSP (F (7-318) = 3.813; p <0.05). The 7 variables together
The predictive effect of all variables on the E-SPSP
Regression analysis was conducted to identify the predictive effect of FLUS, SAS and attending various opportunities to learn science outside the classroom on the students’ E-SPSP (See Table 9).
Table 9. Regression analysis for the predictive effect of all variables on the E-SPSP
Variables B Std. Error β t p Zero-order (r) Partial (r)
Constant 2.024 0.193 10.513 0.000
FLUS 0.090 0.187 0.026 0.484 0.629 0.080 0.027
SAS 0.581 0.193 0.162 3.016 0.003 0.229 0.167
AST 0.000 0.214 0.000 -0.002 0.998 0.012 0.000
DP 0.341 0.185 0.097 1.842 0.066 0.108 0.103
ASF 0.785 0.222 0.190 3.532 0.000 0.228 0.194
ASC -0.726 0.283 -0.135 -2.564 0.011 -0.098 -0.142
RSJ 0.546 0.182 0.160 3.001 0.003 0.197 0.166
The results of the analysis reveal that FLUS, SAS, AST, DP, ASF, ASC and RSJ show a significant relationship (R2 = 0.138) with students’ E-SPSP (F (7-318) = 7.250; p <0.05). The 7 variables together explain the 13.8% of
change in experimental scientific process skills scores. ASF (β = 0.190, p<0.05), SAS (β = 0.162, p<0.05), RSJ (β = 0.160, p<0.05) and ASC (β = -0.135, p<.005) are significant predictors of the students’ E-SPSP.
The predictive effect of all variables on the T-SPSP
Regression analysis was conducted to identify the predictive effect of FLUS, SAS and attending various opportunities to learn science outside the classroom on the students’ T-SPSP (See Table 10).
Table 10. Regression analysis for the predictive effect of all variables on the T-SPSP
Variables B Std. Error β t p Zero-order (r) Partial (r)
Constant 5.251 0.350 15.000 0.000
FLUS 0.444 0.339 0.068 1.309 0.191 0.125 0.073
SAS 1.729 0.350 0.254 4.938 0.000 0.330 0.267
AST -0.327 0.389 -0.043 -0.840 0.401 -0.019 -0.047
DP 0.965 0.336 0.145 2.869 0.004 0.159 0.159
ASF 1.468 0.404 0.187 3.634 0.000 0.247 0.200
ASC -1.092 0.515 -0.107 -2.121 0.035 -0.067 -0.118
RSJ 1.121 0.331 0.173 3.387 0.001 0.233 0.187
The results of the analysis reveal that FLUS, SAS, AST, DP, ASF, ASC and RSJ show a significant relationship (R2 = 0.210) with students’ T-SPSP (F (7-318) = 12.085; p <0.05). The 7 variables together explain the 21.0% of
change in total scientific process skills scores. SAS (β = 0.254, p<0.05), ASF (β = 0.187, p<0.05), RSJ (β = 0.173, p<0.05), DP (β = 0.145, p<0.05) and ASC (β = -0.107, p<0.05) are significant predictors of the students’ T-SPSP.
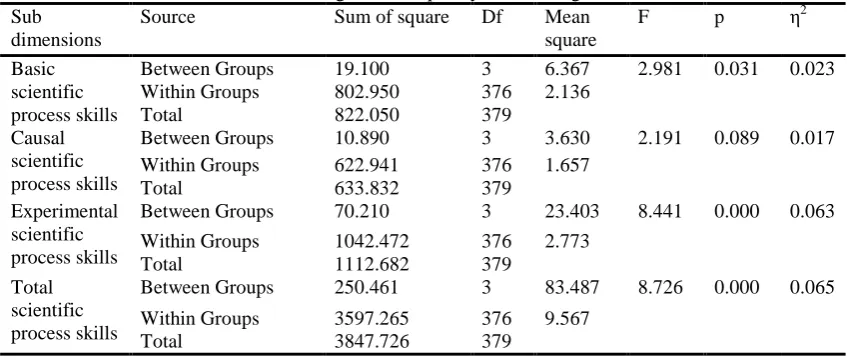
Additionally, the ANOVA was conducted to determine whether there was effect of attending various opportunities to learn science outside the classroom on the fifth and sixth grade students’ SPSP. Results of ANOVA are given in table 11. An examination of Table 11 shows that there is a statistically significant relationship between the frequency of attending various scientific activities and the students’ B-SPSP [F(3,376)= 2.981, p<0.05], E-SPSP [F(3,376)= 8.441, p<0.05] and T-SPSP [F(3,376)= 8.726, p<0.05]. To find out in what frequency this difference exists, the Tukey test was conducted to the experimental and total scientific process skills sub-dimensions where the group variances were assumed to be equal. For the basic scientific process skills sub-dimension that the group variances were not assumed to be equal, Tamhane’s T2 test results were used. The Tukey test was preferred due to the fact that the number of the groups was high (Sipahi, Yurtkoru, & Çinko, 2008, p.128).
SD=2.91) are lower than those attending in the two (M=8.27, SD=3.35) and four different science activities (M=9.26, SD=3.04). This difference is in favor of the students who participate in different science activities. In Table 11, the eta-square values of the students’ B-SPSP (η2=0.023) and C-SPSP (η2=0.017) have a small effect size while the eta square values of their E-SPSP (η2=0.063) and T-SPSP (η2=0.065) have a medium effect size.
Table 11. Results of ANOVA according to the frequency of attending in various scientific activities Sub
dimensions
Source Sum of square Df Mean
square
F p η2
Basic scientific process skills
Between Groups 19.100 3 6.367 2.981 0.031 0.023
Within Groups 802.950 376 2.136
Total 822.050 379
Causal scientific process skills
Between Groups 10.890 3 3.630 2.191 0.089 0.017
Within Groups 622.941 376 1.657
Total 633.832 379
Experimental scientific process skills
Between Groups 70.210 3 23.403 8.441 0.000 0.063
Within Groups 1042.472 376 2.773
Total 1112.682 379
Total scientific process skills
Between Groups 250.461 3 83.487 8.726 0.000 0.065
Within Groups 3597.265 376 9.567
Total 3847.726 379
Results for Research Question 2
The second question of our research whether there was a significant relationship between the students’ SPSP and the grade level in which the concepts included in the test items were appropriate. The fact that the data was distributed normally, the t-test for independent samples was used to determine whether there was any difference between the fifth and the sixth grade students’ SPSP. The data obtained that are given Table 12.
Table 12. Independent sample t-test according to the grade level
Sub dimensions Grade level N M SD df t p
Basic scientific process skills Fifth grade 132 2.15 1.25 290.247 -3.001 0.003 Sixth grade 326 2.57 1.51
Causal scientific process skills Fifth grade 132 2.02 1.12 290.186 -0.214 0.831 Sixth grade 326 2.04 1.35
Experimental scientific process skills Fifth grade 132 2.59 1.68 456 -1.918 0.056 Sixth grade 326 2.92 1.65
Total scientific process skills Fifth grade 132 6.77 2.75 283.972 -2.570 0.011 Sixth grade 326 7.54 3.24
The results of the analysis reveal that (see table 12) the rate of correct answers given to the 23-item test was lower in fifth grade students (M=6.77, SD=2.75) than in the sixth graders (M=7.54, SD=3.24). Considering the item numbers in each dimension of the test (7 items for basic scientific process skills, 6 items for causal scientific process skills, and 10 items for experimental scientific process skills), it can be observed that the students’ SPSP is low in the sub dimensions of basic, causal, experimental and total scientific process skills. On the other hand, while there is a significant difference between the students’ B-SPSP [t(290.247) = -3.001, p<0.05] and T-SPSP [t(283.972) = -2.570, p<0.05], there is no significant difference between the students’ C-SPSP [t(290.186) = -0.214, p>0.05] and E-C-SPSP [t(456) = -1.918, p>0.05]. This difference is in favor of the 6th graders. Table 13 was formed to determine which items differences significantly.
Table 13. Items with a significant difference
Items Grade level N M SD df t p
4 Fifth grade 130 0.17 0.37 303.757 -4.464 0.000 Sixth grade 317 0.36 0.48
10 Fifth grade 131 0.27 0.44 262.695 -2.879 0.004 Sixth grade 325 0.41 0.49
13 Fifth grade 129 0.16 0.36 297.804 -3.711 0.000 Sixth grade 322 0.31 0.46
14 Fifth grade 130 0.18 0.38 282.588 -2.931 0.004 Sixth grade 319 0.31 0.46
15 Fifth grade 132 0.33 0.47 255.772 -2.576 0.011 Sixth grade 323 0.46 0.49
16 Fifth grade 130 0.10 0.30 339.164 -4.028 0.000 Sixth grade 315 0.24 0.43
21 Fifth grade 131 0.49 0.50 235.318 2.192 0.029 Sixth grade 317 0.38 0.48
Conclusion and Discussion
In the current study, the predictive effects of FLUS, SAS and attending various opportunities to learn science outside the classroom on the students’ B-SPSP, C-SPSP, E-SPSP and T-SPSP was investigated. Within this aim, it was determined that students’ success levels are a significant predictor on the students’ B-SPSP, C-SPSP, E-SPSP and T-E-SPSP. This finding is consistent with the results of Karar and Yenice (2012b)’s study which researchers conducted with eighth grade students, and reported that there is a moderately positive and significant relationship between the students’ SPSP and SAS in the science. Similar findings were reported by Lee et al., (1993) and German, (1994). Also, it has been reported in the literature that there was a highly positive relationship between the academic success of pre-services teachers and their’ SPSP (Sittirug, 1997).
In addition, the predictive effect of FLUS on the students’ B-SPSP, C-SPSP, E-SPSP and T-SPSP was investigated. It was found that FLUS was significant predictors on the students’ C-SPSP. This findings is consistent with the results of Tamir and Lunetta (1981)’s study which reported that the main purpose of the laboratories is to provide students with scientific inquiry and research skills. In the current study also revealed that FLUS did not have any predictive effect on the students’ B-SPSP, E-SPSP and T-SPSP. Recently, hands-on learning methods are used in the world and in Turkey in laboratory practice. Hand-on learning means learning by doing it as simple. In this method, tools are created with simple materials that students use in daily life. With these tools, students observe, explain, comprehend and think about an event or a phenomenon. According to NRC (1996), conducting hands-on science activities does not guarantee inquiry. This suggestion can be interpreted as hands-on science activities made with tools are created using simple materials have no effect on students’ inquiry abilities and, thus, students’ other SPSP except for the skills to predicting, identifying variables, inferring and defining operationally. Conversely, it has been also reported in the literature that the science teaching carried out with simple tools has a positive effect on the development of students' scientific process skills (Yu & Bethel, 1991). The science experiments carried out with simple tools lead to the development of students’ many skills related to science (Klemm & Plourde, 2003).
Saraçoğlu (2011) stated that there was a significant difference between sixth, seventh and eighth grade students’ scientific process skills in favor of the eighth graders.
The results of this study revealed that students’ SPSP is low in the sub dimensions of B-SPSP, C-SPSP, E-SPSP and T-SPSP. It is reported in the literature that the primary school students’ scientific process skills levels are also low (Ango, 2002). A similar result was also put forward by Walters and Soyibo (2001). The aforementioned study also expressed that the high-level scientific process skills of the students is not high. In the study of Shahali and Halim (2010), they developed the test of integrated science process and reported that the primary school students’ SPSP was moderate level. The studies by Böyük, Tanık and Saraçoğlu (2011) also reported that the middle school students’ SPSP has a moderate level. According to the PISA 2006 results, science education at the middle school level in the world was inadequate in providing the targeted knowledge, skills and understanding (OECD, 2007). Another study conducted with pre-services teachers found the same results (Foulds & Rowe, 1996). Germann and Aram (1996)’s study revealed that students recorded data successfully but failed to achieve results for hypotheses and activities. A research by Griffiths and Thompson (1993) concluded that students limited their observations to the use of their senses; their predicting skills did not improve; and that almost half of them had misconceptions about hypothesizing or, even worse, they confused hypothesizing with predicting correctly. In addition to educational research literature, the most important predictor variables on students’ SPSP were found to be SAS levels and ASF and RSJ in this study. Also, no relationship was found between and the grade level in which the concepts included in the SPST items were appropriate and the students’ SPSP.
Acknowledgements
The author would like to thank the Scientific Research Projects Unit of Bartın University for financial support (Project Number 2016 SOS-A-005).
References
Akben, N. (2015). Improving science process skills in science and technology course activities using the inquiry method. Education and Science, 40(179), 111 -132.
Ango, M. L. (2002). Mastery of science process skills and their effective use in the teaching of science: An educology of science education in the Nigerian context. International Journal of Educology, 16(1), 11-30.
Böyük, U., Tanık, N., & Saraçoğlu, S. (2011). Analysis of the scientific process skill levels of secondary school students based on different variables. Journal of TUBAV Science, 4(1), 20-30.
Buck, L. B., Bretz, S. L. & Towns, M. H. (2008). Characterizing the level of inquiry in the undergraduate laboratory. Research and Teaching, 38(1), 52-58.
Brown T. A. (2006). Confirmatory factor analysis: for applied research, New York: Guilford.
Carrier, S. J., (2009). The effects of outdoor science lessons with elementary school students on preservice teachers’ self-efficacy. Journal of Elementary Science Education, 21(2), 35–48. https://doi.org/10.1007/BF03173683
Cuevas, P., Lee, O., Hart, J. & Deaktor, R. (2005). Improving science inquiry with elementary studets of diverse backgrounds. Journal of Research in Science Teaching, 42(3), 337-357.
Çepni, S., Ayas, A., Johnson, D., & Turgut, M. F. (1997). Fizik öğretimi: Milli eğitimi geliştirme projesi [Physics teaching: National education development project]. Ankara.
Downing, J. E. & Filer, J.D. (1999). Science process skills and attitudes of preservice elementary teachers, Journal of Elementary Science Education, 11(2), 57-64.
Ercan, E. B. (1996). The perceptions of teachers on the development of the science process skills at 4 and 5 grades. Master Thesis, Middle East Technical University, Ankara.
Ergin, Ö., Şahin-Pekmez, E. & Öngel-Erdal, S. (2005). Kuramdan uygulamaya deney yoluyla fen öğretimi [Teaching science through experimentation from theory to practice]. İzmir: Dinazor kitapevi.
Field, A. (2005), Discovering statistics using SPSS. London: Sage Publication.
Fraenkel, J. R., & Wallen, N. E. (2006). How to design and evaluate research in education (6th ed.). Boston: McGraw Hill Higher Education.
Foulds, W. & Rowe, J. (1996). The enhancement of science process skills in primary teacher education students. Australian Journal of Teacher Education, 21(1), 16-23.
Germann, P. J. & Aram, R.J. (1996). Student performances on the science process of recording data, drawing conclusions and providing evidence. Journal of Research in Science Teaching, 33(7), 773-798. Germann, P. J., (1994). Testing a model of science process skills acquisition: An interaction with parents,
education, preffered language, gender, science attitude, cognitive development, academic ability, and biology knowledge. Journal of Research in Science Teaching, 31(7), 749-783.
Griffiths, A. & Thompson, J. (1993). Secondary school students’ understandings of scientific process: An interview study, Research in Science & Technological Education, 11(1), 15-26.
Güden, C., & Timur, B. (2016). Ortaokul öğrencilerinin bilimsel süreç becerilerinin incelenmesi (Çanakkale örneği) [Examining secondary school students’ cognitive process skills (Çanakkale sample)]. Abant İzzet Baysal Üniversitesi Eğitim Fakültesi Dergisi, 16(1), 163-182.
Harlen, W. (1999). Purposes and procedures for assessing science process skills. Assessment in Education, 6(1), 129-144.
Huppert, J., Lomask, S. M. & Lazarorcitz, R. (2002). Computer simulations in the high school: students’ cognitive stages, science process skills and academic achievement in microbiology. International Journal of Science Education, 24(8), 803-821.
Jöreskog K. G., & Sörbom D., (1993). Lisrel 8: Structural equation modeling with the SIMPLIS command language, Lincolnwood: Scientific Software International, Inc.
Karar, E. E., & Yenice, N. (2012a). The investigation of scientific process skill level of elementary education 8th grade students in view of demographic features. Procedia-Social and Behavioral Sciences 46, 3885-3889.
Karar, E. E., & Yenice, N. (2012b). Analysis of the scientific process skill level of primary school 8th grade students based on different variables. Çukurova University Faculty of Education Journal, 21(1), 83-100.
Keith, T. (2006). Multiple regression and beyond. Boston, MA: Pearson.
Klemm, E. B. & Plourde, L. A. (2003). Examining the multi-sensory charectiristics of hands-on science activities. The Annual Meeting of the Association for the Education of Teachers of Science, Sn.Louise (January 29-February 2, 2003).
Kline R. B. (2005). Principles and practice of structural equation modeling, 2nd edn, NY: Guilford Publications, Inc.
Koslowski, B. (1996). Theory and evidence: The development of scientific reasoning. Cambridge: MIT Press. Lavinghousez, W.E.Jr. (1973). The analysis of the biology readiness scale (BRS), as a measure of inquiry skills
required. Paper presented at BSCS Biology, College of Education, University of Central Florida. Lee, O., Eichinger, D. C., Anderson, C. W., Berkheimer, G. D. & Blakeslee, T. S. (1993). Changing middle
scholl students’ conceptions of matter and molecules. Journal of Research in Science Teaching, 30(3), 249-270.
Martin, D. J. (2003). Elementary science methods: a constructivist approach (3rd ed.). USA: Thomson Publishing Company.
Martina E. N., (2007), Determinants of J.S.S. students’ level of acquisition of science process skills, Master Thesis, Nsukka: University of Nigeria.
Ministry of National Education (MoNE), (2017). Ortaöğretim fen bilimleri dersi öğretim programı [Secondary science curriculum], Ankara.
McMillan, J.H. & Schumacher, S. (2010). Research in education: Evidence-based inquiry (7th edn), Boston: Pearson.
Morgan G. A., Leech N. L., Gloeckner G. W. & Barret K. C. (2004). SPSS for introductory statistics: use and interpretation, 2nd edn, London: Lawrence Erlbaum Associates.
Myers, B. E., Washburn, S. G. & Dyer, J. E. (2004). Assessing agriculture teachers’ capacity for teaching science integrated process skills. Journal of Southern Agricultural Education Research, 54(1), 74-85. National Research Council (NRC). (1996). National science education standards. Washington, DC: National
Academy Press.
NGSS Lead States, (2013). Next generation science standards: for states, by states, Washington, DC: The National Academies Press.
Nwosu, N. M. (1991). The effects of teacher sensitization on secondary school students’ level of acquisition of science process skills. Unpublished PhD dissertation, Nsukka: University of Nigeria.
Organisation for Economic Co-operation and Development (OECD), (2007). PISA 2006: Science competencies for tomorrow’s world: volume 1-Analysis. Retrieved from http://www. oecd. ilibrary.org/education/pisa2006_9789264040014-en.
Orion, N., & Hofstein A., (1994). Factors that influence learning during a scientific field trip in a natural environment. Journal of Research Science Teaching, 31(10), 1097–1119
Pyle, E. J. (2008). A model of inquiry for teaching earth science. Electronic Journal of Science Education. 12(2), 3-21.
Rambuda, A.M. & Fraser, W.J. (2004). Perceptions of teachers of the application of science process skills in the teaching of geography in secondary schools in the Free State province. South African Journal of Education, 24(1), 10-17.
Rezba, R. J., Sprague, C., McDonnough, J. T. & Matkins, J. J. (2007). Learning and assessing science process skills. Iowa: Kenndall/Hunt Publishing Company.
Rillero, P. (1998). Process skills and content knowledge. Science Activities, 35(3), 3-4.
Saat, R. M. (2004). The acquisition of integrated science process skills in a web-based learning environment. Research in Science & Technological Education, 33(1), 23-40.
Settlage, J. & Southerland, S. (2007). Teaching science to every child. New York: Routledge Taylor & Francais Group.
Shahali, E.H.M. & Halim, L. (2010). Development and validation of a test of integrated science process skills. Procedia Social and Behavioral Sciences, 9, 142-146.
Shum, D., O’Gorman, J., & Myors, B. (2006). Psychological testing and assessment. Oxford: Oxford University
Press.
Sipahi, B., Yurtkoru, E. S., & Çinko, M. (2008). Sosyal bilimlerde SPSS’le veri analizi. [Data analysis with SPSS in social sciences] İstanbul: Beta yayınları.
Sittirug, H. (1997). The predictive value of science process skills, attitude toward science, and cognitive development on achievement in a Thai teacher institution. Unpublished PhD. Thesis, University of Missouri-Columbia.
Soyibo, K. (1998). An assessment of caribbean integrated science textbooks’ practical tasks. Research in Science & Technological Education, 16(1), 31-41.
Şen, A. Z. & Nakiboğlu, C. (2012). Ortaöğretim kimya ders kitaplarının bilimsel süreç becerileri açısından incelenmesi [Analyze of high school chemistry textbooks’ in terms of science process skills]. Ahi Evran Üniversitesi Kırşehir Eğitim Fakültesi Dergisi (KEFAD), 13(3), 47-65.
Tamir, P. & Lunetta, V.N. (1981). Inquiry-related tasks in high school science laboratory handbooks. Science Education, 65(5), 477-484.
Temiz, B. K. (2010). The importance of the item’s contents at assessment of the science process skills. E-Journal of New World Sciences Academy, 5(2), 614-628.
Tosun, (2017). Madde ve değişim öğrenme alanı kapsamında 5. ve 6. sınıf düzeyine uygun bilimsel süreç beceri testi geliştirilmesi: Geçerlik ve güvenirlik çalışması [Scientific process skills test development within the topic “Matter and its Nature” for 7th and 8th grade students: Validity and reliability study]. Paper
presented at 5th International Instructional Technologies & Teacher Education Symposium-ITTES 2017, Abstract Proceedings, p.231.
Tosun, (2019). Scientific process skills test development within the topic “Matter and its Nature” and the predictive effect of different variables on 7th and 8th grade students’ scientific process skill levels. Chemistry Education Research and Practice, 20, 160-174.
Walters, B. & Soyibo, K. (2001). An analysis of high school student’s performance on five integrated science process skills, Research in Science & Techological Education, 19(2), 133-143.
Williams, M. W., Papierrno, P. B., Makel, M. C. & Ceci, S. J. (2004). Thinking like a scientist about real world problems: The Cornell institute for research on children science education program. Applied Developmental Psychology, 25, 107-126.
Yu, S. M. & Bethel, L. J. (1991). The influence of hands on science process skills training on preservice elementary teachers’ anxiety and concerns about teaching science activities in Taiwan, republic of China. The Annual Meeting of the National Association for Research in Science Teaching, Lake Geneva (April 7-10, 1991).
Zeidan, A. H. & Jayosi, M.R. (2015). Science process skills and attitudes toward science among Palestinian secondary school students. World Journal of Education, 5(1), 13-24.
Author Information
Cemal TOSUN Bartın University