Performance Evaluation of Beacon Congestion
Control Algorithms for VANETs
Long Le
1, Roberto Baldessari
1, Pablo Salvador
2, Andreas Festag
1, and Wenhui Zhang
11NEC Laboratories Europe, NEC Europe Ltd.
2Institute IMDEA Networks and University Carlos III of Madrid
Abstract—Beacon and event-driven warning messages are two
important messages that are used by many Intelligent
Trans-portation Systems (ITS) applications for improving road safety
and traffic efficiency. Beacon messages are regularly broadcast by each vehicle to notify other vehicles of its presence and its status. Event-driven warning messages are emitted when a vehicle or the road infrastructure discerns a critical situation. When congestion occurs, it is necessary to reduce the beacon load to keep a certain amount of the available bandwidth for the event-driven messages because they carry time-critical information of high importance. This paper considers three beacon congestion control algorithms that control the beacon load below a certain threshold by adjusting the transmit rate and/or transmit power for the beacon messages. We perform a large set of simulations to evaluate these algorithms. Our simulation results reveal promising results for these algorithms.
I. INTRODUCTION
In recent years, Intelligent Transportation Systems (ITS) where information and communication technologies (ICT) are integrated into vehicles and road infrastructure have garnered great attention from both academia and industry. This is because ITS holds the potential to enhance road safety, to reduce road accidents, and to improve traffic efficiency. Au-tomotive companies and governments in many countries are now contemplating a large-scale deployment of ITS in the near future. Among other factors, the outcome of this deployment will hinge on the performance of vehicular communication that can support many different future ITS applications.
A prominent ITS safety application using vehicular commu-nication is cooperative awareness where vehicles exchange information about their present location to achieve collision avoidance. Further, vehicles can use vehicular communication to provide drivers with a better perception of their surrounding and warn them about danger or potential accidents. Road-side sensor systems detecting road conditions, obstacles, or pedestrians can use vehicular communication to transmit their sensor data to the vehicles and help drivers to drive better. Traffic light systems can also use vehicular communication to transmit their timing and signal phase to vehicles approaching an intersection. These vehicles can use this information to warn drivers about potential red light violation or adapt their speed for optimal fuel consumption. Given its great benefits, academia and automotive industry have been actively working on vehicular communication in recent years.
Vehicular communication is premised on the concept that vehicles and road infrastructure form a vehicular ad hoc
network (VANET) in a spontaneous manner to exchange information with each other over the wireless medium. Among different wireless communication technologies considered for VANET, IEEE 802.11 (WLAN) appears attractive because it is mature, inexpensive, and widely available. Since WLAN’s communication range is typically limited to a few hundred meters, a source vehicle usually relies on other vehicles to relay its message destined for recipients outside of its direct communication range.
For multi-hop communication, VANET has two salient requirements for which classical ad hoc routing protocols (DSR, AODV, DSDV, and OLSR) are ill-suited. First, a message is usually destined for all vehicles within a certain geographic range (e.g., a warning message to all vehicles within 500 m from an accident or red light information for all vehicles approaching an intersection). Since classical ad hoc routing protocols do not incorporate any geographic in-formation into their routing decision, they are inapt to address this requirement. Second, the highly dynamic environment of VANET demands that a routing protocol must work efficiently with frequent topological changes. The overhead of route advertisements of proactive ad hoc routing protocols would be too high for VANET. On the other hand, the route discovery’s delay in reactive ad hoc routing protocols would be too long for VANET safety applications. To address these VANET’s requirements, geographic routing is adopted for multi-hop communication. This approach foresees that each message carries the source node’s geographic position and a geographic destination in its header. The latter information defines an area for which the message is relevant.
Many ITS applications build on two primary VANET mes-sages: beacon and event-driven warning. Beacon messages are periodically sent by each vehicle to inform other vehicles about its presence and its status (beacons are also called “Here I Am” messages). Processing these messages, each vehicle is aware of other vehicles in its vicinity and warns the driver if a potential collision is detected. Since a vehicle’s beacon messages are most useful to other vehicles in its immediate surrounding, these messages are not forwarded. Event-driven warning messages are transmitted to a geographic area when a vehicle or the road infrastructure detects a critical situation (e.g., an accident occurs). These messages are of high impor-tance and typically propagate over multiple hops.
Since beacon and event-driven warning messages are funda-mental building blocks for many ITS applications, it is
tant to understand their delivery rate in different deployment scenarios. In particular, it is crucial to investigate congestion control algorithms that can handle dense deployment scenar-ios. These are situations where vehicles generate a high load on the wireless channel and cause adverse impacts on the delivery rate of these messages. Since event-driven messages carry time-critical information of high importance and are transmitted when a critical situation is detected, they have higher priority than beacon messages. Thus, it is meaningful to reduce the beacon load to retain a certain amount of the available bandwidth for the event-driven warning messages. We investigate three beacon congestion control algorithms that govern the beacon load at a given threshold by regulating the transmit rate and/or the transmit power for the beacon messages. We conduct an extensive set of simulation to evaluate these algorithms. Our simulations unveil good results for these algorithms. The rest of our paper is organized as follows. We review related work in Section II and present the beacon congestion control algorithms in Section III. Section IV report our simulation results. Section V concludes our paper.
II. RELATEDWORK
Congestion is a common problem in data networks and arises when data packets are injected into a network at a higher rate than the network capacity over a sustained period of time. Early work on congestion control for wired data networks dates back to the 1980s [7]. In wireless networks, congestion control is an important topic due to the broadcast nature of the wireless medium and has been investigated extensively [1], [2], [4], [9]. For VANETs, congestion control is even more challenging because of the distributed nature, the highly dynamic environment, and frequent changes in the network topology. For this reason, the vast amount of work on congestion control for stationary wireless networks is not applicable for VANETs.
Recent work on congestion control in VANETs has ad-dressed two challenges: congestion control for beacon and event-driven warning messages. Congestion control for warn-ing messages [10], [12] reduces the channel load in multi-hop communication by employing distributed algorithms to determine forwarding nodes and mitigates the broadcast storm. Beacon congestion control applies one of the following two approaches to retain the beacon load: controlling the beacon rate [6] or controlling the beacon transmit power [3], [11].
Caizzone et al. present an algorithm [3] for adjusting the transmit power as a function of the estimated neighbors. Each node monitors the wireless channel and counts the number of neighbors that it recently receives data from. If this number is below a threshold, a node increases its transmit power. If this number is higher than a threshold, the nodes decrease their transmit power.
Torrent-Moreno et al. propose an algorithm [11] for con-trolling the beacon load below a given threshold by adjusting the nodes’ transmit power for beacons. Each node acquires the status of all nodes within the carrier-sense range (CS range). Each node then uses this knowledge to determine the
TxPwr
Packet Rate
Density
P[3]
P[1] P[5]
RMAX[5]
P[4]
P[2]
Increasing Decreasing
RMAX[4] RMAX[3] RMAX[2] RMAX[1]
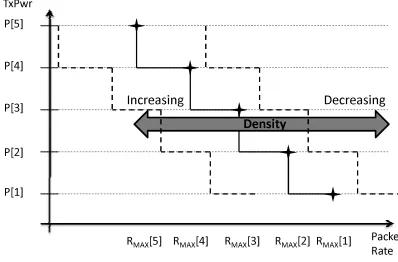
Fig. 1. Rate-power relation in power+rate control.
maximum common transmit power such that their aggregated beacon load is below a specified threshold. This information is then broadcast and propagated to other nodes in the CS range. All nodes collect their neighbors’ transmit power and collectively choose the minimum value to ensure fairness.
Drigo et al. devise an algorithm [6] for maintaining the bea-con load under a given threshold by dynamically adapting the nodes’ beacon rate. Each node monitors the aggregated beacon load by monitoring the wireless channel and by estimating the number of neighbors from the received beacons. Each node locally adjusts its beacon rate such that the aggregated beacon load is kept below the given threshold.
Khorakhun et al. present two congestion control algo-rithms [8] that adapt either the beacon transmit power or the beacon rate. The algorithms first calculate the channel busy time as a fraction of an interval where the wireless channel is perceived as busy. If the channel busy time is below a given threshold, the transmit power or the beacon rate is increased. If the channel busy time exceeds the threshold, the transmit power or the beacon rate is decreased.
III. ALGORITHMDESCRIPTION
We consider three beacon congestion control algorithms in this paper: rate control, power control, and joint power+rate control. Each of these algorithms incorporates the following three aspects. First, they observe the channel conditions during the monitoring interval T. Second, they derive the estimated channel load from the observed channel conditions. Third, they adjust the transmit power and/or the beacon rate to be used in the next monitoring interval.
TxPwr
Packet Rate P[3]
P[1] P[5]
P[4]
P[2]
r1 r2r3 rMAX
Rate used by neighbors
Fig. 2. Beacon rate selection in power+rate control.
beacon load below a given thresholdCBTT hand reserves the remaining bandwidth for the event-driven warning messages.
A. Rate Control (RC)
The rate control algorithm (RC) assumes that all nodes use the same beacon transmit power and regulates the nodes’ beacon rate such that the aggregated beacon load remains below a given value CBTT h. RC provides fairness among all nodes and allocates the same amount of bandwidth to all nodes within a neighborhood. The beacon rate for an arbitrary node iis determined as follows.
Ri(t) = NCBTT h i(t) + 1·
C
PSIZE (1)
whereNi(t)is the number of nodes that have nodeiin their carrier-sense range (CS range), C is the channel bandwidth, andPSIZE is the beacon message size. RC infersNi(t)from CBTP ER,i(t), the aggregated beacon load measured at node
i during the tthmonitoring interval.
Ni(t) =CBTRP ER,i(t) AV G ·
C
PSIZE −1 (2)
where RAV G is the average outgoing data packet rate, computed among nodei’s neighbors. The beacon rate for node i is derived from equations (1) and (2).
Ri(t) = CBTCBTT h
P ER,i(t−1)·RAV G(t−1) (3) B. Power Control (PC)
The power control algorithm (PC) assumes that all nodes use a constant beacon rate Rand seeks to control the beacon transmit power such that the aggregated beacon load is lower than CBTT h. To achieve this goal, PC needs to consider all nodes whose transmission raises the received signal’s strength at a local node above the CCA threshold, i.e., all nodes within the local node’s CS range. We note that some of these nodes are sufficiently far away so that their transmitted packets are not decoded correctly by the local node, i.e., these nodes are outside the local node’s communication range (CR).
It is practically impossible to control a node’s CS range directly because this depends on various unknown factors
such as the propagation environment, the background noise, and interference from other nodes. For practical purposes, we assume that the ratio between CRandCS range is constant.
Δ = CRCS const (4)
We note that off-the-shelf wireless NICs usually have a limited number of transmit power levels (typically 5 to 10) that can be chosen for packet transmissions. Each of these transmit power levels roughly corresponds to a certain communication range (CR) where transmitted packets can be received with a high probability. Thus, PC’s goal is translated into selecting the transmit power levels corresponding to the pre-defined CRs for beacon transmission such that the estimated nodeswithin a local node’s CS range is at mostNMAX.
NMAX = CBTRT h ·P C
SIZE −1 (5)
To determine the CS range including NMAX neighbors, each node continuously monitors the wireless channel and estimates the node densityDi in its vicinity.
CSMAX,iNMAX2·D+ 1
i (6)
This CS range is used to approximate the maximum CRMAX,i at a local node i.
CRMAX,i CSMAX,iΔ 2·CBTD T h i·Δ·R·
C
PSIZE (7)
Finally, each nodeiselects its beacon transmit power level such that the corresponding CR is lower than CRMAX,i.
pi(t) = maxp [CR[p]< CRMAX,i] , p∈ {PMIN, ..., PMAX}
(8)
C. Joint Power+Rate Control (PRC)
The joint power+rate control algorithm (PRC) regulates the aggregated beacon load by adjusting both the transmit power and the beacon rate at each node. The algorithm consists of two steps. The first step estimates the vehicle density D of each node. This estimation is used to determine the maximum beacon rate RMAX[p] for each transmit power level p such that the aggregated beacon load is below a given threshold CBTT h. This estimation is premised on the assumption that
every node in the resulting communication range CR[p] uses the corresponding beacon rate. The relation between transmit power and beacon rate can be obtained from equation (7).
RMAX[p] = 2·CRCBT[p]T h·D·Δ ·P C
SIZE (9)
TABLE I SIMULATION PARAMETERS
Description Value
Communication technology IEEE 802.11 Medium access control CSMA/CA Frequency band 5.9 GHz Channel width 10 MHz Propagation model Nakagami Data rate 3 Mbps Data frame type Broadcast Communication range 500 m Number of transmit power levels 5 Beacon rate 10 Hz Beacon size 500 bytes
CBTT h 0.2
Warning message rate 1 Hz Warning message size 500 bytes
into account the node density D, the curve moves according to the node density (the dashed curves in Figure 1). If the node density increases, the rate-power relation becomes more restrictive, i.e. the same beacon rate corresponds to a lower transmit power level. If the density decreases, nodes can utilize a higher transmit power level at the same beacon rate.
In the second step, each node collects information about its neighbors’ beacon rate and determines the maximum beacon raterMAX. This beacon rate represents the entire set of power and rate values that a node can use such that the aggregated beacon load is below the given threshold CBTT h (the dark area depicted below the power-rate curve in Figure 2).
IV. SIMULATION
We study the performance of the three beacon congestion control algorithms by conducting ns-2 simulations for various intersection scenarios and at different levels of vehicle density. For comparison purpose, we also repeat the same simulations but apply no congestion control to obtain the baseline results. For each scenario, we perform 10 simulations, each running for 200 seconds. Simulation results are averaged to obtain a representative outcome for each intersection scenario. We use the reception rate of beacon and event-driven warning messages as the performance measure for the vehicular com-munication. These reception rates are reported as a function of the distance between the sender and the receiver. We also present the CBT ratio that measures the effectiveness of the algorithms in mitigating congestion on the wireless channel.
A. Simulation Setup
The wireless communication technology used in our simu-lations is IEEE 802.11p operating in the 5.9-GHz frequency band. We rely on the IEEE 802.11 PHY and MAC extensions to obtain a realistic model for vehicular communication [5]. The IEEE 802.11 PHY extension implements a Nakagami model to achieve realistic packet error rates as a function of distance according to actual measurements.
Intersections in our simulations are modeled as a crossing of two streets, each has multiple vehicles moving in both
TABLE II
INTERSECTION PARAMETERS.
Description Value
Lanes per approach 1 (small intersection) 2 (midsize intersection) 3 (large intersection) Approach length 1 km
Number of vehicles 20 (low vehicle density) per lane 40 (high vehicle density) Mean inter-vehicle 100 m (low vehicle density) distance 50 m (high vehicle density) Average speed 50 km/h
Traffic light phase 60 seconds
directions. Each vehicle is modeled in our simulations as an independent entity following a movement pattern specified by our intersection model. At any point in time, only vehicles in certain lanes move while other have to stop for the red light. Our intersection model uses a traffic light cycle to regulate the amount of time vehicles stop at the intersection. To generate realistic traffic patterns, the model decides randomly whether a vehicle stays in its lane or switches to a new lane when crossing the intersection. The number of vehicles are kept constant in each simulation. To realize this goal, our model compensates a vehicle leaving the intersection by another vehicle entering the intersection. Table II summarizes the parameters of our intersection model.
Each vehicle in our simulation environment emits periodic beacon messages at a constant rate. Beacons are not forwarded. In addition, a roadside unit (RSU) installed at the intersection center broadcasts an event-driven warning message at a rate of 1 Hz. The warning message is rebroadcast by each vehicle once and is forwarded successively in a multi-hop fashion until it reaches its destination range of 1000 m.
B. Results
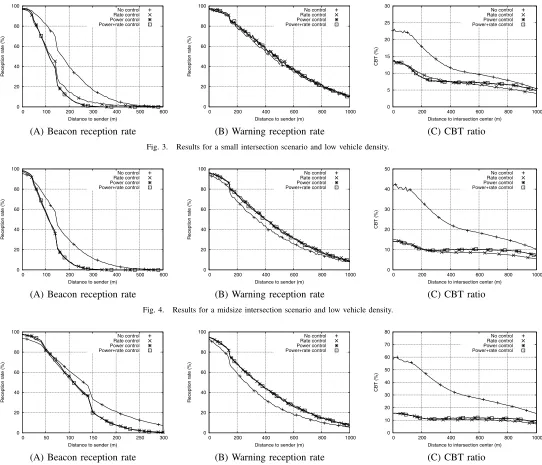
Figures 3, 4, and 5 present our simulation results for various intersection scenarios with low vehicle density. As the distance between the sender and the receiver increases, the reception rates for both beacon and warning messages decrease. Our three control algorithms achieve comparable performance in all scenarios. When no congestion control is applied, the CBT ratio rises drastically with the intersection size. On the other hand, the CBT ratio is kept below the given thresholdCBTT h by the control algorithms. In all scenarios, our algorithms ob-tain a higher reception rate for event-driven warning messages than when no congestion control is exercised. While this gain is achieved at the expense of a lower reception rate for beacon messages, we note that this is the goal of the control algorithms (prioritizing event-driven warning over beacon messages).
0 20 40 60 80 100
0 100 200 300 400 500 600
Reception rate (%)
Distance to sender (m) No control Rate control Power control Power+rate control
0 20 40 60 80 100
0 200 400 600 800 1000
Reception rate (%)
Distance to sender (m) No control Rate control Power control Power+rate control
0 5 10 15 20 25 30
0 200 400 600 800 1000
CBT (%)
Distance to intersection center (m) No control Rate control Power control Power+rate control
(A) Beacon reception rate (B) Warning reception rate (C) CBT ratio
Fig. 3. Results for a small intersection scenario and low vehicle density.
0 20 40 60 80 100
0 100 200 300 400 500 600
Reception rate (%)
Distance to sender (m) No control Rate control Power control Power+rate control
0 20 40 60 80 100
0 200 400 600 800 1000
Reception rate (%)
Distance to sender (m) No control Rate control Power control Power+rate control
0 10 20 30 40 50
0 200 400 600 800 1000
CBT (%)
Distance to intersection center (m) No control Rate control Power control Power+rate control
(A) Beacon reception rate (B) Warning reception rate (C) CBT ratio
Fig. 4. Results for a midsize intersection scenario and low vehicle density.
0 20 40 60 80 100
0 50 100 150 200 250 300
Reception rate (%)
Distance to sender (m) No control Rate control Power control Power+rate control
0 20 40 60 80 100
0 200 400 600 800 1000
Reception rate (%)
Distance to sender (m) No control Rate control Power control Power+rate control
0 10 20 30 40 50 60 70 80
0 200 400 600 800 1000
CBT (%)
Distance to intersection center (m) No control Rate control Power control Power+rate control
(A) Beacon reception rate (B) Warning reception rate (C) CBT ratio
Fig. 5. Results for a large intersection scenario and low vehicle density.
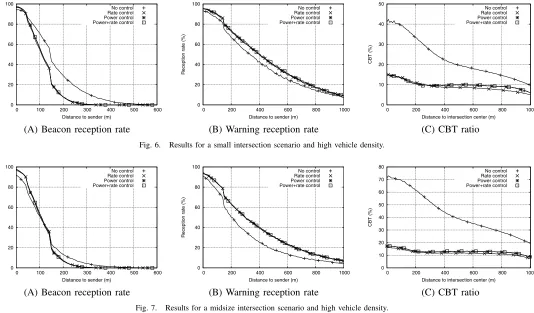
grows, their advantage over no congestion control becomes more pronounced. We note that when no congestion control is applied for the large intersection, the reception rates of both beacon and warning messages are lower than those obtained with the congestion control algorithms. In this scenario, the wireless medium becomes saturated when no congestion con-trol is executed (as indicated by the CBT ratio).
V. SUMMARY
Beacon and event-driven warning messages are two essen-tial messages used by VANET applications. When the wireless medium for VANET is congested, the beacon load has to be retained at a certain threshold to reserve the remaining bandwidth for the event-driven messages. This paper discusses
0 20 40 60 80 100
0 100 200 300 400 500 600
Reception rate (%)
Distance to sender (m) No control Rate control Power control Power+rate control
0 20 40 60 80 100
0 200 400 600 800 1000
Reception rate (%)
Distance to sender (m) No control Rate control Power control Power+rate control
0 10 20 30 40 50
0 200 400 600 800 1000
CBT (%)
Distance to intersection center (m) No control Rate control Power control Power+rate control
(A) Beacon reception rate (B) Warning reception rate (C) CBT ratio
Fig. 6. Results for a small intersection scenario and high vehicle density.
0 20 40 60 80 100
0 100 200 300 400 500 600
Reception rate (%)
Distance to sender (m) No control Rate control Power control Power+rate control
0 20 40 60 80 100
0 200 400 600 800 1000
Reception rate (%)
Distance to sender (m) No control Rate control Power control Power+rate control
0 10 20 30 40 50 60 70 80
0 200 400 600 800 1000
CBT (%)
Distance to intersection center (m) No control Rate control Power control Power+rate control
(A) Beacon reception rate (B) Warning reception rate (C) CBT ratio
Fig. 7. Results for a midsize intersection scenario and high vehicle density.
0 20 40 60 80 100
0 50 100 150 200 250 300
Reception rate (%)
Distance to sender (m) No control Rate control Power control Power+rate control
0 20 40 60 80 100
0 200 400 600 800 1000
Reception rate (%)
Distance to sender (m) No control Rate control Power control Power+rate control
0 20 40 60 80 100
0 200 400 600 800 1000
CBT (%)
Distance to intersection center (m) No control Rate control Power control Power+rate control
(A) Beacon reception rate (B) Warning reception rate (C) CBT ratio
Fig. 8. Results for a large intersection scenario and high vehicle density.
REFERENCES
[1] M. Barry, A. Campbell, and A. Veres. Distributed control algorithms for service differentiation in wireless packet networks. InInfocom 2001, April 2001.
[2] V. Bharghavan, A. Demers, S. Shenker, and L. Zhang. MACAW: A media access protocol for wireless LANs. InACM SIGCOMM 1994, September 1994.
[3] G. Caizzone, P. Giacomazzi, L. Musumeci, and G. Verticale. A power control algorithm with high channel availability for vehicular ad-hoc networks. InIEEE ICC 2005, May 2005.
[4] C. Chen, E. Seo, H. Kim, and H. Luo. Self-learning collision avoidance for wireless networks. InIEEE INFOCOM 2006, April 2006. [5] Q. Chen, F. Schmidt-Eisenlohr, D. Jiang, M. Torrent-Moreno, L.
Del-grossi, and H. Hartenstein. Overhaul of IEEE 802.11 Modeling and Simulation in ns-2. InACM MSWiM’07, October 2007.
[6] M. Drigo, W. Zhang, R. Baldessari, L. Le, A. Festag, and M. Zorzi. Distributed rate control algorithm for VANETs (DRCV). In ACM VANET 2009, September 2009.
[7] V. Jacobson and M. Karels. Congestion avoidance and control. InACM SIGCOMM 1988, August 1988.
[8] C. Khorakhun, H. Busche, and H. Rohling. Congestion control for VANETs based on power or rate adaptation. InWIT 2008, March 2008. [9] J. Monks, V. Bharghavan, and W. Hwu. A power controlled multiple access protocol for wireless packet networks. InIEEE INFOCOM 2001, April 2001.
[10] M. Torrent-Moreno. Inter-vehicle communications: Assessing informa-tion disseminainforma-tion under safety constraints. InConference on Wireless on Demand Network Systems and Services (WONS’07), January 2007. [11] M. Torrent-Moreno, P. Santi, and H. Hartenstein. Distributed fair
transmit power adjustment for vehicular ad hoc networks. In IEEE SECON 2006, September 2006.