Pharmacophore 2011, Vol. 2 (3), 131-148
ISSN 2229 – 5402
Pharmacophore
(An International Research Journal)
Available online at http://www.pharmacophorejournal.com/
Original Research Paper
FORMULATION, CHARACTERIZATION, STABILITY
AND INVITRO EVALUATION OF NIMESULIDE NIOSOMES
Chawda Himmat Singh
1*,
Jain C P
2,
Bairwa Narendra Kumar
21
*
Department Pharmaceutical Sciences
Gyan Vihar School of Pharmacy,
Suresh Gyan Vihar University,
Jaipur, Rajasthan, India-302025
2Department Pharmaceutical Sciences
Mohan Lal Sukhadia University,
Udaipur, Rajasthan, India
ABSTRACT
Niosomes or non-ionic surfactants vesicles are microscopic lamellar structures formed on the admixture of a non-ionic surfactant, cholesterol and phosphate with subsequent hydration in aqueous media. The delivery of drugs by “vesicular drug delivery system” such as niosomes provides several important advantages over conventional drug therapy.
The main objective of this study was to design suitable niosome-encapsulated drug delivery for anti- inflammatory drugs like nimesulide and evaluate the vesicle size, encapsulation efficiency, in vitro release and physical stability of the system. Non-ionic surfactants used were span 20, 40, 60 and cholesterol was used in different molar ratios. The niosomes prepared by lipid film hydration method were multilamellar vesicles (MLVS) and niosomes prepared by ether injection technique were unilamellar
vesicles (ULVS) or oligolamellar vesicles. The higher entrapment efficiency was observed with MLVS
prepared from span 60 and cholesterol in an 80:70 molar ratio. The in vitro diffusion study suggests that higher entrapment efficiency was related with slow release comparatively. The release pattern shown by these formulations were zero order & Higuchi diffusion controlled mechanism. The physical stability study show that niosomal preparation stored at refrigerated temperature for 60 days show maximum drug retained for all the formulation compare to room temperature and elevated temperature conditions. Finding of all this investigation conclusively demonstrate prolongation of drug release at a constant and controlled rate after niosomal encapsulation of nimesulide.
Keywords: Formulation, Stability, Niosome, Cholesterol, Nimesulide, Span.
Chawda Himmat Singh et al. / Pharmacophore 2011, Vol. 2 (3), 168-185 therapeutically effective and nontoxic for an
extended period. The design of proper dosage regimen is an important element in accomplishing this goal.1 Novel drug delivery systems aim to delivery the drug at a rate directed by the needs of the body during the period of treatment and channel the active entity to the site of action.2 Targeted drug delivery implies for selective and effective localization of pharmacologically active moiety at preidentified (preselected) targeted (s) in therapeutic concentration while restricting its access to nontarget normal cellular linings thus minimizing toxic effects and maximizing therapeutic index. Targeted drug delivery is an event where a drug carrier complex/conjugate delivers drug (s) exclusively to the preselected targeted cells in a specific manner.3 To pursue optical drug action, functional molecules could be transported by a carrier to the site of action and released to perform their task.4
The targeting methods may be classified as chemical methods, co-valent bonding and physical methods. Chemical methods involve chemical modification of the parent compound to a derivative, which is activated only at the target site. Various physical methods make use of the carriers such as liposomes, niosomes, resealed erythrocytes, nano-particles, platelets, magnetic microspheres, and monoclonal antibodies. Recently niosomal drug delivery system (A particulate colloidal carrier system) is drawing attention due to its significant advantages over conventional drug delivery system. It is reported that niosomes are non-ionic surfactant vesicles inclosing an aqueous phase and a wide range of molecules could be encapsulated within aqueous spaces of lipid membrane vesicles. Niosomes or non-ionic surfactants vesicles are microscopic lamellar structures formed on the admixture of a non- ionic surfactant, cholesterol and phosphate with subsequent hydration in aqueous media.5
The present study was aimed at formulating niosomes of nimesulide (a NSAID), optimizing the formulation, characterizing them and assessing in vitro performance of the system.
MATERIALS AND METHODS
Materials
Nimesulide was obtained as a gift sample from alembic chemicals works, Baroda, India. Spans (20, 40, and 60) were procured from central drug house (p) ltd., Mumbai. Cholesterol, chloroform and methanol were procured from S.D. Fine chemicals ltd., Mumbai. Cellulose membrane was obtained from Axiva Sihem Pvt. Ltd., Delhi. Solvents and other reagents were of analytical grade. All the Ingredients were used without further purification. Phosphate Butter saline (PBS) pH 7.4 was prepared as described in the I.P. 1996.6
Methods
Analysis of Nimesulide Drug
Solubility study
The Solubility of Nimesulide was determined in different solvents. An excess quantity of the drug was added in 10ml of each solvent in screw capped glass test tubes and shaken for 12 hrs. at room temperature. The solution was filtered, diluted and the solubility was determined spectrophotometrically.7
Calibration curve of Nimesulide
The calibration curve of nimesulide was prepared in phosphate butter pH 7.4. For this 250ml of 0.2 N potassium dihydrogen phosphate and 195.5 ml of 0.2 N sodium hydroxide was taken and placed in 1000 ml volumetric flask and then distilled water was added to make up the volume.6
Chawda Himmat Singh et al. / Pharmacophore 2011, Vol. 2 (3), 168-185 Then 100 mg of nimesulide was weighted
accurately and dissolved in 10ml of methanol (10% v/v) and 90 ml of phosphate buffer pH 7.4 (PBS). Volume was make up 100 ml by PBS. Then 1 ml of this solution was diluted to 10 ml by 10% methanolic buffer pH 7.4 to produce 100 μg/ml stock solution.
From this stock solution, aliquots of 2.5 ml, 5
Deamer and Bangham in 1976. For each ratio non ionic surfactant span (20, 40, and 60) and cholesterol were weighed accurately and dissolved in 10 ml of ether. This solution was taken into a syringe and a slow injection of surfactant: cholesterol solution in ether through a 14 gauge needle at rate approximately 0.25 ml / minute into a preheated 5 ml aq. phase (Drugs in
0
ml, 7.5 ml, 10 ml, 12.5 ml, 15 ml, 20 ml, 25 ml PBS) maintained at 60 C was injected and and 30 ml were taken and diluted suitably by
10% v/v methanolic solution of phosphate buffer pH 7.4. The calibration curve was plotted b/w concentration and absorbance.
Preparation of Nimesulide Niosomes
Niosomes were prepared by using (I) lipid film hydration method and (II) ether injection method. Drug, nonionic surfactants and cholesterol were taken in different molar ratios as indicated in table (1).
(1) Preparation of nimesulide niosomes by lipid film hydration method: (LfH Method)
Different niosomal formulations were prepared by lipid film hydration technique reported by Azmin et al. accurately weighted quantities of surfactant (either span 20,40 or 60) and cholesterol in different molar ratios, viz 75:75, 90:60, 80:70, 70:80, were dissolved in 9ml of a chloroform / methanol mixture (2:1, v/v) in a round bottom flask. The solvent mixture was evaporated in a rotary flash evaporator under a vacuum of 20 inches of Hg at a temperature of 25 ± 2 0C and the flask rotated at 100 rpm until a smooth, dry lipid film was obtained. The film was hydrated with 5 ml of PBS 7.4 containing 10 mg nimesulide drug for 45 minute at 60 0C with gentle shaking on a water bath. The niosomal suspension was further hydrated at 2-8 0C for 24 h.8
(II)Preparation of nimesulide niosomes by ether injection technique (method): (EI Method)
Different Niosomal formulations were prepared by the ether injection technique introduced by
agitated simultaneously. As the lipid solution was injected slowly into the aq. phase, vaporization of ether leads to the formation of niosomes. The formulation technique was optimized for hydration time and hydration medium volume so as to get max drug entrapment.9
Characterization of Nimesulide Niosomes
Photo microscopy
Vesicle dispersions were characterized by photo microscopy for vesicle formation and morphology. Samples of Niosomal formulations were examined under optical microscope by means of fitted camera and photographed at magnification of 40 to 100 X.
Determination of vesicle size & shape
This is performed for characterization of vesicle’s size and shape. Vesicle size of niosomes were determined by using optical microscopy method using calibrated optical microscope (By Ocular and Stage micrometer)
Determination of nimesulide entrapment efficiency
Chawda Himmat Singh et al. / Pharmacophore 2011, Vol. 2 (3), 168-185 in entrapment efficiency (percent total drug
entrapped in vesicles).4,10
In vitro release of nimesulide from niosomes
The release of nimesulide from niosomes was determined using the membrane diffusion technique, 1 ml of niosomal suspension was placed in a diffusion cell (glass tube) of diameter 2.5 cm, the lower open end of the glass tube was covered with soaked cellulose membrane. This cell then suspended in the beaker containing PBS pH 7.4 (100 ml). This was constantly stirred at speed 50 rpm at 37 ±1 0C on a magnetic stirrer with a thermostat. Aliquots were withdrawn at hourly intervals and replaced simultaneously with equal volume of fresh PBS. The nimesulide concentration in the samples was analyzed spectrophotometrically, as mentioned earlier. The obtained data were analyzed to determine the amount and mechanism of drug release.
Effect of variables
The effect of variables on the size distribution, entrapment efficiency and in vitro release rate were investigated. The variables studied were: method of preparation and type of surfactant viz, span 20, span 40 and span 60. The ratio of lipids, conc. of lipid, time of hydration, temp of hydration and volume of aq. phase were kept constant unless otherwise indicated. The effect of lipid composition and total lipid conc. was studied on the formulation.
Physical Stability of Nimesulide Niosomes
Physical stability of the prepared nimesulide niosomes were carried out to investigate the leaching of down from niosomes (in a liquid form) during storage. The samples of niosomal formulations were sealed in a glass vial and stored at refrigeration temperature (40 C), room temperature and elevated temperature for a period of 2 months. Samples from each batch were withdrawn at definite time intervals, the residual amount of the drug in the vesicles was determined as described previously after separation from unentrapped drug.
RESULTS AND DISCUSSION
Analytical Profile of Nimesulide
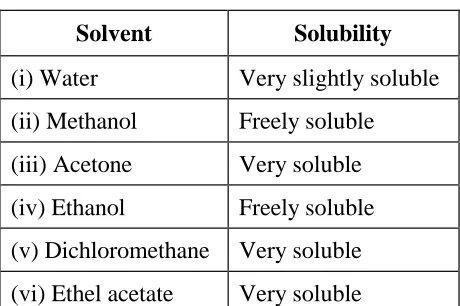
Solubility profile
Solubility of nimesulide was determined in different solvents and the observation are shown in Table (2)
Calibration curve of nimesulide
The calibration curve of nimesulide was prepared in 10% methanolic solution of phosphate buffer pH 7.4 at 396 nm and the absorbance values of different concentrations of nimesulide solutions in phosphate buffer methanolic solution (pH 7.4) are shown in table (3) and graphically represented in figure (1). The Beer’s law was found to obey in the range of 10- 30 μg/ml.
Characterization of Nimesulide Niosomes
Photo microscopy
The photomicrograph of nimesulide niosomes prepared by lipid film hydration and ether injection method are shown in figure (2). The reveal that the niosomes were spherical in shape and exist in disperse and aggregate collections.
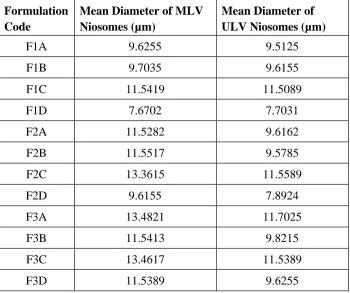
Determination of vesicle size
Chawda Himmat Singh et al. / Pharmacophore 2011, Vol. 2 (3), 168-185 the HLB value because surface free energy
decreases on increasing hydrophobicity of surfactant.11
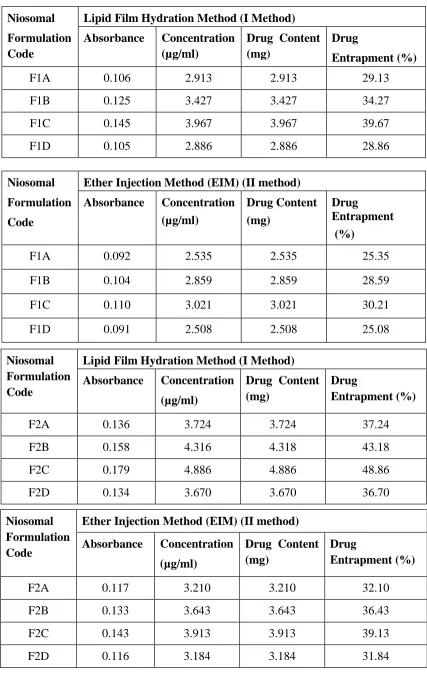
Entrapment efficiency of nimesulide niosomes
To obtain the highest encapsulation efficiency, several factors, including the inclusion of cholesterol, the structure of the surfactant and the method of preparation, were investigated and optimized.
Effect of cholesterol content
These results can be explained by the fact that an increase in cholesterol content resulted in an increase of micro viscosity of the membrane indicating more rigidity of the bilayers. Cholesterol has the ability to cement the leaking space in the bilayer membranes. It is obvious from table (5) that further increase of cholesterol content, reaching a highest 70:80 molar ratio of surfactant: cholesterol for niosomes composed of span 20, 40, and 60 was found to here reduce entrapment efficiency. Thus cholesterol reduced the entrapment efficiency for both I & II method prepared niosomes.
This reduction in entrapment efficiency could be attributed to the fact that cholesterol beyond a certain level starts disrupting the regular bilayered structure leading to loss of drug entrapment.
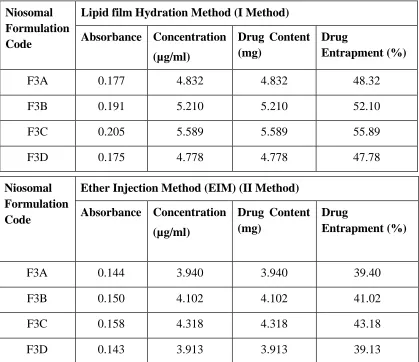
Effect of the surfactant
Data in table (5) reveals that the entrapment efficiencies for niosomes prepared using span 60 were superior to those prepared using span 20 and 40. This can be explained by many facts: (a) the hydration temperature used to make niosomes should usually be above the gel to liquid phase transition temperature of the system that results in niosomes that are less leaky and have high entrapment efficiency. Span 60 has highest phase transition temperature (50 0C) as compared to Span 40 and 20 and hence high entrapment efficiency. (b) The length of alkyl chain of surfactant has a prominent effect on
permeability of prepared niosomes as length of surfactant increases entrapment efficiency also increases and as length decreases entrapment efficiency also decreases. Hence long chain surfactant results in high entrapment. Thus span 60 has a longer saturated alkyl chain (C16)
compared to span 40(C14) and span 20 (C10), so
it produces niosomes with higher entrapment efficiency. (c) The longer alkyl chain influences the HLB value of the surfactant mixture which in turn directly influences the drug entrapment efficiency. The lower the HLB of the surfactant the higher will be the drug entrapment efficiency and stability as in the case of niosomes prepared using span 60.
Effect of the method of preparation & nature of drug
By further inspection of table (5); it was observed that entrapment efficiency of nimesulide entrapped in multilamellar niosomes prepared by lipid film hydration method were higher than those in niosomes prepared by the ether injection method. This may be attributed to the fact that nimesulide is lipophilic in nature and very slightly soluble in water, where the solubility of nimesulide in water is reported to be 1.1 mg/ml and its partition coefficient, log P value is 2.376, so MLVs are more capable of loading a higher mass of a hydrophobic drug than are ULVs. It is also reported that the tendency of a drug to interact by various forces, such as polar and non-polar forces and/or electrostatic interactions with the bilayer, determines whether it would be incorporated into the aq. compartments or into the bilayer structures or whether it would be firmly associated with the polar head groups of the bilayers via electrostatic interactions.12
Nimesulide associate with the bilayer hence will be entrapped in this region and show maximum entrapment with span 60 niosomes.
Chawda Himmat Singh et al. / Pharmacophore 2011, Vol. 2 (3), 168-185 Results of invitro study on the release of
nimesulide from MLVs & ULVs niosomal vesicles prepared using span 20,40 & span 60 and cholesterol in molar ratios 75:75, 90:60, 80:70, 70:80, are shown in figure (4)
From the results it is obvious that as the molar conc. of cholesterol increased from 90:60 to 70:80, causes marked reduction in the efflux of the drug, which was in accordance with its membrane stabilizing ability. Cholesterol is known to abolish the gel to liquid phase transition of niosomal systems, resulting in niosomes that are less leaky increasing the cholesterol beyond a certain level (80:70) starts disrupting the bilayered structure leading to loss of drug entrapment levels in this case.
By comparing the release data of nimesulide niosomes prepared by both the above mentioned methods, it is clear that the release was slower from multilamellar vesicles formed by lipid film hydration method. This may be attributed to the fact that multilamellar vesicles consist of several concentric spheres of lipid bilayers separated by aqueous compartments rather the one to three lipid bilayers of ether injection method formulated uni or oligolamellar vesicles.
Therefore the diffusion of nimesulide entrapped in the hydrophobic regions of the MLVs would be expected to occur over a prolonged period of time. By further inspection of the data it can conclude that niosomal formulation prepared using span 60 yield a lower rate of release compared to span 40 and span 20. This can be explained by the fact that niosomes exhibit an alkyl chain length dependent release. The higher the chain length, the lower the release rate of drug from formulations.
It is to be noted that the invitro release results are consistent with those of entrapment efficiency, as the multilamellar niosomes composed of span 60 and cholesterol (80:70) molar ratio with the highest entrapment efficiency (55.89% ) showed the lowest drug release percent after 8 hr (T8h=41.1%). This trend is also seen with
niosomes prepared by ether injection method. The comparative release data indicates that, by encapsulation of nimesulide drug into niosomes, it is possible to sustain and control the release of the drug for a longer duration.
Release Kinetics
We determined the proper order of release of drug from different formulations by analyzing linear regression study. Zero, first and Higuchi diffusion controlled model equations were applied to all in vitro release results. From the results we can conclude that the drug was released from niosome by a zero order diffusion controlled mechanism.
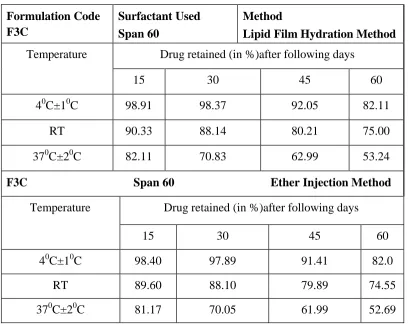
Physical Stability Study of Nimesulide Niosomes
Physical stability study of the prepared niosomes was carried out to investigate the leaching of drug from niosomes during storage at refrigerator condition, room temperature and elevated temperature. The percentage of nimesulide retained after a period of 15, 30, 45 & 60 days (2 months) in ULVs & MLVs niosomes composed of span 20, 40 and 60 with cholesterol in different molar ratios are shown in table (8). Also the results indicate that maximum percentage drug retained was observed at refrigerated conditions than room temperature and elevated temperature, after 2 months study. This may be due to the higher fluidity of lipid bilayers at higher temperature resulting into higher drug leakage. There was no significant difference in physical stability results between ether injection method & lipid film hydration method prepared niosomes stored at different temperature conditions.
CONCLUSION
Chawda Himmat Singh et al. / Pharmacophore 2011, Vol. 2 (3), 168-185 Finding of all this investigation conclusively
demonstrate prolongation of drug release at a constant and controlled rate, after encapsulation of nimesulide.
This study suggests that niosomal formulation can provide consistent and prolonged release of nimesulide from different niosomal formulations. It will lead to sustained action of the entrapped drug that reduce the side effects associated with frequent administration of the drug and potentiate the therapeutic effects of the drug.
It shows that niosomal drug delivery system may be a promising carrier for the novel drug delivery system.
ACKNOWLEDGEMENT
Authors are grateful to Alembic Chemical Works Ltd., Baroda, (India) for providing gift sample of nimesulide and to dept. of Pharmaceutical Sciences, M.L.S. University, Udaipur (Raj.) for providing the necessary lab facilities.
Table 1: Niosomes formulation composition
Formulation Code Surfactant Used Surfactant: Cho1esterol Ratio (μmol)
F1A Span 20 75:75
F1B Span 20 90:60
F1C Span 20 80:70
F1D Span 20 70:80
F2A Span 40 75:75
F2B Span 40 90:60
F2C Span 40 80:70
F2D Span 40 70:80
F3A Span 60 75:75
F3B Span 60 90:60
F3C Span 60 80:70
F3D Span 60 70:80
F1= Span 20, F2 = Span 40, F3 = Span 60,* Drug concentration used was 10 mg per batch
Table 2: Solubility profile
Solvent Solubility
(i) Water Very slightly soluble
(ii) Methanol Freely soluble
(iii) Acetone Very soluble
(iv) Ethanol Freely soluble
(v) Dichloromethane Very soluble
Chawda Himmat Singh et al. / Pharmacophore 2011, Vol. 2 (3), 168-185
Table 3: Calibration curve of nimesulide
Concentration Absorbance
0 0
2.5 0.09
5 0.189
7.5 0.271
10 0.369
12.5 0.461
15 0.551
20 0.732
25 0.911
30 1.120
Table 4: Mean particle diameters of different niosomal formulations
Formulation Code
Mean Diameter of MLV Niosomes (µm)
Mean Diameter of ULV Niosomes (µm)
F1A 9.6255 9.5125
F1B 9.7035 9.6155
F1C 11.5419 11.5089
F1D 7.6702 7.7031
F2A 11.5282 9.6162
F2B 11.5517 9.5785
F2C 13.3615 11.5589
F2D 9.6155 7.8924
F3A 13.4821 11.7025
F3B 11.5413 9.8215
F3C 13.4617 11.5389
Chawda Himmat Singh et al. / Pharmacophore 2011, Vol. 2 (3), 168-185
Table 5: Encapsulating efficiency of nimesulide niosomes
Niosomal
Formulation Code
Lipid Film Hydration Method (I Method)
Absorbance Concentration (µg/ml)
Drug Content (mg)
Drug
Entrapment (%)
F1A 0.106 2.913 2.913 29.13
F1B 0.125 3.427 3.427 34.27
F1C 0.145 3.967 3.967 39.67
F1D 0.105 2.886 2.886 28.86
Niosomal
Formulation
Code
Ether Injection Method (EIM) (II method)
Absorbance Concentration (µg/ml)
Drug Content (mg)
Drug
Entrapment
(%)
F1A 0.092 2.535 2.535 25.35
F1B 0.104 2.859 2.859 28.59
F1C 0.110 3.021 3.021 30.21
F1D 0.091 2.508 2.508 25.08
Niosomal Formulation Code
Lipid Film Hydration Method (I Method)
Absorbance Concentration
(µg/ml)
Drug Content (mg)
Drug
Entrapment (%)
F2A 0.136 3.724 3.724 37.24
F2B 0.158 4.316 4.318 43.18
F2C 0.179 4.886 4.886 48.86
F2D 0.134 3.670 3.670 36.70
Niosomal Formulation Code
Ether Injection Method (EIM) (II method)
Absorbance Concentration
(µg/ml)
Drug Content (mg)
Drug
Entrapment (%)
F2A 0.117 3.210 3.210 32.10
F2B 0.133 3.643 3.643 36.43
F2C 0.143 3.913 3.913 39.13
Chawda Himmat Singh et al. / Pharmacophore 2011, Vol. 2 (3), 168-185
Niosomal Formulation Code
Lipid film Hydration Method (I Method)
Absorbance Concentration
(µg/ml)
Drug Content (mg)
Drug
Entrapment (%)
F3A 0.177 4.832 4.832 48.32
F3B 0.191 5.210 5.210 52.10
F3C 0.205 5.589 5.589 55.89
F3D 0.175 4.778 4.778 47.78
Niosomal Formulation Code
Ether Injection Method (EIM) (II Method)
Absorbance Concentration
(µg/ml)
Drug Content (mg)
Drug
Entrapment (%)
F3A 0.144 3.940 3.940 39.40
F3B 0.150 4.102 4.102 41.02
F3C 0.158 4.318 4.318 43.18
F3D 0.143 3.913 3.913 39.13
*Each value is average of three determinations
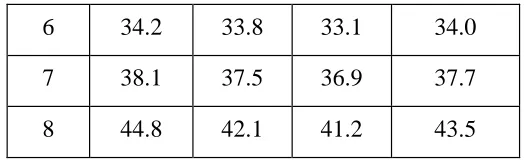
Table 6: In vitro release profile of Nimesulide niosomes
(The percentage drug release after 8 hr. from niosomal vesicles)
Time (Hrs.)
% Drug Released from MLV Niosomal Formulations F1 Formulations
F1A F1B F1C F1D
0 0 0 0 0
1 11.1 10.8 10.6 10.9
2 14.3 13.5 13.2 14.1
3 18.8 18.1 17.8 18.2
4 23.6 22.9 22.2 23.4
5 27.9 27.2 26.9 27.8
6 34.8 34.1 33.8 34.5
Chawda Himmat Singh et al. / Pharmacophore 2011, Vol. 2 (3), 168-185
8 46.5 44.4 42.6 45.7
Time (Hrs.)
% Drug Released from ULV Niosomal Formulations F1 Formulations
F1A F1B F1C F1D
0 0 0 0 0
1 11.2 10.9 10.7 11.1
2 15.1 14.8 14.5 14.9
3 19.2 18.9 18.3 18.8
4 24.3 24.1 23.8 24.2
5 28.6 28.2 27.7 28.3
6 35.9 35.3 34.9 35.2
7 41.8 41.1 40.7 41.1
8 48.1 46.4 44.4 47.6
Time (Hrs.)
% Drug Released from MLV Niosomal Formulations F2 Formulations
F2A F2B F2C F2D
0 0 0 0 0
1 10.5 10.2 10.1 10.4
2 13.7 13.1 12.8 13.5
3 18.1 17.5 17.3 18.0
4 23.0 22.7 22.4 22.8
5 27.2 26.8 26.4 27.1
6 34.1 33.6 33.1 33.9
7 39.5 38.9 38.7 39.3
8 45.2 43.5 42.2 44.8
Time (Hrs.)
% Drug Released from ULV Niosomal Formulations F2 Formulations
F2A F2B F2C F2D
Chawda Himmat Singh et al. / Pharmacophore 2011, Vol. 2 (3), 168-185
1 10.9 10.5 10.3 10.7
2 14.8 14.2 14.1 14.4
3 18.5 18.1 17.9 18.3
4 22.7 22.2 21.8 22.2
5 27.1 26.8 26.1 26.9
6 34.3 33.9 33.2 34.1
7 40.2 39.8 39.2 39.9
8 47.5 45.4 44.8 46.5
Time (Hrs.)
% Drug Released from MLV Niosomal Formulations F3 Formulations
F3A F3B F3C F3D
0 0 0 0 0
1 10.1 9.9 9.8 9.7
2 12.9 12.3 12.1 12.5
3 17.5 17.2 17.0 17.4
4 22.5 22.1 21.9 22.2
5 26.9 26.3 26.1 26.3
6 33.1 32.9 32.5 32.9
7 37.4 36.2 35.8 37.2
8 42.2 40.5 39.9 41.1
Time (Hrs.)
% Drug Released from ULV Niosomal Formulations F3 Formulations
F3A F3B F3C F3D
0 0 0 0 0
1 10.6 10.2 10.1 10.4
2 13.2 12.9 12.5 13.1
3 18.1 17.7 17.2 17.9
4 23.5 23.2 23.0 23.2
Chawda Himmat Singh et al. / Pharmacophore 2011, Vol. 2 (3), 168-185
6 34.2 33.8 33.1 34.0
7 38.1 37.5 36.9 37.7
8 44.8 42.1 41.2 43.5
Table 7: Determination of the order of release of nimesulide from different niosomal
formulations using the Pearson correlation coefficient parameter (r)
Niosomal Formulation
Zero Order First Order Higuchi Diffusion
Order Of Release
MLV Niosomes
F1A 0.9940 0.8376 0.9658 Zero order
F1B 0.9943 0.8413 0.9660 Zero order
F1C 0.9939 0.8415 0.9676 Zero order
F1D 0.9945 0.8400 0.9658 Zero order
ULV Niosomes
F1A 0.9940 0.8372 0.9648 Zero order
F1B 0.9945 0.8375 0.9676 Zero order
F1C 0.9941 0.8378 0.9693 Zero order
F1D 0.9939 0.8377 0.9648 Zero order
MLV Niosomes
F2A 0.9948 0.8438 0.9649 Zero order
F2B 0.9953 0.8467 0.9661 Zero order
F2C 0.9948 0.8467 0.9670 Zero order
F2D 0.9950 0.8449 0.9654 Zero order
ULV Niosomes
F2A 0.9919 0.8398 0.9591 Zero order
F2B 0.9935 0.8429 0.9622 Zero order
F2C 0.9930 0.8435 0.9614 Zero order
F2D 0.9926 0.8420 0.9598 Zero order
Chawda Himmat Singh et al. / Pharmacophore 2011, Vol. 2 (3), 168-185
F3A 0.9953 0.8439 0.9705 Zero order
F3B 0.99459 0.8445 0.9720 Zero order
F3C 0.99451 0.8451 0.9724 Zero order
F3B 0.9954 0.8472 0.9707 Zero order
ULV Niosomes
F3A 0.99486 0.8422 0.9589 Zero order
F3B 0.99484 0.8421 0.9723 Zero order
F3C 0.9946 0.8433 0.9722 Zero order
F3D 0.9950 0.8421 0.9701 Zero order
Table 8: Physical stability study of nimesulide niosomes
Formulation Code F3C
Surfactant Used
Span 60
Method
Lipid Film Hydration Method
Temperature Drug retained (in %)after following days
15 30 45 60
40C±10C 98.91 98.37 92.05 82.11
RT 90.33 88.14 80.21 75.00
370C±20C 82.11 70.83 62.99 53.24
F3C Span 60 Ether Injection Method
Temperature Drug retained (in %)after following days
15 30 45 60
40C±10C 98.40 97.89 91.41 82.0
RT 89.60 88.10 79.89 74.55
Chawda Himmat Singh et al. / Pharmacophore 2011, Vol. 2 (3), 168-185
Figure1: Calibration curve of nimesulide
.
(a) (b)
Figure2 (a): Photomicrograph of nimesulide loaded niosomes composed of span (20) and cholesterol
in 80:70 molar ratio (a) Lipid film hydration method (b) Ether injection method. 1.2
Calibration curve of Nimesulide
y = 0.037x - 0.0018
R2 = 0.9997
1
0.8
0.6
0.4
0.2
0
-0.2 0 5 10 15 20 25 30 35
Conc.(microgram/ml)
A
bsor
Chawda Himmat Singh et al. / Pharmacophore 2011, Vol. 2 (3), 168-185
(a) (b)
Figure2(b): Photomicrograph of nimesulide loaded niosomes composed of span (40) and cholesterol in
a 80:70 molar ratio (a) lipid film hydration method (b) ether injection method.
(a) (b)
Figure2(c): Photomicrograph of nimesulide loaded niosomes composed of span (60) and cholesterol in a
Chawda Himmat Singh et al. / Pharmacophore 2011, Vol. 2 (3), 168-185
Figure3: Percentage drug entrapment in niosomes prepared by lipid film hydration method and ether
injection method using Span 60 and Cholesterol in different molar ratio (1) 75:75, (2) 90:60, (3)80:70 and (4)70:80.
(a)
(b)
♦Lipid Film Hydration Method
Ether injection Method Series 1 Series 2 60 50 40 30 20 10 0
0 1 2 3 4 5
Niosomal Formulations 50 45 40 35 30 25 20 15 10 5 0 ♦75:75(mol.ratio) 90:60 ∆80:70 X70:80
0 2 4 6 8 10
Time(Hrs.) ♦75:75(mol.ratio) 90:60 ∆80:70 X70:80 50 45 40 35 30 25 20 15 10 5 0
0 2 4 6 8 10
Chawda Himmat Singh et al. / Pharmacophore 2011, Vol. 2 (3), 168-185
Figure4: In vitro release of Nimesulide loaded Niosomes compose of span 60 and cholesterol in
different molar ratios prepared by- (a)Lipid film hydration method. (b)Ether injection method.
REFERENCES
1. Satturwar, PM; Fulzele, SV; Nande, NS and Khandare, JN (2002), “Formulation and evaluation of ketoconazole niosomes”,
Indian Journal of Pharmaceutical
Sciences, Vol.64, 155-8.
2. Biju, SS; Talegaonkar, S; Mishra, PR and Khar, RK (2006), “Vesicular Systems: An Overview”, Indian Journal of Pharmaceutical Sciences, 68(2), 141-153. 3. Vyas, SP and Khar, RK (2004), “Targeted
and Controlled Drug Delivery, Novel
Carrier Systems”, First Reprint, CBS
Publishers & Distributors, New Delhi, 39. 4.Shahiwala, A and Misra, A (2002), “Studies in
topical application of niosomally entrapped nimesulide”, J. Pharm. Sci., 5 (3), 220-225. 5. Sheena, IP; Singh, UV; Kamath, R; Umadevi,
P and Udupa, N (1998), “Niosomal withaferin with better antitumor efficacy”, Indian Journal of Pharm. Sciences, 60 (1),45-48.
6. “Indian Pharmacopoeia” (1996), Govt. of India, Ministry of Health & Family Welfare, 4th Ed., Vol. II, A-144.
7.Florey, K (2001), “Analytical Profile of Drug
Substances and Exicipients”, Academic
Press ,Milliford, New Jersey, 28,199-240.
8. Azmin, MN; Florence, AT; Handajani, VR; Stuart, JFB; Vanlerberghe, G and Wittakar, JS (1985), “The effect of nonionic surfactant vesicle (niosome) entrapment on the absorption and distribution of methotrexate in mice”, J. Pharm. Pharmacol., 37,237- 242.
9. Deamer, D and Bhangham, AD (1976), “Biochem. Biphys. Acta, , 443, 629-634. Yekta Ozer, Atilla Hinal A; Bouwstra, Joke A (1991) Eur. J. Pharm. Biopharm., 37(2), 75-79.
10.Ruckmani, K; Jayakar, B and Ghosal, SK (2000), “Non-ionic Surfactant Vesicles of Cytarabine HCl for Effective Treatment of Leukemias”, Drug Development and Industrial Pharmacy, 26(2), 217-222.
11.Wan, LSC and Lee, PFS (1974), Can. J. Pharm. Sci., 9, 82.