Vol. 3, Issue 11 (November. 2013), ||V2|| PP 46-52
Challenges for Transportation Feeding and Inventory Problems
Solution Model: Study Case
S. Rick Fernandez, J. Pablo Betancur, E. Alexander Betancur
1School of Management, Shanghai University, Shanghai – China
2
School of Management and Engineering, Tsinghua University, Beijing – China
3
Business Start-Up, Seoul Global Center SGC and Mayor of Seoul, 2012, Catholic University of Korea, Seoul – Korea
Abstract: - The paper discusses the opportunities and challenges for transportation feeding and inventory problem solution model over the condition structure of grass and animals. It is obvious that major challenges of tracking assumptions on transportation cost will come from outside, including in particular regional pressures at a landscape scale as a result of structure and logistics development priorities and more diffused pressures caused by rising resources and higher economic expectations. While annual flooding is necessary for maintenance of habitats within the area condition, modifications to notion and model formulation as a result, management have the potential to impact on the way in which flooding affects the structure resources area.
Keywords: - Cost, animal consumption, trucking, buffalo ranch
I. BACKGROUND DESCRIPTION, PROBLEM SETTINGS AND ASSUMPTIONS
Buffalo Ranch is a family owned buffalo ranch located in the rocky mountains of Alberta Canada. Although it was only founded in 1993 it has grown to be the biggest private owned buffalo in Canada with over 3000 head of buffalo on thousands and thousands of acres of wild prairie. Buffalo are actually a native animal of North America that used to graze across all the wild country. They almost reached extinction in the late 1800's but have slowly started to return to their native land. High Country Buffalo has gone to great lengths to restore these majestic animals, [8] to their native habitat. This is harder than it might look. Although buffalo are a very low maintenance animal and require little in the way of human interaction, they require good fences to keep them in. In order to allow them to graze like they did hundreds of years ago the native grasses of the prairie need to be restored. Early settlers in order to plant crops plowed many of these native prairie grasses up and most of the remaining native grasses have been destroyed through improper grazing. After years of study and experimentation on this study is pleased to report that much of the native grass is returning and that hundreds of acres of tame grasses are being replaced with the grasses that were predominant before the land was disturbed. The study spread is not actually one piece of land but several pieces scattered across Western Canada. With such rich diversity that comes from these several locations come challenges. One of the challenges that Hyrum, the ranch manager, faces each year is whether to buy hay to feed the buffalo or to transport the buffalo to another ranch that still has remaining feed. This wasn't such a difficult decision years ago when there were less ranches but it has become a nightmare to try and calculate the costs of all of the different options and to pick the optimal strategy. When there is not enough feed on the (Perlow, L. A., G. A. Okhuysen, N. P. Repenning. 2002) range for the number of animals hay needs to be purchased. Hay is dried grass, or alfalfa that is rolled into large round bales weighing anywhere from 500-1000kg. These huge bales are transported on huge trucks in loads of up to 36 bales per load. They are then unloaded by tractor and then either dumped in the field for the animals to eat or chopped up with a tractor mounted hay chopper. If the decision is made to move the animals, they must be lured into and then trapped in steel corrals. They are then loaded into a double decker cattle liner pulled with a semi truck that holds an average of 55 to 60 animals. Since buffalo are wild animals the stress of being in the corrals and on the truck is stressful for them and inevitably there are some that die. The animals cannot be trucked after they start calving in April through the end of September so that the calves are big enough that they don't get trampled when loading and unloading the truck. Thus the decision of whether to feed or move is a very real problem faced by ranch management.
II. PROBLEM SETTINGS
Input:
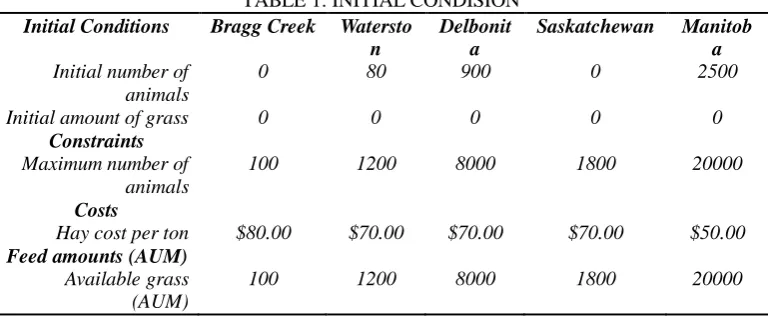
contained at each ranch, the cost to buy hay at each ranch and the available grass at each ranch was obtained. This is listed in the following table.
TABLE 1: INITIAL CONDISION
Initial Conditions Bragg Creek Watersto n
Delbonit a
Saskatchewan Manitob a
Initial number of animals
0 80 900 0 2500
Initial amount of grass 0 0 0 0 0
Constraints
Maximum number of animals
100 1200 8000 1800 20000
Costs
Hay cost per ton $80.00 $70.00 $70.00 $70.00 $50.00
Feed amounts (AUM)
Available grass (AUM)
100 1200 8000 1800 20000
Source: Authors data calculation
The feed unit AUM stands for animal unit month and is a unit that is commonly used to estimate production of pasture. In order to be able to convert between AUM and tons the following conversion data was obtained from the study. For his calculations the number of 25 pounds [9] of feed per day required by each animal is used. Considering the number of days in a month, the number of pounds in a ton and the amount of hay that is actually consumed by the animals, compared with that that is wasted on the ground, the following important factor of 0.4668 was obtained and used as the equivalent number of tons of feed required to replace one AUM.
TABLE 2: FEED CONVERSION
Feed consumption (pound per animal per day) 25 Days in a month 30 Pounds per ton 2000 Feed utilization factor 80% Animal consumption per month (in Tons) 0.47 Source: Authors data calculation
Other data that was collected was the percent of grass available in each season. This represents the care with which the native grasses are grazed. All of the grass actually grows in the summer months, but in order to increase its production it should not be grazed all the way off and in fact about half of it left. This is all right [2] because native grasses maintain much of their nutrients in the leaf even in the winter and thus can be stockpiled. Thus more of the remaining grass, about 30% of the total can be grazed in the fall, but some must be left to collect snow so that there will be sufficient moisture the following year. Thus the last 20% can be grazed in the early spring before the new grass starts to emerge.
TABLE 3: PERCENT OF GRASS AVAILABLE (PER PERSON)
Season 1 20%
Season 2 50%
Season 3 30%
Source: Authors data calculation
TABLE 4. TRUCKING COST
Trucking cost (per km) $3.00 Number of animals per
truckload 55
Death loss 1%
Average cost per animal $1,500.00 Cost to load and unload (per
truck) $275.00
Total fixed trucking costs (per
truck) $1,100.00
TABLE 5. DISTANCES (KM)
Bragg Creek Waterston Delbonita Saskatchewan Bragg Creek
Waterston 252
Delbonita 314 128
Saskatchewa
n 521 505 290
Manitoba 1219 1204 1137 913
Source: Authors data calculation
III. ASSUMPTIONS
In order to put this into a model several assumptions need to be made. Following are the assumptions listed along with the reasons for the assumptions [1], [6]. The first sets of assumptions are regarding the grass, feed and feed consumption and the second set is regarding the trucking.
Grass and feed assumptions:
o Grass cannot be grazed for two months in the spring and so in the model a constraint was included which requires that 1/3 of the grass in the second season (6 months long) must come from hay.
o Another assumption is that the capacity at each ranch is consistent. This assumption is not fully accurate because the production on each ranch will vary depending on the moisture and temperature of each season. o Another assumption is that feed, which is not used in one season, can be held over to another season. For
native grass this assumption holds true, but not for tame grasses. Although much of the grazing land for the buffalo is now native grass, there is still some tame grass, which is not taken into account in this model. [5]. o Another assumption is that all the grass is of equal nutritional value. This depends upon the exact type of
grass and the environmental conditions. The difference in nutritional content of different types of grasses is taken at least partially into account in the initial capacity estimation of each ranch.
o Another assumption is that the hay cost is constant irrespective of the volume purchased, the quality of the feed, and the seasonal and yearly price fluctuations. This variation is not considered in the model but a sensitivity analysis was conducted on it to see how the hay costs would influence the final cost.
o Another assumption is that there is no cost to feed the hay to the buffalo. There would be a marginal cost associated with this and this could be included in the purchase price of the hay.
o Another assumption is that the all the feed consumption is based on the average buffalo. Since the buffalo range from calves to full-grown bulls, their feed requirements vary greatly. Even for the same buffalo their feed requirements will vary throughout the year. Thus the average buffalo consumption was used to simplify the calculations and although this could introduce some small errors into the model, the model still provides accurate enough information for the decision whether to buy hay or move the animals.
o Another assumption made is that the average animal includes calves born in the spring and treats them as one animal unit until the following year. This is a common practice used when calculating feed requirements according to study. The calves would then need to be added to the calculations for the following year.
o Another assumption is that authors know the exact number of animals at each ranch. Since the ranch strives to return the buffalo to their native prairie and not have humans interfere, the exact number of animals is not known and these are estimations based on the owner's knowledge. [11]
o Of course one other assumption is that feed is the only determining factor in moving buffalo. Although this is the major factor influencing this decision, it is not the only one and thus the manager may not select the optimal strategy once it is found, but may use it to guide his decisions.
Trucking assumptions:
o The model includes the costs of loading and unloading the trucks. The model also includes 1% for death loss of animals being transported. Because a percentage includes the raw cost of an animals, if the value of the animals raises or drops the monetary cost for death loss will change. Also these numbers are estimates based on past years of hauling animals.
o The model assumes that there are only three times of the year when the buffalo can be transported. Although they can be transported any time from the end of September through the end of March, October, January and March are likely times for trucking to occur.
o The model also does not take into account the time that it takes to move the buffalo. Although the time the animals are on the truck may only be a few hours, the process of hauling several loads of buffalo may take a couple of weeks.
For the model authors assume that a truck can only hold 55 animals. This is of course an average and depends on the size of the animals and how wild they are.
IV. NOTATION & MODEL FORMULATION
To ensure a high-quality product, diagrams and lettering MUST be either computer-drafted or drawn using India ink.
Notation:
i,j= {1,2,3,4,5} index corresponding to {Bragg Creek, Waterton, Delbonita, Saskatchewan and Manitoba}
t: Index corresponding to season {1,2,3}
Xijt: Number of animals to move from ranch i to ranch j in season t (Decision Variables) Zijt: Number of trucks to move from ranch i to ranch j in season t (Decision Variables)
Bit: Amount in tons of additional cattle feed to buy at ranch i from in season t (Decision Variables)
Ei: Cost of buy a ton of additional cattle feed to external sources to supply ranch i (Parameter, refer to table 1) Cijt: Truck travel Cost from ranch i to ranch j in season t (Parameter, refer to Table 4 and Table 5)
Yit: Number of Animals at ranch i in the beginning of season t Fit: Amount of available grass at ranch i in the beginning of season t
Git: Grows in tons of grass at ranch i in season t (Parameter, refer to Table 2 and Table 3) SCi: Space capacity of animals at ranch i (Parameter, refer to table 1)
Z: Total cost
Others:
LSt: Length of season t, LSt= {3, 6, 3} (in months), for season 1, 2 and 3 relatively. TC: Truck capacity= 55 animals.
Fixed cost of driver, load, unload a truck= 1100.
AC: Animal consumption constant= 0,469ton of grass/month
Note:
Expected consumption during season t, will be given by: (Yit*0,469*LSt) for∀ i,t
Number of animals at ranch i in period t*Animal consumption constant * Length of season t Total decision variables: 135
Objective Function: Minimize Z (total cost
Subject to:
Feed needed at period (t): (Inventory Feed period (t-1) + growing grass(t) + Bought grass(t) – Expected consumption(t) ) ,
Fit= F(i(t-1))+Git+Bit- (Yit*LSt*0,469) for∀ i,t
In season 2 the consumption at each ranch (i) must be less or equal than 1/3 of the total bought feed (at (i) ranch)
Yi2*LS2*0,469≤3*Bi2 for∀ i Constraints (Space capacity of animals in ranch i during season t)
Yit≤SCi for∀ i,t
Constraints (relation between Trucks capacity (55animals/truck) and animals, Xijt and Zijt must be integer)
Xijt≤55*Zijt
Constraints (cattle feed resource at ranch I during season t is limited by the amount of grass)
Fit≥0 for∀ i,t
Non-negative constraint.
Xijt,Yit,Bit≥0 for∀ i,j,t
Notice: Analyzing current distribution of animals, authors may find that some ranch (e.g. Ranch 5) has more grass than the animals really needed. As the cost of buying additional food is much expensive than transporting animals, so authors should transport some animals from one ranch to another ranch. As the total amount of food need is bigger than the grass can offer, so have to buy additional food.
V. SOLUTION METHODS & RESULTS
Authors use Xpress software Optimizer solver to gain the results. 1) Phase I: Defining all the variables
2) Phase II: Initializing original variables from Excel
3) Phase III: Using For cycle Xpress language to formulate all the basic constraints. Node balancing constraints, Capacity constraints, Inventory constraints, Truck capacity constraints, and Integer constraints all are follow the Mathematical Model expressions above.
4) Phase IV: Gain the objective. Using Minimize Xpress language to the sum of travel cost and total additional feed cost.
VI. RESULTS
Some results will be useful in the further study of original model. The total cost is $312359.
(i) Season 1 strategy is: Transport 110 animals from Manitoba to Saskatchewan using 2 trucks. (ii) Season 2 strategy is: Transport 100 animals from Manitoba to Saskatchewan using 2 trucks. Season3 strategy is: There's nothing that need to do.
TABLE 6. NUMBER OF ANIMALS THAT HAVE IN SEASONS
No. of animals Bragg Creek Waterston Delbonita Saskatchewan Manitoba
Current 0 80 900 0 2500
Season1 0 80 900 110 2390
Season2 0 80 900 210 2290
Season3 0 80 900 210 2290
Source: Authors data calculation
TABLE 7. THE INVENTORY THAT HAVE IN SEASON
Inventory Bragg Creek Waterston Delbonita Saskatchewan Manitoba
Season1 9.375 0 0 14.43 18.07
Season2 32.8125 131.17 186.6 42.345 409.53
Season3 46.875 187.36 45.3 0 0
Source: Authors data calculation
TABLE 8. HAY THAT SHOULD BUY IN SEASON
Buy Hay Bragg Creek Waterston Delbonita Saskatchewan Manitoba
Season1 0 0.06 516.3 0.45 1505.8
VII. RESULT ANALYSIS AND INSIGHTS
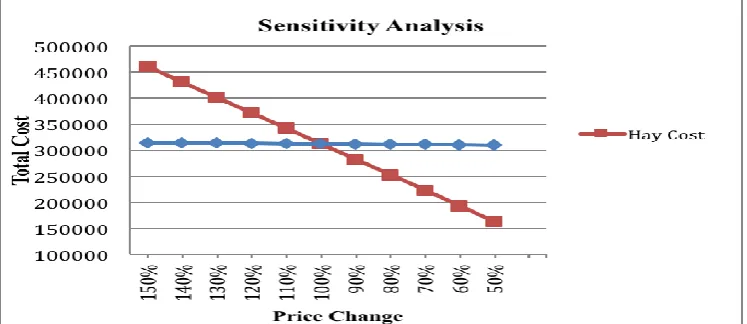
After the optimal solution has been found, sensitivity analysis has been conducted to minimize the total cost of the Ranch under other circumstances. Two variables were chosen, they are (1) Hay cost; (2) Fixed trucking cost. Assumptions were made that the fixed trucking cost and hay price would suffer from price fluctuation as price index changes time by time. In a range of 50%-150% of the original price, the result of the sensitivity analysis has been shown in Figure1 below. [3].
From Figure1 authors can achieve the following conclusions:
(1) Hay cost highly influenced the total cost, indicating that by slightly decreasing the hay price, authors can expect a huge amount of reduction of the total cost.
(2) Relatively, fixed trucking cost has played an insignificant role in affecting the total cost, showing that a reduction of the fixed trucking cost may not be quite necessary.
Also, our transportation strategy varies much as the hay price goes up and down, thus a highly attention should then be paid to hay price fluctuation before any transportation decision was made.
Fig 1. Sensitive Analysis of Hay Cost and Fixed Trucking Cost, Authors Interpretation Data
Moreover, the optimal solution shows that in each season, a transport plan of moving 2 trucks of animals from Manitoba to Saskatchewan is necessary (and none transportation is needed in season 3), which has partly deviated from the original hypothesis [7], to get a best balance of all the hay and buffalos. Due to the reason that transportation of animals is relatively more expensive than use the best of the local hay, certain optimal solution has been found, and the result can thus provide some useful suggestions for the future planning of study.
Further research direction would be an optimization of the number of ranch planning as well as whether to expand or contract certain ranches according to the hay quality and geographical limitations.
VIII. AUTHORS PROFILE
S. Rick Fernandez
Dr. S. Rick Fernandez was born in Cali City – Colombia on July 9, 1977. He moved as a child with his family to the Archipelago of San Andres, Old Providence and St. Catalina – Colombia where is RAIZAL, Island considered by UNESCO as Biosphere Reserve. In high middle school, he played basketball and football.
He is Ph.D. Scholarship holder from Shanghai University (Shanghai, China) in Management – Emphasis in Firms Cluster Integration “Taking CELAC’s Firms’ as Example into the Research Case”. He has been awarded Master in International Commerce from Shanghai University (Shanghai, China) and graduated from Santiago de Cali University (Cali, Colombia) with a bachelor degree in Finance and International Business. Dr. Fernandez served at the Ministry of Environmental Protection (MEPFECO), as Advisory Expert and Evaluator Risk and SINOCHEM AGRO as International Commercial Relation, in China; SANTO THOMAS University and National Service for Learning SENA, as Lecturer in Colombia. He is an expert advisor to international firms, and is the author of a Book entitled “Establishing an FTA Between China and Colombia”, including several international articles published in (Canada, United States, Singapore, Germany and Kenya). S. Rick as an author of several articles is an ad-hoc reviewer to the International Business Review from UK (SSCI Journal), also was a lecturer at The 4th African International Business and Management (AIBUMA 2013) Conference at University of Nairobi – Kenya. Current Senior Member at IEDRC.
J. Pablo Betancur
Ph.D candidate Pablo Betancur was born in June of 1982 in the Archipelago of San Andres, Providence and St. Catalina, Colombia. He is Ph.D candidate in Industrial Engineering, from Tsinghua University (Beijing, China) his major and research topics are in Management Science and Engineering. Moreover, Mr. Betancur has been awarded Master in Science in Communications and Information Systems, Electronics and infotmation Engineering, from Huazhong University of Science and Technology (Wuhan, China) and obtained bachelors degree in Electronics and Telecommunications Engineering from Universidad de Antioquia, (Medellin, Colombia). Engineer Pablo Betancur languages skills in English, Spanish, Portuguese and Mandarin has lead him to work internationally for MNC Huawei technologies, based in Huawei headquarters (Shenzhen, China) as International Solution Manager for American market, where Mr. Pablo Betancur had successfully completed projects in Brazil, Argentina, Venezuela, Ecuador, Chile, Colombia, Mexico and Peru. PhD candidate, engineer and Polyglot Pablo Betancur have been awarded with scholarships from both Colombian and Chinese governments. Current member of ACIEM.
E. Alexander Betancur
The Engineer E.Alexander Betancur was born in San Andres Island, Archipelago of San Andres, Old Providence and St. Catalina – Colombia, considered by UNESCO as Biosphere Reserve.
He awarded Master degree from EOI Escuela de Organización Industrial – Business School, Madrid - Spain (in Business Administration “Organizational and business plan for ORION Ltd. - company for security services in Colombia", 2009). And He is Engineer from UPB Pontifical Bolivarian University, Medellin – Colombia.
Engineer Betancur served at Telecom MNC for many years in Colombia as Global Project Manager. Also served as Planning Consultant for Land Use in the Departmental Government in the Archipelago of San Andres, Old Providence and St. Catalina, and as Business Development Manager for start-up in San Andres in order to launch new products (Coconut and "Noni" fruit derivate, Tourism services, etc...), to the national market. He was scholarship holder several times and represented Colombia for the Japan International Cooperation Agency JICA, also for Korean Government Scholarship Program KGSP, and Organization of American States OAS, mainly due to the International projects presented such as the Optical Fiber Submarine Cable Colombia-San Andres Island or Computer Based Training CBT implementation over Telecommunications platforms. He is an expert advisor for international firms in Technology as well, also an advanced consultant for the CRC Commission of Regulations for Communications -Ministry of ICT- in Colombia for the developments of technology policies and regulations, and is the author of several articles in economics’ topics for the Archipelago published in Colombia by the Central Bank -Banco de la República de Colombia-. E.Alexander was a lecturer at National Service for Learning SENA, and the INFOTEP University, both in Colombia.
REFERENCES
[1] M Ozaki, Y. Adachi, Y. Iwahori, and N. Ishii, Application of fuzzy theory to writer recognition of Chinese characters, IOSR Journal of Engineering, 2(2), 2012, 112-116.
[2] Brunsson, Nils (1982), "The Irrationality of Action and Action Ratio- nality: Decisions, Ideologies and Organizational Actions," Jour- nal of Management Studies, 19, 30-43.
[3] Burgelman, Robert (1983), "A Process Model of Internal Corporate Venturing in the Diversified Major Firm," Administrative Science Quarterly, 28, 223-244.
[4] Dill, William, R. (1964), "Varieties of Administrative Decisions," in H. A. Leavitt and L. R. Pondy (Eds.), Readings in Managerial Psychology, Chicago, IL: University of Chicago Press, 457-473.
[5] Donaldson, Gordon and Jay W. Lorsch (1983), Decision Making at the Top: The Shaping of Strategic Direction, New York: Basic Books.
[6] Schwenk, Charles R. (1985), "The Use of Participant Recollection in the Modeling of Organizational Decision Processes," Academy of Management Review, 10, 496-503.
[7] McNamara, G., P. Bromiley. 1997. Decision making in an organiza- tional setting: Cognitive and organizational influences on risk as- sessment in commercial lending. Acad. Management J. 40(5) 1063-1088.
[8] Ryan, A. M., L. McFarland, H. Baron, R. Page. 1999. An international look at selection practices: Nation and culture as explanations for variability in practice. Personnel Psych. 52(2) 359-391.
[9] Sutcliffe KM, McNamara G. 2001. Controlling decision making practice in organizations. Organization Science 12: 484-501.
[10] Schilling, M. A., H. K. Steensma. 2001. The use of modular organi- zational forms: An industry-level analysis. Acad. photo