e-ISSN: 2250-3021, p-ISSN: 2278-8719 Vol. 3, Issue 4 (April. 2013), ||V3 || PP 20-24
Automatic Inspection of Potential Flaws In Glass Based on Image
Segmentation
Jaina George
1, S.Bhavani
2, Dr.J.Jaya
3 1PG Scholar, Sri. Shakthi Institute of Engineering and Technology, Coimbatore, Tamil Nadu. 2
Head of the Department/ECE, Sri. Shakthi Institute of Engg and Tech, Coimbatore 3
Principal, Akshaya College of Engineering and Technology, Coimbatore.
Abstract:Glass defects which result into poor quality are a major reason of embarrassment for manufacturers. Glass defects are typically unavoidable, but their occurrence must be minimized during the production of high-quality glasses. It is a tedious process to manually inspect very large size glasses. The manual inspection process is slow, time-consuming and prone to human error. Automatic inspection systems using image processing can overcome many of these disadvantages and offer manufacturers an opportunity to significantly improve the product quality and reduce costs. Common defects produced by these manufacturing techniques are scratches and cracks which are the real issue for the glass industry. Potential defects removal includes image denoising and FCM. Based upon the PSNR value comparison wiener filter is having highest PSNR value. Then the Universal Image Quality Index shows the segmentation parameters and Pearson correlation coefficient shows the amount of correlation.
Keywords: Peak Signal to Noise Ratio, Fuzzy C means Clustering, Filtering, and Mean Square Error.
I. INTRODUCTION
In every image acquisition device the lighting conditions play a major role in the quality of the acquired images and therefore in the inspection task. Since natural lighting conditions are dynamic and changes all the time. It is not feasible to implement algorithms that are robust to illumination changes without burning important computational time [6]. Therefore, the use of artificial lighting is a requisite for reaching good and uniform illumination for real-time inspection systems. There exist several studies, e.g. [7], concerning the placement of external light sources around the object under examination. However, we do not know any work reporting on light sources placed inside a glass bottle. We proposed the design of an electro-mechanical device for image acquisition and inspection of glass wine bottles using an internal illuminating system. This allows us to obtain high-quality images for capturing very small defects, and to avoid the intrinsic reflections produced by external light sources.Among the global thresholding techniques, the Sahoo et al. (1988) study concluded that the Otsu method (Otsu, 1979) was one of the better threshold selection methods for general real world images with respect to uniformity and shape measures. This method selects threshold values that maximize the between-class variances of the histogram. To this aim, several methods relevant to the inspection of glass have been proposed in literature; examples are the scanning laser beam [1] - [2], the neural network system [3], the independent component analysis model [4], the area or feature based techniques [5]; unfortunately, there is no method which is really accurate, low cost and reasonably at the same time. Moreover, the systems already on the market do not agree with the flexibility requirements of these industrial applications. In this paper, the authors propose an accurate and affordable prototype able to perform analysis of satin glass sheets; the method peculiarity is that it detects small defects in non-uniform intensity and low contrast images and it is rather robust with respect to changes of the glass type and to other operating conditions. The preliminary results, obtained by means of several tests, encourage the authors to deepen some technical problems and to suggest the reported system as a reliable alternative to more expensive techniques.
II. FILTERING
2.1 LOW PASS FILTER
Low pass filtering, otherwise known as "smoothing", is employed to remove high spatial frequency noise from a digital image. Noise is often introduced during the analog-to-digital conversion process as a side-effect of the physical conversion of patterns of light energy into electrical patterns. Low Pass filter removes some of the higher frequency features, while allowing the low-frequency features to “pass” through the filter unchanged (thus the term “low pass” filter).
2.2 HIGH PASS FILTER
A high-pass filter (HPF) is an electronic filter that passes high frequency signals but attenuates (reduces the amplitude of) signals with frequencies lower than the cutoff frequency. The actual amount of attenuation for each frequency varies from filter to filter. A high-pass filter is usually modeled as a linear time-invariant system. It is sometimes called a low-cut filter or bass-cut filter. The High Pass filter selectively enhances high-frequency components while maintaining the low-frequency components that constitute most of the information in the image.
2.3 MEDIAN FILTER
Median filtering is a nonlinear process useful in reducing impulsive or salt-and-pepper noise. It is also useful in preserving edges in an image while reducing random noise. Impulsive or salt-and pepper noise can occur due to a random bit error in a communication channel. In a median filter, a window slides along the image, and the median intensity value of the pixels within the window becomes the output intensity of the pixel being processed.
This replaces each pixel value by the median of its neighbors, i.e. the value such that 50% of the values in the neighborhood are above, and 50% are below. This can be difficult and costly to implement due to the need for sorting of the values. However, this method is generally very good at preserving edges.
2.4 WIENER FILTER
The most important technique for removal of blur in images due to linear motion or unfocussed optics is the Wiener filter. From a signal processing standpoint, blurring due to linear motion in a photograph is the result of poor sampling. Each pixel in a digital representation of the photograph should represent the intensity of a single stationary point in front of the camera. This is a two-dimensional-analogy. G (u, v) =F (u, v).H (u, v)
Where F is the Fourier transform of an "ideal" version of a given image, and H is the blurring function. In this case H is a sink function: if three pixels in a line contain info from the same point on an image, the digital image will seem to have been convolved with a three-point boxcar in the time domain. Ideally one could reverse-engineer a Fest, or F estimate, if G and H are known. This technique is inverse filtering.
2.5 GAUSSIAN FILTER
Gaussian filter is a filter whose impulse response is a Gaussian function. Gaussian filters are designed to give no overshoot to a step function input while minimizing the rise and fall time. This behavior is closely connected to the fact that the Gaussian filter has the minimum possible group delay. Mathematically, a Gaussian filter modifies the input signal by convolution with a Gaussian function; this transformation is also known as the Weierstrass transform.
These equations can also be expressed with the standard deviation as parameter
g x = 1 ς 2π e
−x 2 2ς 2
Where the standard deviations are expressed in their physical units, e.g. in the case of time and frequency in seconds and Hertz.
III. FUZZY C MEANS CLUSTERING
Clustering techniques are mostly unsupervised methods that can be used to organize data into groups based on similarities among the individual data items. Most clustering
algorithms do not rely on assumptions common to conventional statistical methods, such as the underlying statistical distribution of data, and therefore they are useful in situations where little prior knowledge exists. The potential of clustering algorithms to reveal the underlying structures in data can be exploited in a wide variety of applications, including classification, image processing, pattern recognition, modeling and identification.
Fuzzy c-means allows data points to be assigned into more than one cluster each data point has a degree of membership (or probability) of belonging to each cluster.
Initialize membership U(0) = [ uij ]
cj
= (u ij )m xi n i=1
(u ij )m n i=1
m is the fuzzy parameter and n is the number of data points.
Cluster analysis divides data into groups (clusters) such that similar data objects belong to the same cluster and dissimilar data objects to different clusters. The resulting data partition improves data understanding and reveals its internal structure. Membership degrees between zero and one are used in fuzzy clustering instead of crisp assignments of the data to clusters. The most prominent fuzzy clustering algorithm is the fuzzy c-means, a fuzzification of k-Means or ISODATA.
Areas of application of fuzzy cluster analysis include for example data analysis, pattern recognition, and image segmentation. The detection of special geometrical shapes like circles and ellipses can be achieved by so-called shell clustering algorithms. Fuzzy clustering belongs to the group of soft computing techniques (which include neural nets, fuzzy systems, and genetic algorithms).
IV. EXPERIMENTAL RESULT
Fig 1: non-linear filter output
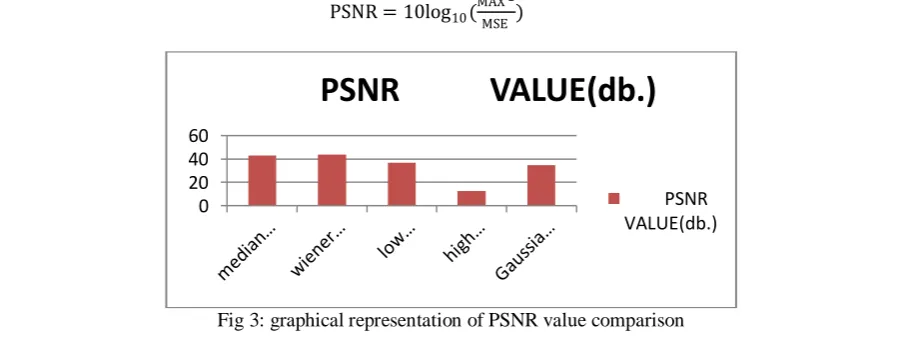
Fig 2: PSNR value comparison of various filters
The peak signal-to-noise ratio (PSNR) is the ratio between a signal's maximum power and the power of the signal's noise.
PSNR = 10log10( MAX2
MSE)
Fig 3: graphical representation of PSNR value comparison 0
20 40 60
PSNR VALUE(db.)
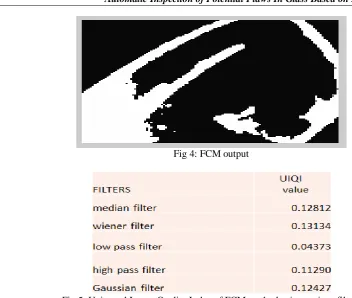
Fig 4: FCM output
Fig 5: Universal Image Quality Index of FCM method using various filters
Image Quality Index is mathematically defined by modeling the image distortion relative to the reference image as a combination of three factors: loss of correlation, luminance distortion, and contrast distortion. If two images f and g are considered as a matrices with M column and N rows containing pixel values f[i,j], g[i,j], respectively (0 ≥ i > M, 0 ≥ j > N ), the universal image quality index Q may be calculated as a
product of three components:
Q = ςfg ςfςg
. 2f g (f )2+ (g )2.
2ςfςg
ςf2+ ςg2
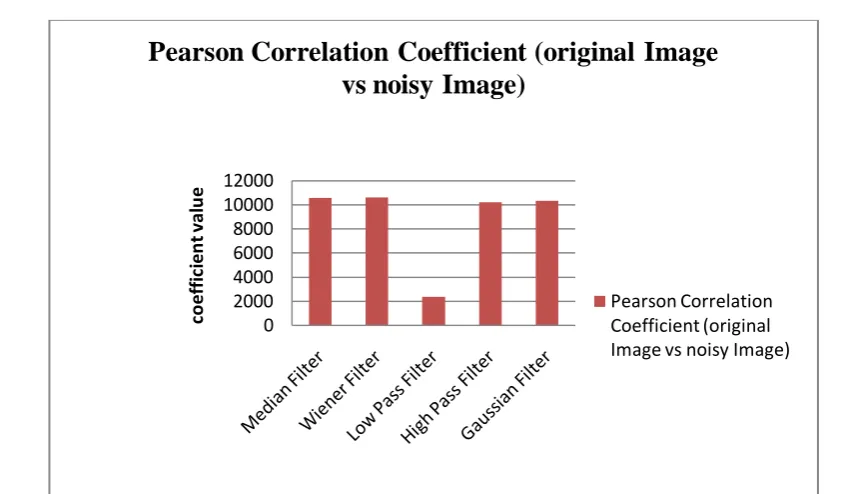
Filter Pearson Correlation Coefficient (original Image vs noisy Image)
Median Filter 10566.89
Wiener Filter 10602.43
Low Pass Filter 2391.848
High Pass Filter 10205.59
Gaussian Filter 10345.48
Fig 6: Pearson Correlation Coefficient (original Image vs. noisy Image) after FCM method
The Pearson product-moment correlation coefficient (sometimes referred to as the PPMCC or PCC,[1] or Pearson's r) is a measure of the correlation (linear dependence) between two variables X and Y, giving a value between +1 and −1 inclusive. It is widely used in the sciences as a measure of the strength of linear dependence between two variables.
The value of Pearson's correlation coefficient, unlike all other estimates for continuous dependent variables, is influenced by the distribution of the independent variable in the sample.
ρX,Y= corr(X, Y)
=cov (X,Y)
ςXςY
Fig 6: Graphical representation of Pearson Correlation Coefficient (original Image vs. noisy Image) after FCM method
V. CONCLUSION
The main idea of this strategy is that, unlike the noise that appears randomly in images, only the flaws remain stable in a sequence of images because they retain their position relative to the movement of the object being analyzed. Typically it is applied in glass manufacturing industry. Fuzzy clustering is a powerful unsupervised method for the analysis of data and construction of models. Various filters such as low pass filter, high pass filter, wiener filter, Gaussian filter, median filters are used in this method. Wiener filter gives high PSNR value after filtering and it gives better Universal Image Quality Index after Fuzzy C means Clustering. Pearson correlation coefficient shows the correlation between original image and noisy image.
REFERENCE
[1]. M. Leconte, “Laser glass inspection system”, International Society for Optical Engineering, pp. 878-882, 1997.
[2]. M. I Park, J. R. Choi, M. Park, D. S. Choi, S. C. Jeoung, “Rapid Prototyping of glass microfluid devices using femtosecond laser pulses”, Mat. Res. Soc. Symp. Proc., pp. 1-6, 2004.
[3]. J. Cios, R. E. Tjia, N. Liu, R. Langenderfer, "Recognition of defects in glass ribbons using neural networks", IEEE Proc. of NSF Design and Manufacturing System, Dearborn, pp. 203-206, 1997. [4]. D. Tsai, P. Lin, C. Lu "An independent component analysis-based filter design for defect detection in low
contrast surface images", Pattern Recognition, pp. 1679-1694, 2006.
[5]. S. A. Bakalexis, Y. S. Boutalis, B. G. Mertioz, “Edge detection and image segmentation based on nonlinear anisotropic diffusion, IEEE Conf. on Digital Signal Processing, pp. 1203-1206, 2006.
[6]. S. K. Kopparapu, “Lighting design for Machine vision application,” Image Vis Comput, vol. 24, no. 7, pp. 720–726, 2006.
[7]. S. Yi, R. Haralick, and L. Shapiro, “Optimal sensor and light source positioning for machine vision,” Comput. Vis. Image Underst., vol. 61, no. 1, pp. 122–137, 1995.
0 2000 4000 6000 8000 10000 12000
co
ef
fi
ci
en
t v
al
u
e