Forestry & Natural-Resource Sciences Last Correction: Oct. 11, 2018
COMPARING PROPERTIES OF SELF-REFERENCING MODELS
BASED ON NONLINEAR-FIXED-EFFECTS VERSUS
NONLINEAR-MIXED-EFFECTS MODELING APPROACHES
C.J. Cieszewski
1, M. Strub
21University of Georgia, Athens, GA, USA 2
Retired, Weyerhaeuser Co., Hot Springs, AR, USA
Abstract. In this study, we compare the properties of self-referencing models, such as various site
dependent growth and yield models for predictions of height, diameter, basal area, volume, and density, de-veloped using Nonlinear-Fixed-Effects (NFE) versus Nonlinear-Mixed-Effects (NME) modeling approaches. The properties investigated include the following core traditional well-behaved model characteristics applicable to self-referencing functions: Base-Age-Invariance, Path-Invariance, Indifference Under Model Reparameterization, and Model Conditioning to have the predictions at the base-age equal to the reference point, as well as estimation and prediction statistics such as bias and variance of the fitted versus predicted residuals. The results of this investigation demonstrate that self-referencing models based on the NFE approach possess all the desirable properties associated with logical behavior of the model and estimation statistics, while the NME based self-referencing models lack the well-behaved model properties. We illustrate these properties using an example of fitting self-referencing models to panel data of loblolly pine age-height measurements on a range of sites from the South Africa Correlated Curve Trend Study.
Keywords: Mixed-Effects; Fixed-Effects; Self-Referencing; Base-Age-Invariance; Path-Invariance; Invariance Under Reparameterization; Well-Behaved Models; Model Conditioning; Site Models.
1
Background
1.1 Relevance of Self-Referencing Models and Types of Data
The self-referencing models are equations that use as in-put a point of reference defining the curve that passes through the point, as in the case of initial condition equations or boundary point solutions. Models based on such equations enable the users to use existing snap-shot observations from a given population to simulate their dynamics more accurately than in the case of us-ing broad population averages. The ability to use a known value of a snapshot observation in prediction models plays a vital role in the analysis of forest growth and yield dynamics in forest management, especially in monospecific even-age stands, such as tree plantations or fire origin regenerated stand populations. Such ability may be less critical but also helpful in other applications (e.g., see Cieszewski et al. 2013, Eq. 8).
The self-referencing functions are calibrated on re-peated measures data, and are applicable to all essential stand characteristics such as height, diameter, volume, taper, and density; they are used for modeling all sig-nificant components of forest population dynamics in-cluding every aspect of growth and yield, mortality, and competition. The issues discussed in this article apply to all such models based on self-referencing functions, but for the clarity of the argumentation, we conduct this discussion using an example model from just one of the listed categories.
The height of dominant trees is an excellent exam-ple of an application of the self-referencing modeling, because tree height is a subject to functional changes across both the cross-sectional and longitudinal dimen-sions, while at the same time, the dominant or top height is the most stable stand characteristic that is less affected by crowding then other stand characteris-tics (Raulier et al. 2003) such as diameter, tree volume, taper, or mortality. The self-referencing site-height-age
models, hereafter called site models, are an essential component of the majority of growth and yield mod-els in forestry and play an important role in forest management decision making and planning. Nearly all contemporary height growth models are based on self-referencing functions using an available observation of a population of interest, such as an inventory measure-ment, to define the growth trajectory corresponding to the subpopulation of interest.
Site models are typically developed either from stem analysis data or permanent sample plot data. Stem anal-yses usually provide longer time series records and allow for more effective analysis of changes over time. On the other hand, some practitioners argue that the perma-nent sample plot data are more realistic because dom-inant trees may change their positions over time either due to environmental conditions or due to physical dam-age (see Burkhart and Tom´e 2012, section 7.3.3, for a broader review of the salient literature on the subject). Regardless of which data are used for the self-referencing models they need to represent multiple se-ries corresponding to different development potentials (e.g., site quality) with individual levels of performance. Since the different potentials are commonly unobserv-able variunobserv-ables, in the sense that they cannot be measured or observed explicitly, they are represented implicitly by a snapshot observation of the performance potential of any given series. The challenge in developing and fitting self-referencing models to such data is making the model capture unique characteristics of individual longitudinal series while accounting for common characteristics of the entire population. In practice, this can be accomplished through subject-specific fitting of all the series simulta-neously to a common model, in which some of the pa-rameters vary between different individuals, subjects or series.
Historically, there were various other approaches at-tempting to solve this problem, most of which were de-veloped for site-dependent-height-age models, and they were evolving over time throughout the world. The sim-plest way to develop a site-dependent height-age model was fitting all the data to a mean curve, called the guide curve, and then adjusting the resulting curve by scal-ing it to pass through the reference point durscal-ing the model application. This method was not modeling the characteristics of individual series and was eventually abandoned in favor of predominantly the fixed-base-age approach. The latter approach used one data point per series, which was frequently interpolated, as a site qual-ity indicator, in a similar manner as it is done in the model implementation, treating this data point as the in-dependent variable during the fitting of multiple curves. This method failed to produce Base-Age-Invariant pa-rameter estimates (BAIPar), resulting in inconsistent
pa-rameters for different choices of base-age, and conse-quently, it has been largely abandoned. A more effec-tive subject-specific approach was eventually adopted by using the varying-parameter methods, such as the Nonlinear-Fixed-Effects (NFE) modeling approach and subsequently the Nonlinear-Mixed-Effects (NME) mod-eling approach. Accordingly, most of the contemporary self-referencing models are developed using one of these two subject-specific approaches, and the purpose of this study is to investigate the properties of their resulting models and their predictions.
1.2 Self-Referencing Model Forms and Their Properties
The main properties of the self-referencing models, whether mathematical equations or algorithmic heuris-tics, are the Base-Age-Invariant model predictions (BAIPred), Model Conditioning (MC) to predict values
at a base age equal to the input values of the refer-ence points, and Path-Invariance (PI). The PI property is similar to BAIPred, but it has broader applications
including those in ageless models and difference equa-tions. It means that the trajectory of height predictions over time in iterations is unaffected by different selec-tions of steps executed for the predicselec-tions, such as in 1-year versus 5-year iterations. This also means that the projection of height from an initial age to middle age and then to a final age results in the same final height prediction as projecting the height at the final age directly from the height at the initial or any other age. This property results in consistent height predic-tions regardless of the sequence in which they are sim-ulated. Clutter et al. (1983) point out the desirability of site index curves that pass through the site index at base age, which is MC. All the above three properties es-sentially mean that the self-referencing model generates unequivocally identical curves using any point on the curve, and they constitute the algebraic properties of the model formulation rather than the statistical prop-erties of the model parameter estimates as in the case of BAIPar.
Self-referencing models can be based on different mathematical equations. Early formulations of equa-tions used for developing site models were incorporating a fixed base age site index (e.g., H = f(A, S); where S is site index), defined as a height at a fixed arbitrary base age — usually 25, 50, 75 or 100 years. In prac-tice,S in such models is not always consistent with the definition, which may cause problems with the model implementation.
Clut-ter (1974) or the Generalized Algebraic Difference Approach (GADA) of Cieszewski and Bailey (2000), who formalized the Cieszewski (1994) methodology. ADA and GADA dynamic site equations have de-sirable model properties including BAIPred, PI, and
MC, with curves that go through S at base age. A substantially higher algebraic complexity of GADA models, which are generally more complicated math-ematically than the fixed base age site models, has been somewhat a deterrent to their implementation. Nonetheless, there are many developments using such models (e.g., Adame et al. 2006, Cieszewski 2001– 2003, (De los Santos-Posadas et al. 2006, Di´ eguez-Aranda et al. 2006a,b, Elfving and Kiviste 1997, Eriks-son et al. 1997, Krumland and Eng 2005, Nord-Larsen 2006, Rivas et al. 2004, Trincado et al. 2003). On the other hand, many site models developed through other approaches, such as fixed base age site index, may not share the above properties.
1.3 Self-Referencing Model Parameter Estima-tion Properties
The main properties of parameter estimation are BAIPar
and Invariance Under Reparameterization (IUR). These are both statistical properties, which essentially mean that the estimated parameter values are unaffected by different selection of base age or by different parameter-izations of the model forms used in model fitting.
Parameter estimation of site models has been evolv-ing as much as the mathematical formulations. The oldest statistical method was based on the guide curve approach, which was merely fitting a mean height-age curve, subsequently scaled down or up to predicts low and high sites. Later subject-specific estimation meth-ods were used to estimate the parameters of site models by treatingS as observable variable taken directly from the data or data interpolations. The problem with this approach of site model parameter estimation is that the estimates of the site model parameters vary with differ-ent selections of base age. Since there is no right choice of base age for parameter estimation, this anomaly is a pitfall of base age-specific parameter estimation, which resulted in the eventual abandonment of this approach.
Bailey and Clutter (1974) introduced the application of covariance analysis for BAIPar subject-specific
pa-rameter estimation. DuPlat and TraHa (1986) gen-eralized this approach to nonlinear regression analysis using dummy variables, which is the Nonlinear Fixed-Effects (NFE) parameter estimation. Tait et al. (1988) and Cieszewski et al. (2000) show alternative program-ming approaches for implementation of the NFE subject-specific parameter estimation, which is not readily avail-able in most commonly used software. The main
ad-vantages of NFE parameter estimation are the desirable BAIPar and IUR.
Biging (1985), Lappi and Bailey (1988), and Lappi and Malinen (1994) have suggested using random pa-rameter models for site model papa-rameter estimation. Then, Lindstrom and Bates (1990) introduced the NME modeling approach, in which some of the parameters are treated as having random effects assumed to follow a random distribution (typically normal). Subsequently, Fang and Bailey (2001) and Calegario et al. (2005) among others advocated the use of the NME models for various types of forest growth and yield modeling.
NFE and NME approaches are both varying parame-ter methods, in which some parameparame-ters are common for all data, and some are subject-specific and vary between different series and are called hereafter site effects. The principal difference between the two approaches is that in the NME approach the site effects are assumed to be random, or have random component, and therefore, have to meet their distributional assumptions (e.g., nor-mal distribution). In the NFE approach the site effects have no restrictions and can assume any values needed for the best fit, which means that, by definition, the NFE models must fit any data as good or better than a sim-ilar NME model. The same number of parameters can be made subject-specific in either of these approaches. Otherwise, the statistical models for both these subject-specific approaches are in general very similar.
Finally, it should be noted that just about any type of equation can be fitted with just about any type of the fitting methods discussed earlier. This topic, how-ever, is not a part of our study. We do not discuss here such matters as, for example, fitting GADA mod-els with guide curve or fixed base-age techniques, nor do we intend to discuss in detail various methods of model derivation or selection, which could be done with math-ematics or fitting techniques, such as the NFE or NME modeling approaches. This study is concerned strictly with the comparison of fitting and predicting specific self-referencing functions with the NME versus NFE ap-proaches, which are principally similar to each other but may vary in some of the well-behaved model properties discussed in this article.
1.4 Self-Referencing Model Prediction Proper-ties
The main properties of well-behaved self-referencing model predictions are in part the same as for model forms and algorithmic heuristics, and they are the BAIPred, PI, and MC. Also, when considering model
estimated, or what procedures are used for generating the predictions, as in the NME models.
While it is conceivable that someone may occasion-ally use a model for a tree or stand at an age equal to the base age, such an event is generally unlikely. Thus, predictions from fixed base age site models are gener-ally obtained by first estimating or computingS values from data available at different ages. Estimated S val-ues are then used as the input for the model prediction process to compute the height at the desired prediction age. If the predictions are part of an iterative simula-tion then the computed height is used to estimateS re-peatedly through iterations (depending on whether the model predicts height at base age are equal toSand how compatible the estimation ofSis with height prediction) may or may not be BAIPred, PI, and MC. Thus fixed
base age site models vary in their behavior and proper-ties. In particular, models that don’t have mathemati-cally tractable solutions for S are prone to misuse and ill-conditioned predictions. Rose et al. (2003) demon-strated that an MC and BAIPredmodel (Cieszewski and
Bella 1989), even when it’s based on foreign data, pre-dicts more accurate heights than a native, not MC and not BAIPred, model that was fitted to the local data.
Predictions of ADA and GADA based models are com-puted directly from height-age inputs. Those models are by design conditioned to meet the desirable and well-behaved model properties of BAIPred, PI, and MC.
In this study, we consider predictions from NME models that can be generated through the use of Best Linear Unbiased Predictors (BLUPS) or Empiri-cal Best Linear Unbiased Predictors (EBLUPS). Since the NME modeling has extensive software support in SAS, making it easy to use even by inexperienced mod-elers, and EBLUPS produce small variances and biases, the NME modeling approach has been rapidly gaining popularity among forest practitioners. Some develop-ments utilizing the NME modeling approach include Do-rado et al. (2006), Sharma and Parton (2007), Meng and Huang (2009), Calegario et al. (2005), Fang and Bailey (2001), Wang et al. (2007), Adame et al. (2008), Calama and Montero (2004), and Saunders and Wag-ner (2008).
The literature lacks information about the properties of NME model predictions and their suitability for forest management practices and operational use. The general soundness of NME model EBLUPS predictions has not been investigated in detail in the forest modeling com-munity. The purpose of this study is to investigate this subject and report the performance of the two subject-specific approaches according to historically established criteria for well-behaved model core properties.
1.5 The Objective of This Study
Our specific objectives were to use well-behaved self-referencing equations, with mathematical properties of MC and BAIPred of the fitted equation, to test the
sta-tistical properties of NFE and NME models with respect to their:
1. BAIPar of model fitting, BAIPred of model
predic-tions, and IUR;
2. MC to predict height at the base age equal toS;
3. PI of the model predictions in iterative simulations;
4. The existence of any systematic deviations from the expected outcomes; and
5. Logical model behavior.
2
Data
We used data from 15 plots in the South Africa Corre-lated Curve Trend (CCT) study to illustrate the proper-ties of the two types of models resulting from NFE and NME modeling approaches. The data consists of mea-surements replicated at three locations and were origi-nally described in Strub and Bredenkamp (1985); and therefore, they are not discussed here in detail. We used plots thinned to 300, 200, 150, 100 and 50 trees per acre before intra-specific competition for this study. Due to the low densities of the plots, the data (Figures 1, 2 and 3) do not show any apparent trends resulting from the differences in the stocking.
Figure 2: CCT data from Kwa Mbonumbi, South Africa.
Figure 3: CCT data from Mac-Mac, South Africa.
3
Methods
3.1 Base Model Selection and Verification
To illustrate the differences between the NFE and NME parameter estimation and predictions, we selected the Schumacher (1939) function for the derivation of site equations:
H=eα−Aβ (1)
where:
– H is stand height;
– A is stand age,
– αand β are model parameters; and
– eis the base of natural logarithms.
Cieszewski and Bailey (2000) discuss derivations of several GADA models based on this function that are derived by modeling different relationships between α andβ across the range of site qualities. One of the sim-plest examples of their models is based on the linear rela-tionship between the function parameters, which can be
accomplished by modeling each of them as proportional to an unobservable variable X (e.g., α= X; β =γX) (see Cieszewski and Bailey 2000 Eq. 14). This is the ba-sis for our comparative analyba-sis of differences in model behavior in NFE versus NME parameter estimations and NFE versus NME model prediction approaches.
Following this example we reparameterized Cieszewski and Bailey (2000, Eq. 14) to a two-parameter site-height-age base model:
H=eX−γXA (2)
where:
– Xis an arbitrary unobservable variable of unknown magnitude that varies with site quality, or plot, or growth series, and which needs to be estimated by using empirical data; and
– γis the new global parameter that is common to all growth series and is estimated simultaneously with the estimation ofX using empirical data.
Cieszewski and Bailey (2000, Eq. 15) recommend fur-ther reparameterization of the GADA formulation us-ing the expected value parameterization originally pro-posed by Schnute (1981) and Ratkowsky (1990) which improves parameter estimation properties. We further modified the model to its implicit form using data-related reference points instead of the explicit unobserv-able variunobserv-able X. The expected value parameterization of Equation (2) requires solving for X (X =f(H, A)) and then substituting the solution with specific value X0 =u(H0,A0) for X in Equation (2), which results in
the following implicit dynamic equation:
H =eln(H0)(AA0)
A−γ
A0−γ
(3)
where:
– A0 is an arbitrary reference age;
– H0 is an arbitrary reference height, such asS; and
– all other symbols are as previously defined.
3.2 The NFE Site Models
To use more traditional terminology, we denote H0 as
S and the base age as A0. Then, ln(S) is the
natu-ral logarithm of S, and onlyS varies by growth series. This formulation is commonly known as a fixed-base-age site model, except that in our formulation the base age is a variable and can be changed without affecting the equation properties as long asScorresponds to a se-lected base age. We will use both formulations of explicit Equation (2) and implicitS Equation (3).
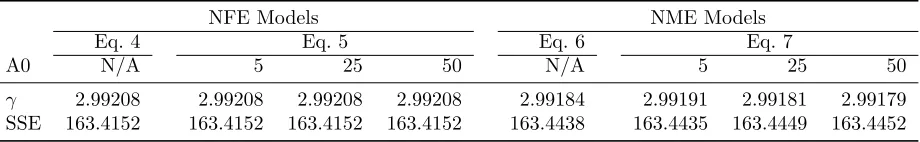
Table 1: Global parameter estimates and residual of sum of square errors (SSE) for NFE and NME models.
NFE Models NME Models
Eq. 4 Eq. 5 Eq. 6 Eq. 7
A0 N/A 5 25 50 N/A 5 25 50
γ 2.99208 2.99208 2.99208 2.99208 2.99184 2.99191 2.99181 2.99179
SSE 163.4152 163.4152 163.4152 163.4152 163.4438 163.4435 163.4449 163.4452
series while the others, such as site effects, vary between the series. In statistical notation the explicit site-height-age Equation (2) fitted as a NFE model can be expressed as:
Hij =e Xi−γXiAij
+εij (4)
where:
– idenotes individual growth series,
– j is an individual age within a growth series; and
– εij is an independent normally distributed error term with mean zero and varianceσ2.
The fitting form of the implicit dynamic site-height-age Equation (3) becomes:
Hij=e
ln(Si)A0
Aij
Aij−γ A0−γ
+εij (5)
where Si is the site index at base ageA0 and is
esti-mated from the data. All other notation is as previously defined.
3.3 The NME Site Models
What distinguishes the NME models from the NFE models is that they have an additional constraint that the varying parameter, or site effects Xi consists of a sum of its mean value and individual-specific deviations Ui, which are called random effects and must be ran-domly distributed. This, in addition to the estimation of the global model parameters, requires estimation of the mean and variance parameters for the assumed, typi-cally normal, distribution, potentially additional covari-ance parameters for multiple random effects, and im-poses constraints on what values the site effects can as-sume so that they conform to the assumption of the randomly distributed site effects.
The NME models are derived by substituting for the NFE, Xi that vary by growth series, or Si, with a ran-dom parameterX +Ui or S+Ui. X and S are mean values for all growth series, and Ui is a random normal deviant with mean zero and variance σ2
U. Accordingly, the explicit Equation (2) fitted as the NME model can be statistically defined as:
Hij =e
X+Ui−γ(X
+Ui) Aij +ε
ij (6)
and the implicit dynamic site-height-age Equation (3) fitted using NME modeling can be written as:
Hij=e
ln(S+Ui)A0
Aij
Aij−γ A0−γ
+εij (7)
where all the symbols are as previously defined.
3.4 Model Parameter Estimation and Model Predictions
We fit both of the NFE models (4) and (5) with the SAS NLIN procedure (version 9.3). We tested the fitting of the NFE Equation (4) directly, estimating Xi individ-ually for each growth series. We also tested the fitting the NFE Model (5), estimatingSi individually for each growth series and each of base ages: 5, 25 and 50 years. The NFE model parameter estimation is straightforward and can be computed with the SAS NLIN procedure (version 9.3) or Excel using the Solver Add-in.
Using the NFE site Equation (5) we computed pre-dictions for heights directly at ages 1 through 50 from the parameter estimates (Table 1) base ages 5, 25 and 50 and a range ofS.
We fit both NME models (6) and (7) with the SAS NLMIXED procedure (version 9.3) using the assumption of normally distributed random effect.
After fitting the NFE and NME models, we exam-ined the results of parameter estimation and sum of squared residuals. The primary objective of this exami-nation, however, was to identify any parameter estimate discrepancies between estimates based on different base ages and model parameterizations, since it was evident that the NFE must always produce lower sum of squared residuals than the NME models.
estimates, but instead maximizes the likelihood numeri-cally. SinceSvalues that are not constrained to be equal to height at base age affect model behavior and its pre-dictions we comparedSvalues computed with the NME model with the conditionedSvalues of the NFE models. Finally, since the use of growth models in multiple steps is more a standard than an exception we also tested the NME model predictions in multiple steps to illus-trate the impact of lack of model conditioning for PI of model predictions.
4
Results
4.1 Model Assumptions
The model of Cieszewski and Bailey (2000 Eq. 23) that was used (Eq. 2 and 3) for testing differences between the NFE and NME modeling approaches implies a lin-ear relationship between the parameters of the Schu-macher’s (1939) base Equation (1). Verification of this assumption was shown by fitting the base Equation (1) to all the individual growth series and analyzing the rela-tionship between the parameter estimates. Examination of the parameter estimates from the fitting of Model (1) to individual growth series showed a reasonable linear relationship (Figure 4) between the parameters across the available range of site qualities for the CCT dataset. The fifteen pairs of parameter estimates conformed well to a linear relationship between the parameters with a good fit of the linear function with R2 of 0.839, which
warranted our choice of the model for the analysis. The intercept was not significantly different from zero.
y = 2.9966x R2 = 0.839
9 9.5 10 10.5 11 11.5 12
3.2 3.3 3.4 3.5 3.6 3.7 3.8 3.9 4
alpha
be
ta
Figure 4: The relationship between parameter estimates ofαandβin the Schumacher (1939) model for the South Africa CCT data.
4.2 Model Fitting
As expected, fitting the implicit NFE Model (5) to all data using different base ages resulted in identical pa-rameter estimates regardless of the different selections
of base age. To the contrary, the parameter estimates of the implicit NME Model (7) varied with a different selec-tion of base age from 2.99179 to 2.99191 (Table 1), which demonstrates the lack of BAIPredin the NME modeling
approach to parameter estimation.
Fitting the explicit formulation NFE Model (4) results in identical parameter estimation (Table 1) to estimates with the implicit formulation of the NFE Model (5) prov-ing this NFE to be IUR. To the contrary, fittprov-ing the explicit formulation of the NME Model (7) results in different parameter estimates from fitting the implicit formulation of the NME Model (6), which demonstrates the lack of IUR of the NME modeling approach to pa-rameter estimation.
As expected, the SSE was the smallest and identical in all the IUR NFE fitting of different model parameter-izations. The SSE for the NME fitting is only slightly larger than the one resulting from the NFE fitting, which indicates that the normality assumption with regards to the random effects proved to be suitable for this data.
4.3 Model Predictions
All predictions of NFE models generated consistent curves regardless of the selections of base age (Fig-ures 5, 6 and 7) and predicted the heights at the base age equal toS; and therefore, the NFE model parameter estimation proved to be BAIPred, PI, and MC.
Figure 5: Fixed-Effects model curves (solid line) and Mixed-Effects model curves (dashed line) for base age 50 parameter estimates and site indexes 10, 20, 30, 40 and 50.
The NME model predictions generated using the TECH=None option in SAS NLMIXED procedure var-ied with different selections of base ages and site quality, for which the predictions were made, which demonstrate the lack of BAIPred in NME model predictions. The
Figure 6: Fixed-Effects model curves (solid line) and Mixed-Effects model curves (dashed lines) for base age 25 and site indexes 10, 15, 20, 23.6, 30, 35 and 40.
Figure 7: Fixed-Effects model curves (solid lines) and Mixed-Effects model curves (dashed lines) for base age 5 and site indexes 3, 3.5, 4, 4.2, 4.5, 5 and 5.5.
the base age and site quality; and therefore, it failed to be MC. Figures 5, 6 and 7 illustrate the results of gen-erating NME model predictions for the assumed range of site qualities using the base ages 50, 25 and 5.
The smallest departure from expected prediction trends and from the height at the base age different from S was observed when the base age was high (Figure 5). For base age 50, the random curves were only slightly compressed toward the center mean curve. Only the global mean curve passes through S at base age; the other curves come very close to the height equal to S values at base age. In comparison, the NFE models pass throughS at the base age in all scenarios.
AsSbase age used for generating the curves decreases the compression of curves towards the mean and depar-ture from the height at base age equal toSgrows larger. For base age 25 (Figure 6) the random curves were no-ticeably more compressed toward the center mean curve than for base age 50. Only the global mean curve passes through the height at base age equal S; although the other curves still come quite close to S at base age. As
expected the NFE model passed throughS at base age and generated the same curve as Figure 5.
For base age 5, the NME model curves were strongly compressed toward the center mean curve (Figure 7) and had large deviations at the base age from the input S values. Only the global mean curve passes throughS at base age. As in all the other cases the NFE models pass at the base age throughS values for all sites.
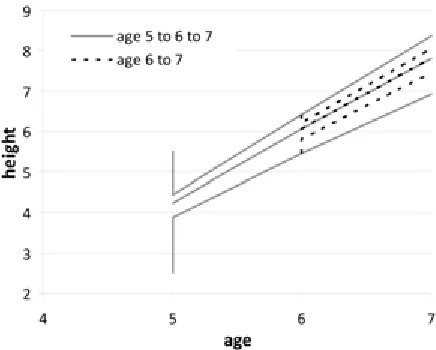
Using the model to simulate step predictions (Fig-ure 8), as is frequently used in forest management prac-tices, demonstrates that NME site model predictions fail to be PI in predictions for low and high sites; they are only PI at the global mean curve (the middle curve in Figure 8). The estimates for both high and low site qual-ity data are biased towards the mean, which means that they are systematically underestimated for high sites and systematically overestimated for low sites, failing PI for predictions outside the global mean site.
Figure 8: Base age 25 Mixed-Effect modelS parameter estimates used to project from age 5 to age 6 and 7, and from age 6 to age 7.
5
Discussion and Conclusion
limita-tions and justifying development of sound model forms (Kershaw et al. 2009). Overton (1998) compares both approaches and concludes that they both have prob-lems but that NME models can significantly overesti-mate variances when based on untenable assumptions. This is a peculiar finding because the assumptions about distributions of arbitrarily chosen nonlinear model pa-rameters are approximations at best (e.g., a distribu-tion of a value reaching from plus to minus infinity). Paulo et al. (2011) compared NFE and NME models for cork oak stands and noticed an overestimation of low diameter classes and underestimation of high diam-eter classes by the NME model. Still, the authors re-ported that overall the NME model performed better than the NFE model. Finally, Wang et al. (2008) failed to find any significant differences between the two types of model predictions applied to empirical data from pine after comparing both methods.
NME models are commonly advocated as robust and flexible. When compared against the NFE models the NME models are often claimed to be more flexible. Such claims are based on an ill founded assumption that the NME models can estimate more parameters as subject-specific. Indeed, some practitioners have fit NME site models specifying all of the model parameters as hav-ing random effects. Of course, the same can be done with respect to NFE models by defining all parameters as having subject specific fixed effects; although, such modeling just has not been found useful due to the lack of parsimony. Overall, the NFE modeling is by definition more flexible than the NME modeling approach since all the same functionalities such as different error structures (e.g., AR1, AR2, etc.) can be applied in either of the ap-proaches, but the NME approach has more restrictions imposed regarding the distributional properties of the site effects.
We have compared the properties of the two contem-porary approaches to self-referencing modeling in terms of the core well-behaved model criteria. To improve the quality of the predictions we used the TECH=None op-tion in SAS NLMIXED procedure to estimate height at the same ages, base ages and range ofS as in the case of the NFE model.
Our results reveal unexpected outcomes from the ap-plication of the NME modeling (not discussed in any earlier forestry literature on the subject). These out-comes throw a negative light on the interpretation and operational value of the NME modeling approach and confirm the well-behaved properties of the NFE mod-eling approach. In our analysis the NFE models were shown to have proper behavior regarding: BAIPar, MC,
and IUR in model fitting; and BAIPred, PI, lack of any
systematic deviations in model predictions, and logical behavior.
To the contrary, testing the NME modeling approach demonstrated that the NME model lacked all the above properties. The NME modeling approach appears to be base age variant similar to fixed base age site model pa-rameter estimates, varying with different selections of base ages used in the fitting process; the NME model parameter estimation resulted in inconsistent parame-ter estimates dependent on the model parameparame-terization. This means that while the NME model estimates should depend only on the data and statistical assumptions, in case of the NME models it also depends on how the same model might be written or codded, which is undesirable since the parameterization of nonlinear models is strictly arbitrary and frequently subject to convenience, tradi-tion, or coincident. The NME model predictions fail to be BAIPred, MC, PI, and IUR. In an environment of
it-erative simulations, the NME models produce different growth trajectories depending on a programmer or tech-nician choice of the length of iteration steps. While the predictions of the NME models have overall low vari-ance and small bias they systematically underestimate high sites and systematically overestimate low sites.
NME modeling is the state-of-the-art approach in the statistical theory, and it has many useful applications; however, self-referencing modeling is not one of them. From a theoretical point of view, NME models are not suitable for most forestry self-referencing modeling for various principal reasons in addition to lacking the well-behaved model properties. The data in forestry that are used for growth and yield self-referencing modeling are practically never random, but rather they are col-lected according to a model based design, typically with emphasis on uniform rather than random representation of sites and maximum practically achievable representa-tion of old ages. The other reason is that it is typical in forestry modeling to use various model parameteriza-tions of the same equaparameteriza-tions, which due to high nonlin-earity can be sometimes reparameterized even between different model fittings just to change the model parame-ter characparame-teristics or the search behaviour. Experienced modelers may explore such parameter transformations as for example p1 =⇒ ln(p2) =⇒ ep3 =⇒ p24 =⇒
1
p5, etc., to help with the model solutions to nonlinear
searches or the estimates’ characteristics.
In addition to BAIPar, MC, and IUR, the NFE
behavior, well-behaved model properties, and the uni-form unbiased representation of low and high sites.
Acknowledgements
We are grateful to two anonymous reviewers and Prof. Harold Burkhart, who served as Referees for this manuscript, for providing valuable comment that helped to improve the manuscript.
References
Adame, P., Canellas, I., Roig, S., & Del R´ıo, M. 2006. Modelling dominant height growth and site in-dex curves for rebollo oak (Quercus pyrenaicaWilld.). Ann. For. Sci. 63: 929–940.
Amaral, P.J., Tome, J., & Tome, M. 2011. Nonlinear fixed and random generalized height-diameter mod-els for Portuguese cork oak stands. Ann. For. Sci. 68: 295–309.
Bailey, R.L., & Clutter, J.L. 1974. Base-age-invariant polymorphic site curves. For. Sci. 20: 155–159.
Biging, G.S. 1985. Improved estimates of site index curves using a varying-parameter model. For. Sci. 31: 248–259.
Burkhart, H.E., & Tom´e, M., 2012. Modeling Forest Trees and Stands. Springer, Dordrecht, 457.
Calama R, & Montero, G. 2004. Interregional nonlin-ear height-diameter model with random coefficients for stone pine in Spain. Can. J. For. Res. 34: 150–163.
Calegario, N., Daniels, R.F., Maestri, R., & Neiva, R. 2005. Modeling dominant height growth based on non-linear Mixed-Effects model: a clonal Eucalyptus plan-tation case study. For. Ecol. Manag. 204: 11–20.
Cieszewski, C.J. 1994. Development of a variable den-sity height growth model through defining multidi-mensional height growth spaces. Ph.D. thesis, Uni-versity of Alberta, Edmonton, Canada.
Cieszewski, C.J. 2001. Three methods of deriving ad-vanced dynamic site equations demonstrated on in-land Douglas-fir site curves. Can. J. For. Res. 31(1): 165–173.
Cieszewski, C.J. 2002. Comparing fixed-and variable-base-age site equations having single versus multiple asymptotes. For. Sci. 48(1): 7–23.
Cieszewski, C.J. 2003. Developing a well-behaved dy-namic site equation using a modified Hossfeld iv func-tiony3= (axm)/(c+xm−1), a simplified Mixed-Model and scant subalpine fir data. For. Sci. 49(4): 539–554.
Cieszewski, C.J. & Bailey, R.L. 2000. Generalized Alge-braic Difference Approach: theory based derivation of dynamic site equations with polymorphism and vari-able asymptotes. For. Sci. 46(1): 116–126.
Cieszewski, C.J. & Bella, I.E. 1989. Polymorphic height & site index curves for lodgepole pine in Alberta. Can. J. For. Res. 19: 1151–1160.
Cieszewski, C.J., Harrison, W.M. & Martin, S.W. 2000. Examples of practical methods for unbiased param-eter estimation in self-referencing functions. In C.J. Cieszewski (ed.). Proceedings of the First Interna-tional Conference on Measurements and Quantitative Methods and Management and The 1999 Southern Mensurationists Meeting. D.B. Warnell School of For-est Resources, University of Georgia, Athens, GA. 207 p.
Cieszewski, C., Strub, M., Antony, F., Bettinger, P., Dahlen, J., & Lowe, R. (2013). Wood quality assess-ment of tree trunk from the tree branch sample and auxiliary data based on NIR spectroscopy and Sil-viScan. Math. Comput. For. Nat.-Res. Sci. (MCFNS) 5(1), 86–111 (26). Retrieved from http://mcfns.net-/index.php/Journal/article/view/155
Clutter, J.L., Fortson, J.C., Pienaar, L.V., Brister, G.H., & Bailey, R.L. 1983. Timber management: A quanti-tative approach. John Wiley & Sons, Inc. 333 p.
De los Santos-Posadas, H.M., Montero-Mata, M., & Kanninen, M. 2006. Dynamic dominant height growth curves for Terminalia amazonia (gmel.) Excell in Costa Rica. Agrociencia 40: 521–532.
Di´eguez-Aranda, U., Burkhart, H.E., Amateis, R.L. 2006a. Dynamic site model for loblolly pine (pinus
taeda l.) plantations in the United States. For. Sci.
52: 262–272.
Di´eguez-Aranda, U., Grandas-Arias, J.A., Alvarez-´ Gonz´alez, J.G., v. Gadow, K. 2006b. Site quality curves for birch stands in north-western Spain. Silva Fennica 40: 631–644.
Dorado F.C., Dieguez-Aranda, U., Anta, M.B., Rodr´ıguez, M.S., & v. Gadow, K. 2006. A generalized height-diameter model including random components for radiata pine plantations in northwestern Spain. For. Ecol. Manag. 229: 202–213.
Elfving, B., Kiviste, A. 1997. Construction of site index equations forPinus sylvestrisL. using permanent plot data in Sweden. For. Ecol. Manag. 98: 125–134.
Eriksson, H., Johanssen, U., & Kiviste, A. 1997. A site-index model for pure and mixed stands ofbetula
pen-dula and betula pubescens in Sweden. Scand. J. For.
Res. 12: 149–156.
Fang, Z., & Bailey, R.L. 2001. Nonlinear Mixed-Effects modeling for slash pine dominant height growth fol-lowing intensive silvicultural treatments. For. Sci. 47: 287–300.
Friesen, M.C., Demers, P.A., Davies, H.W., Teschke, K., & Marion, S. 2002. Determinants of dust exposure in sawmills: A comparison of Fixed-Effects and Mixed-Effects predictive statistical models. Epidemiology. 13: S231–S231.
Hall, D.B. & Bailey, R.L. 2001. Modeling and prediction of forest growth variables based on multilevel nonlin-ear Mixed Models. For. Sci. 47: 311–321.
Kershaw, J.A., Benjamin, J.G., & Weiskittel, A.R. 2009. Approaches for modeling vertical distribution of maxi-mum knot size in black spruce: a comparison of Fixed-and Mixed-Effects nonlinear models. For. Sci. 55: 230– 237.
Krumland, B., & Eng, H. 2005. Site index sys-tems for major young-growth forest and woodland species in northern California. California Forestry Report No. 4. California Department of Forestry and Fire Protection. Sacramento, CA. 219 p., found at: http://www.demoforests.net/Warehouse-/Docs/ForestryReports/ForestryReport4.pdf
Laird, N.M., & Ware, J.H. 1982. Random-Effects models for longitudinal data. Biometrics. 38: 963–974.
Lappi, J., & Bailey, R.L. 1988. A height prediction model with random stand and tree parameters: An alternative to traditional site index methods. For. Sci. 34: 907–927.
Lappi, J., & Malinen, J. 1994. Random-parameter height/age models when stand parameters and stand age are correlated. For. Sci. 40: 715–731.
Lee, S.Y., & Xu, L. 2004. Influence analyses of nonlin-ear Mixed-Effects models. Computational Statistics & Data Analysis. 45: 321–341.
Leites, L.P., & Robinson, A.P. 2004. Improving taper equations of loblolly pine with crown dimensions in a Mixed-Effects modeling framework. For. Sci. 50: 204– 212.
Lindstrom, M., & Bates, D. 1990. Nonlinear Mixed-Effects models for repeated measures data. Biomet-rics. 46: 673–687.
Meng, S.X., & Huang, S.M. 2009. Improved calibration of nonlinear Mixed-Effects models demonstrated on a height growth function. For. Sci. 55: 238–248.
Nord-Larsen, T. 2006. Developing dynamic site index curves for european beech (fagus sylvatica l.) in Den-mark. For. Sci. 52: 173–181.
Overton, R.C. 1998. A comparison of Fixed-Effects and mixed (Random-Effects) models for meta-analysis tests of moderator variable effects. Psychological Methods. 3: 354–379.
Patricia, A, Del R´ıo, M., & Isabel, C. 2008. A mixed non-linear height-diameter model for pyrenean oak (
Quer-cus pyrenaica Willd.). For. Ecol. Manag. 256(1–2):
88–98.
Paulo, J.A., Tome, J., & Tome, M.. 2011. Nonlinear fixed and random generalized height-diameter models for Portuguese cork oak stands. Ann. For. Sci. 68(2) pp.: 295309.
Ratkowsky, D.A. 1990. Handbook of nonlinear regres-sion models. Marcel Dekker, Inc., New York, NY. 241.
Raulier, F., Lambert, M.C., Pothier, D., & Ung, C.H., 2003. Impact of dominant tree dynamics on site index curves. For. Ecol. Manag. 184, 65–78.
Rivas, J.J.C., Gonz´alez, J.G. ´A., Gonz´alez, A.D.R., & v. Gadow, K. 2004. Compatible height and site in-dex models for five pine species in El Salto, Durango (Mexico). For. Ecol. Manag. 201: 145–160.
Rose, C.E., Cieszewski, C.J., & Carmean, W.H. 2003. Three methods for avoiding the impacts of incompat-ible site index and height prediction models demon-strated on jack pine curves for Ontario. For. Chron. 79: 928–935.
Saunders, M.R., & Wagner, R.G. 2008. Height-diameter models with random coefficients and site variables for tree species of Central Maine. Ann. For. Sci. 65: 203.
Schnute, J. 1981. A versatile growth model with statis-tically stable parameters. Can. J. Fish. Aquat. Sci. 38:1128–1140.
Schumacher, F.X. 1939. A new growth curve and its ap-plication to timber-yield studies. J. For. 37: 819–820.
Sharma, M., & Parton J. 2007. Height-diameter equa-tions for boreal tree species in Ontario using a Mixed-Effects modeling approach. For. Ecol. Manag. 249: 187–198.
Lee, S.Y., & Xu, L. 2004. Influence analyses of nonlin-ear Mixed-Effects models. Computational Statistics & Data Analysis 45 pp.: 321-341.
Strub, M. R., & Bredenkamp, B.V. 1985. Carrying ca-pacity and thinning response of Pinus taeda in the CCT experiments. South African For. J. 133: 6–11.
Tait, D.E., Cieszewski, C.J., & Bella, I.E. 1988. The stand dynamics of lodgepole pine. Can. J. For. Res. 18: 1255–1260.
Temesgen H., Monleon, V.J., & Hann, D.W. 2008. Anal-ysis and comparison of nonlinear tree height predic-tion strategies for Douglas-fir forests. Can. J. For. Res. 38: 553–565.
Trincado, G.V., Kiviste, A., & v. Gadow, K. 2003: Pre-liminary site index models for native Roble (
Nothofa-gus obliqua) and Rauli (N. alpina) in Chile. New
Zealand J. For. Sci. 32: 322–333.
Wang, M.L., Borders, B.E., & Zhao, D. 2008. An em-pirical comparison of two subject-specific approaches to dominant heights modeling: The dummy vari-able method and the mixed model method. For. Ecol. Manag. 255: 2659–2669.
Wang, Y., Lemay, V.M, & Baker, T.G. 2007. Mod-elling and prediction of dominant height and site index
of Eucalyptus globulus plantations using a nonlinear
Mixed-Effects model approach. Can. J. For. Res. 37: 1390–1403.