Volume-7 Issue-2
International Journal of Intellectual Advancements
and Research in Engineering Computations
Detection of land cover change using fuzzy segmentation algorithm
M.Ramya, R.Ramya, K.Sangeetha, V.Prakash, Dr. N.S.Nithya, Dr.E.Baby Anitha
Department of Computer Science and Engineering K.S.R College of Engineering (Tiruchencode)
ABSTRACT
Detection of Land cover changes like forest DETECTION OF LAND COVER CHANGE USING FUZZY SEGMENTATION ALGORITHM Department fire, flood and cultivation is the important criterion for farmers. This paper proposes a Land cover detection model using Fuzzy Local Mean clustering model (FLC). Fuzzy Local C-Mean clustering model method is implemented to process subsequences of time series data and detects land cover change temperature measured as a function of time. Land surface temperature is measured and declared when consecutive subsequences that are extracted from one Moderate Resolution Imaging Spectroradiometer (MODIS) time series transitions from one cluster to another cluster and remains in the newly assigned cluster for the rest of the time series. The temporal sliding window designed to operate on a subsequence of the time series to extract information from two spectral bands from the MODIS product.
Keywords
:
Land Cover Change, MODIS, Image Segmentation. Fuzzy Segmentation, Fuzzy Local C-Mean ClusteringINTRODUCTION
Digital image processing is the use of computer algorithms to perform image processing on digital images. As a subcategory or field of digital signal processing, digital image processing has many advantages over analog image processing. It allows a much wider range of algorithms to be applied to the input data and can avoid problems such as the build-up of noise and signal distortion during processing. Since images are defined over two dimensions (perhaps more) digital image processing may be modeled in the form of multidimensional systems.
Image segmentation is the process of partitioning a digital image into multiple segments (sets of pixels, also known as super-pixels). The goal of segmentation is to simplify and/or change the representation of an image into something that is more meaningful and easier to analyze. Image segmentation is typically used to locate objects and boundaries (lines, curves, etc.) in images. More precisely, image segmentation is the process of assigning a label to every pixel in an image such
that pixels with the same label share certain characteristics. The transformation of natural vegetation by practices such as deforestation, agricultural expansion, urbanization and natural disasters such as forest fires and floods has significant impacts on hydrology, ecosystems and climate. Coarse spatial resolution satellite data provide the regional, spatial, long-term and high temporal measurements for monitoring the earth surface.
be analyzed and processed for change detection. In addition, the Fuzzy C-Means approach is used to cluster the various types of sub image details. The method was evaluated on real and simulated land cover change examples and obtained more change detection accuracy.
LITRATURE SURVEY
J. Hansen et al [1] describe the Goddard Institute for Space Studies (GISS) analysis of global surface temperature change, compare alternative analyses, and address questions about perception and reality of global warming. Satellite-observed nightlights are used to identify measurement stations located in extreme darkness and adjust temperature trends of urban and peri-urban stations for non-climatic factors, verifying that urban effects on analyzed global change are small. Because the GISS analysis combines available sea surface temperature records with meteorological station measurements, we test alternative choices for the ocean data, showing that global temperature change is sensitive to estimated temperature change in polar regions where observations are limited.
Felix N. Kogan et al [2] describethe main goal of global agriculture and the grain sector is to feed 6 billion people. Frequent droughts causing grain shortages, economic disturbances, famine, and losses of life limit the ability to fulfill this goal. To mitigate drought consequences requires a sound early warning system. The National Oceanic and Atmospheric Administration (NOAA) has recently developed a new numerical method of drought detection and impact assessment from the NOAA operational environmental satellites. The method was tested during the past eight years, adjusted based on users‘ responses, validated against conventional data in 20 countries, including all major agricultural producers, and was accepted as a tool for the diagnosis of grain production. Now, drought can be detected 4–6 weeks earlier than before, outlined more accurately, and the impact on grain reduction can be predicted long in advance of harvest, which is most vital for global food security and trade. This paper addresses all these issues and also discusses ENSO impacts on agriculture.
Jose A. Sobrino et al [3] describe aSPECTRA (Surface Processes and Ecosystem Changes Through Response Analysis) is one of the core candidate missions which is being proposed for implementation in the European Space Agency (ESA) Earth Explorer program of research oriented missions. The scientific objective of the SPECTRA mission is to describe, understand, and model the role of terrestrial vegetation in the global carbon cycle and its response to climate variability under the increasing pressure of human activity. The SPECTRA satellite will embark an optical hyperspectral payload covering the solar spectral range (0.4 to 2.4 mm) and thermal infrared region (10.3 to 12.3 mm). This paper is focused on the land surface temperature retrieval from SPECTRA thermal infrared data. In the first part of the paper, generalized single-channel and split-window methods are discussed and compared, showing that single-channel methods provide similar or better results than split-window methods for low atmospheric water vapor content, whereas split-window methods always provide better results for high atmospheric water vapor content. In the second part of the paper, split-window and dual-angle algorithms have been developed for SPECTRA thermal channels.
boundary temperature, and the surface temperature into tractable subranges.
Juan C. Jimenez-Munoz et al [5] describe a algorithms to retrieve land surface temperature from at-sensor and land surface emissivity data. These algorithms have been specified for different thermal sensors on board satellites, i.e., the algorithm used for one thermal sensor (or a combination of thermal sensors) cannot be used for other thermal sensor. The main goal of this paper is to propose a generalized single-channel algorithm that only uses the total atmospheric water vapour content and the channel effective wavelength (assuming that emissivity is known), and can be applied to thermal sensors characterized with a FWHM (Full-Width Half-Maximum) of around 1 mm actually operative on board satellites. The main advantage of this algorithm compared with the other single channel methods is that in-situ radiosoundings or effective mean atmospheric temperature values are not needed, whereas the main advantage of this algorithm compared with split-window and dual-angle methods is that it can be applied to different thermal sensors using the same equation and coefficients
METHODOLOGIES
Thermal emissivity e is the efficiency with which a surface emits the stored heat as thermal infrared (TIR) radiation. It is useful to indicates the composition of the radiating surface and necessary as a control in atmospheric and energy-balance models, since it must be known along with brightness temperature to establish the heat content of the surface. The first practical demonstration of multispectral TIR imaging for compositional mapping was from a NASA airborne scanner flown over Utah. Emissivity differs from wavelength to wavelength, just as reflectivity r does in the spectral region of reflected sunlight (0.4–2.5 mm). Emissivity is defined as
Where L is the measured spectral radiance and B is the theoretical blackbody spectral radiance for a surface with a skin temperature T. B is given by Planck‘s law which, together with the basic physics of TIR radiative transfer, is discussed in the entry Land Cover Change. Unlike T, which is a variable property of a surface controlled by the heating history and not directly by composition, e(l) is independent of Land is a function directly of composition. Furthermore, e(l) in the TIR wavelengths(3–14 mm) responds to different aspects of composition than reflectivity r(l) at 0.4 – 2.5 mm. In general, r at wavelengths 0.4–2.5 mm is controlled by the amounts of iron oxides, chlorophyll, and water on the surface; e in the TIR is controlled more by the bond length of Si and O in silicate minerals.
TIR spectroscopy is especially important because silicate minerals are the building blocks of the geologic surface of Earth, and their presence and amounts can be inferred only indirectly at shorter wavelengths. Thus TIR spectroscopy is complementary to spectroscopy of reflected sunlight. Good summaries of TIR spectroscopy and its significance in terms of surface composition.
Daytime and nighttime false-color composite images of spectral radiance from a sparsely vegetated part of Death Valley, California, enhanced using a decor relation contrast stretch. This stretch emphasizes the emissivity component of the signal, shown as color, and de-emphasizes the temperature, shown as dark/light intensity. In addition to composition, the daytime image gives a good sense of topography, because sunlit slopes are warmer than shadowed slopes. In the nighttime image, most temperature effects are subdued, and the image closely resembles the Land Surface Emissivity (LSE) alone.
Land surface emissivity (LSE). Average emissivity of an element of the surface of the Earth calculated from measured radiance and land surface temperature (LST).
Atmospheric window. A spectral wavelength
region in which the atmosphere is nearly transparent, separated by wavelengths at which atmospheric gases absorb radiation.
Blackbody. An ideal material absorbing all incident energy or emitting all thermal energy possible. A cavity with a pinhole aperture approximates a blackbody.
Brightness temperature. The temperature of a blackbody that would give the radiance measured for a surface.
Color temperature. Temperature satisfying
Planck‘s law for spectral radiances measured at two different wavelengths.
Contrast stretch. Mathematical transform that adjusts the way in which acquired radiance data translate to the black/white dynamic range of the display monitor.
Emissivity e. The efficiency with which a surface radiates its thermal energy.
Irradiance. The power incident on a unit area, integrated over all directions (W m2).
Gray body. A material having constant but non-unity emissivity.
Thermal infrared (TIR). Thermal energy is
radiated from a body at frequencies or wavelengths in proportion to its temperature. The wavelengths for which this radiant energy. is significant for most terrestrial surfaces ( 1. 4– 14 mm) are longer than the wavelength of visible red light and hence are known as thermal infrared.
The TIR is subdivided into three ranges (LWIR, MIR, SWIR) for which the atmosphere is transparent (atmospheric ―windows‖) so that the energy can be measured from space.
MIR IMAGE
In principle, this problem can be removed by increasing the number of images acquired for the same scene. For each n-channel image, after atmospheric compensation, there are n + 1 unknowns, but only n measurements; for two images of the same scene, there are n + 2 unknowns, but 2n measurements (assuming LST has changed but LSE has remained constant). Therefore, a two-channel image taken at two different times is deterministic. It is additionally necessary that the LST be significantly different between acquisitions.
Two-time, two-channel approach If well-registered multispectral day–night radiance measurements are available, it is possible to determine T and e uniquely (Watson, 1992a). Although this approach is esthetic, for most TIR data, the recovered temperatures and emissivities tend to be imprecise. For example, for image channels at 8 and 12 mm, day–night temperatures
night algorithm to make a standard MODIS LST product.
Natural color.
MIR radiance at 9 mm. Brightness temperature.
Emissivity (RGB ¼ 8, 8.5 and 9 mm, respectively).
Emissivity spectra measured with the TELOPS.
SPECTRAL-SHAPE SOLUTIONS
Although it is not possible to invert the modified Planck equation for both e and T without external constraints, it is possible to estimate spectral shape for e, at the expense of Tand of the amplitude of the recovered spectrum, that is, the recovered spectra are essentially normalized, so that only relative amplitudes (wavelength to wavelength) are known. This is nevertheless useful, since composition is generally determined from spectral shape, and not the absolute amplitudes.
Observed that ratios of spectrally adjacent channels i and j described spectral shape accurately, provided that T could be estimated even roughly
To calculate the e ratios, it is necessary to approximate the temperature T from the measured radiances Li and Lj. If e can be estimated with in 0.075 , the uncertainty in T is 5 K, and the e ratios can be estimated with an average error of 0.007 (this estimate does not include the effects of measurement error). Becker and Li (1990) proposed a similar approach they called the ―temperature-independent spectral indices‖ (TISI) method. TISI begins with the observation (Slater, 1980) that Planck‘s law may be represented by
Where B is the spectral radiance in image channel k for a blackbody at temperature Ts and
To is a reference temperature. Constants nk and αk are given by
The land-leaving spectral radiance Lk, corrected for atmospheric absorption and path radiance but not down-welling spectral irradiance Lk.
Where Ck is spatially variable and atmosphere specific . The TISI is found by rationing spectral radiances for image channels i and j Here ai is defined as ni 1 (and aj ¼ nj1), chosen to make Equation 6 independent of T. Since for a wide range of temperatures the C ratio is close to unity, TISI is then.
The ratio spectra are insensitive to temperature, for normal terrestrial ranges. The approaches are adaptable for most sensors
.
ALPHA-RESIDUAL METHOD
Here c1 and c2 are the constants defined in Planck‘s law (Equation 1, Land Surface Temperature) and j is the image channel. Wien‘s approximation introduces a systematic error in e j of 1 % at 300 K and 10 mm wavelength. The next step is to calculate the means for the parameters of the linearized equation, summing over the n image channels:
The residual is calculated by subtracting the mean from the individual channel values. Collecting terms, a set of n equations is generated relating ei to Li, independent of T.
Note that ki contains only terms which do not include the measured spectral radiances, Li, and hence may be calculated from the constants. Although dependency on T has been eliminated, it has been replaced by the unknown ma, related to the mean emissivity, such that the total number of unknowns is unchanged. The components of the alpha-residual spectrum vary only with the measured radiances. They are defined as
Model approaches In this section, three algorithms distinguished by their model assumptions are described. The most specific requires that both a value ofe and the wavelength at which it occurs be known. The next requires only that the value be known. The third does not require the value of the emissivity to be known, only that the emissivity at two known wavelengths be the same The model emissivity (or reference channel) method assumes that the value of e for
one of the image channel‘s ref is constant and known a priori, reducing the number of unknowns to the number of measurements. First, the temperature is estimated using
Scaling approaches Once relative spectra have been calculated, they can be calibrated to ―absolute‖ emissivity provided a scaling factor is known. Applied to the ratio approach of this is basically the same as one of the model algorithms. However, scaling can also be done from empirical regression relating the shape of the emissivity spectrum to an absolute value at one wavelength. The regression is typically based on laboratory spectra of common scene components. More complex approaches also are possible: the first example given below combines the ―two-channel, two-time,‖ and TISI approaches to convert the relative TISI spectra to emissivities.
The hybrid TISI approaches requires first that daytime and nighttime MIR and LWIR images be acquired and co-registered and that their TISI ratios be calculated. Essentially, there are four measurements (LMIR, day, LLWIR, day, LMIR, night, and LLWIR, night), four unknowns (eMIR, eLWIR), and one model assumption (the solar irradiance on the target). The MIR reflectivity is the complement of eMIR by Kirchhoff‘s law using widely separated image channels improves the precision of T and e recovery.
ALPHA-DERIVED EMISSIVITY
(ADE) METHOD
zero and, of course, the mean is less than unity. In use, the mean is predicted from the variance, which is calculated from the measured radiances
EXPERIMENTAL RESULTS
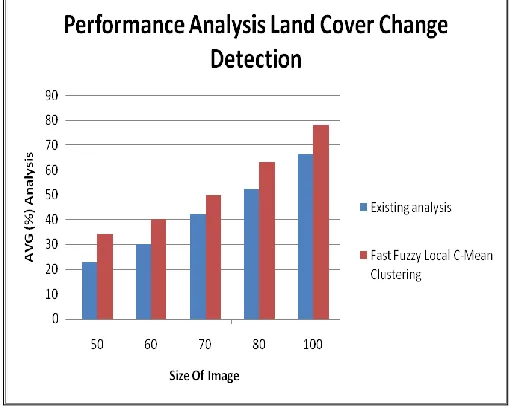
This table 5.1 shows the details of the image that is image taken from different locations or different area the size of the image in mega byte. The existing analysis and the proposed fuzzy automatic clustering are listed in this table.
Table 4.1 Area Wise Analysis Area wise image Size of
image in MB
Existing analysis
Fast Fuzzy Local C-Mean Clustering
Water area 55 23 34
Land area 62 30 40
Agriculture area 74 42 50
Industrial area 82 52 63
Populated area 95 66 78
The Fig 5.1 shows that area wise analysis Land Cover Change Detection Model. The figure
describes the Size of Image and Average Analysis for Land Cover Detection Process.
Fig 5.1 Area Wise Analysis
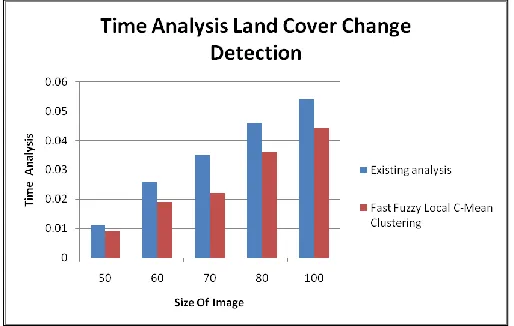
This table 5.2 shows the details of the image that is image taken from time to time that are represented in milliseconds. The existing analysis
and the proposed fuzzy automatic clustering are listed in this table with their time analysis.
Table 5.2 Land Cover Change Time Analysis
Area wise image Size of image in MB Existing analysis in m sec Fast Fuzzy Local C-Mean Clustering in m sec
Land area 62 0.026 0.019
Agriculture area 74 0.035 0.022
Industrial area 82 0.046 0.036
Populated area 95 0.054 0.044
The Fig 5.2 shows that area wise analysis Land Cover Change Detection Time analysis Model. The
figure describes the Size of Image and Time Analysis for Land Cover Detection Process.
Fig 5.2 Land Cover Change Time Analysis
CONCLUSION
The proposed system concentrate in finding the specified area problem by using the MODIS image in that a region of the place is selected and that is separated as the land and the water area and the temperature is been noted. On the basis of radiative transfer theory in the MIR region, a bidirectional reflectivity retrieval method was used to separate the reflected solar direct irradiance and the radiances emitted by the surface and atmosphere. A kernel-driven model was proposed to describe the non-Lambertian reflective behavior
of the land surface and to accordingly determine the directional emissivity if there were more than three bidirectional reflectance available with different angular configurations on several consecutive days. The results showed that the bias and RMSE between the LSTs retrieved from MODIS daytime MRI data and those calculated using in situ measurements, at the time of the MODIS images. The proposed method could be used to accurately retrieve LST from MODIS daytime MIR data.
REFERENCES
[1]. J. Hansen, R. Ruedy, M. Sato, and K. Lo, ―Global surface temperature change,‖Rev. Geophys.,.Art.no. RG4004, 48(4), 2010.
[2]. F. N. Kogan, ―Operational space technology for global vegetation assessment, ―Bull. 3 Amer. Meteorol. Soc., 82(9), 2001, 1949–1964.
[3]. J. A. Sobrino and J. C. Jiménez-Muñoz, ―Land surface temperature retrieval from thermal infrared data: An assessment in the context of the surface processes and ecosystem changes through response analysis (SPECTRA) mission,‖ J. Geophys. Res., 110, 2005, D16, Art.no. D16103.
[5]. J. C. Jiménez-Muñoz and J. A. Sobrino, ―A generalized single-channel method for retrieving land surface temperature from remote sensing data,‖ J. Geophys. Res., 8, D22, 2003, 4688–4695.
[6]. B.-H. Tang et al., ―Estimation and validation of land surface temperature from Chinese second generation polar-orbiting FY-3A VIRR data,‖ Remote Sens., 7(3), 2015, 3250–3273.
[7]. C. Gao, B.-H. Tang, H. Wu, X. Jiang, and Z.-L. Li, ―A generalized split window algorithm for land surface temperature estimation from MSG-2/SEVIRI data,‖ Int. J. Remote Sens, 34(12), 2013, 4182–4199.
[8]. Berk et al., ―MODTRAN cloud and multiple scattering upgrades with application to AVHRIS,‖Remote Sens. Environ., 65(3), 1998, 367–375.
[9]. Eduardo de Miguel, Elena Prado, Marcos Jiménez, Cristina Robles, ―Evaluating the Information Content of the AHS MIR Bands‖, Proceedings 5th EARSeL Workshop on Imaging Spectroscopy. Bruges, Belgium, 23-25, 2007.
[10].Alan Gillespie, ―Land Surface Emissivity‖, Encyclopedia of Remote Sensing, DOI 10.1007/978-0-387-36699-9, Springer Science+Business Media New York 2014.
[11].Lang Xia Kebiao Mao, Ying Ma, Fen Zhao, ―An Algorithm for Retrieving Land Surface Temperatures Using VIIRS Data in Combination with Multi-Sensors‖, Sensors; doi:10.3390/s141121385. 14, 2014, 21385-21408
[12].José A. Sobrino, Juan C et al, ―Land Surface Emissivity Retrieval From Different VNIR and TIR Sensors‖, IEEE Transactions on Geo-Science and Remote Sensing, 46(2), 2008.
[13].Li Fang, Yunyue Yu, Hui Xu, and Donglian Sun, ―New Retrieval Algorithm for Deriving Land Surface Temperature from Geostationary Orbiting Satellite Observations‖, IEEE Transactions on Geo-Science and Remote Sensing, 52(2), 2014.
[14].Xiaolei Yu, Xulin Guo and Zhaocong Wu, ―Land Surface Temperature Retrieval from Landsat 8 TIRS— Comparison between Radiative Transfer Equation-Based Method, Split Window Algorithm and Single Channel Method―,Remote Sens. 6, 2014, 9829- 9852; doi:10.3390/rs6109829.
[15].Ying Sun, ―Retrieval and Application of Land Surface Temperature‖, - geo.utexas.edu ,Term Paper, 2011. [16].Zhao-Liang Li, Ronglin Tang et al, ―A Review of Current Methodologies for Regional Evapotranspiration
Estimation from Remotely Sensed Data‖, Sensors 9, 2009, 3801– 3853.
[17].J. Hansen, R. Ruedy, M. Sato, and K. Lo, ―Global surface temperature change, ‖Rev. Geophys., Art. no. RG4004. 48(4), 2010.
[18].F. Sattari and M. Hashim, ―A Brief Review of Land Surface Temperature Retrieval Methods from Thermal Satellite Sensors‖, Middle-East Journal of Scientific Research 22 (5), 2014, 757-768.
[19].Zhengming Wan, ―Validation and Refinement of the MODIS Land-Surface Temperature Product‖, MODIS Science Team Meeting, 2011, 18-20.