www.nat-hazards-earth-syst-sci.net/8/1243/2008/ © Author(s) 2008. This work is distributed under the Creative Commons Attribution 3.0 License.
and Earth
System Sciences
The correlation of electrical charge with strain on stressed
rock samples
D. Triantis, C. Anastasiadis, and I. Stavrakas
Laboratory of electric properties of materials, Technological Educational Institution of Athens, Department of Electronics, 12210, Athens, Greece
Received: 3 July 2008 – Revised: 29 September 2008 – Accepted: 29 September 2008 – Published: 24 November 2008
Abstract. Laboratory experiments on rock samples have
shown electric signal emissions when the samples are sub-jected to temporal stress increase especially when the sam-ples approach failure. These electric signals are attributed to the generation and propagation of microcracks that guide the sample to mechanical failure.
In this work the temporal evolution of electric charge re-lease is studied for marble samples subjected to stress at a constant rate up to fracture and it is correlated to the respec-tive recordings of the yielded strain.
The results exhibit a systematic linear correlation between electric charge and deformation, with a constant proportion-ality factor independent of stress rate magnitude. This linear correlation, which is in accordance with the Moving Charged Dislocations (MCD) model, exists from the instant that the marble samples are driven to the non-linear region of me-chanical behaviour due to the applied stress, and more cisely to the Crack Propagation Zone (CPZ) up to the pre-failure phase.
1 Introduction
Laboratory investigations that show the existence of elec-tric signal emissions during a full cycle of rock deformation have received considerable attention in recent years. These electric emissions have been attributed to several potential sources like the existence of quartz (Nitsan, 1977; Ogawa et al., 1985; Eccles et al., 2005), fluid movement causing the electrokinetic effect (Eccles et al., 2005; Ishido and Mizu-tani, 1981; Yoshida et al., 1998), point defects (Varotsos and Alexopoulos, 1986) and electron emissions (Brady and Row-ell, 1986; Enomoto and Hashimoto, 1990).
Correspondence to: D. Triantis ([email protected])
When dealing with quartz-free rocks with extremely low internal moisture and low porosity, the piezoelectric and the electrokinetic effects are not considered as strong underly-ing physical mechanisms to support the existence of electric signal emissions. A model that is applicable for this case was proposed by Slifkin (1993) and was further developed by Vallianatos and Tzanis (1998), Tzanis and Vallianatos (2002) and explains electric signal emissions due to dislocation and other defect movements that cause local polarization. This model is known as Moving Charged Dislocations (MCD) model.
Papers of experimental laboratory recordings and analyses of electric signals emitted under temporally varying uniax-ial compressional stress upon rock samples like marble and amphibolite have been conducted (Anastasiadis et al., 2004, 2007a, b; Stavrakas et al., 2004; Triantis et al., 2007). The electric current emitted during such temporal stress variation leading to a catastrophic process and to sample fracture has been rendered under the term “Pressure Stimulated Current” (PSC). The technique applied in order to show up and record the above described signals is rendered under the term “PSC technique”. A statistical analysis of PSC time series obtained from calcite samples has recently been done by Vallianatos and Triantis (2008).
load cell
keithley 6514
Data Acquisition through Analogue to Digital sample
electrodes
strain gage
resistor bridge
Synchronize - Storage Data Acquisition
through GPIB
voltage amplifier
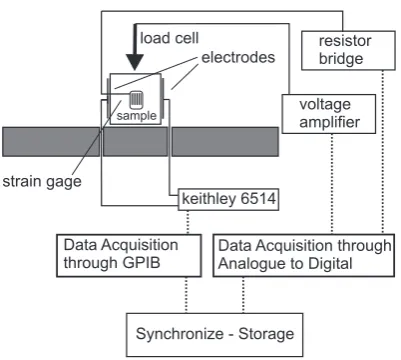
Fig. 1. A schematic representation of the experimental arrangement to conduct the measurements including both mechanical and elec-trical measurement systems.
et al., 2004), i.e.: PSC(t )∝ dε (t )
dt (1)
whereε(t )is the temporal variation of strain during the axial compressional variation of stressσ (t ). According to Eq. (1) the electrical chargeQ(t ), that is released in a time window
t=0 totis given by:
Q (t )= t Z
0
PSC(t )dt =0·ε (t ) (2)
where0is a scaling factor, that according to the MCD model formalism contains physical parameters of the material (Val-lianatos et al., 2004). t=0 is defined as the instant at which the pressure stimulated current is at a very low level just be-fore emerging from noise level.
This work intends to verify experimentally the proportion-ality described by Eq. (2) after a series of measurements based on the PSC technique, with simultaneous recordings of PSC, stress and strain.
2 Samples and experimental technique
The PSC technique was applied to a series of marble samples that were extracted from the same rock mass collected from Mount Penteli (Dionysos). The sam-ples were properly formulated to similar prisms measuring 35 mm×35 mm×60 mm and prepared for the experiments. The stress was applied through an axis parallel to the long edge. The physical and chemical properties of this kind of marble have already been presented in bibliography (Kourk-oulis et al., 1999; Kleftakis et al., 2000; Stavrakas et al., 2003). The specific characteristic of the samples is that they
0.003 0.0035 0.004 0.0045 0.005 0.0055
0.0 2.0 4.0 6.0 8.0 10.0
200 220 240 260 280 300
PSC
(pA) strain
t(s) (a) (b)
Fig. 2. The temporal development of the emitted PSC (curve a) and of deformation (curve b), while applying constantly increasing stress.
have very small quartz content (0.2%), while their principal content is calcite (98%). Systematic measurements of the strength of these samples have indicated that their fracture limit is in the range between 46 MPa and 55 MPa.
A description of the experimental arrangement for PSC measurements as well as of all measurement procedures has been thoroughly presented in the previous works (Stavrakas et al., 2003; Anastasiadis et al., 2004, 2007a). Figure 1 shows this experimental arrangement, equipped with a strain mea-suring device. The strain was measured using Kyowa strain gauges attached on the Microlink-770, 120resistor bridge.
3 Experimental results – discussion
The experimental results of the application of the PSC tech-nique on five marble samples will be presented here. In these experiments, the uniaxially applied compressional stressσ
increases linearly and the emitted PSC is recorded. The tem-poral development of stress can be described by:
σ =a·t (3)
where a is the stress rate. Att=tf=σmax/a, the sample fails,
whereσmaxis the ultimate compressional stress strength. The
only differing parameter in the experimental procedures of the five PSC recordings is stress rate.
30 32 34 36 38 40 42 44 46 48
0 50 100 150 200 250
0.0035 0.004 0.0045 0.005 0.0055 Eo = 16.2 GPa
slope =0.158µC
Q
(pC)
stress
(MPa)
strain (a) (b)
Fig. 3. Correlation of the released charge with respect to strain (curve a) and the stress-strain curve display (curve b).
compressional stress. In this case the following relationship holds between the applied stressσ (t )and the strainε(t ):
σ (t )=E0·ε(t ) (4)
whereE0is the Young’s modulus of the undamaged material,
which after calculation was found to be equal to 16.2 GPa. This weak electric signal comes from early crack genera-tions of low concentration within the bulk material. A con-siderable signal amplitude increase can be observed after 250 s when deformation gets values greater than 0.004, and its increasing rate is already evident. In this case, the ap-plied stress is greater than the “yield stress” (σy)the Young’s modulus gradually decreases and the material enters damage range. Also in this case a variable that quantifies the dam-age grade is introduced as “damdam-age variable”,α, (Turcotte and Shcherbakov, 2006) and is described by the following formula:
σ =σy+E0·(1−α)·(ε−εy) (5) whereεy=σy/E0. The damage variable varies between 0
and 1.
The above become more evident if we observe the de-picted parameters in Fig. 3. Curve a corresponds to the elec-trical charge Q(t ), calculated from the PSC(t ) recordings with the use of Eq. (2), and correlated with the correspond-ing strain values ε(t ). The stress-strain curve of the same sample is measured on a secondary axis (curve b). The lin-ear behaviour of the electrical charge with respect to strain appears for valuesε>0.004. Based on the stress-strain curve this value corresponds to a characteristic value of the strain
εy (εy=0.004), with a corresponding σy=39 MPa approxi-mately. Since the stressσ (t )exceeds the valueσy we can define the crack formation and propagation region (Lavrov, 2005). Due to the fact that PSC emissions are mainly at-tributed to crack formation and propagation it is expected
0.1 1.0 10.0
0.6 0.7 0.8 0.9 1.0
d c b
a
PSC
(pA)
relative stress
Fig. 4. PSC recordings a, b, c and d, for four marble samples each of them suffering uniaxial compressional stress at different con-stant rates up to fracture, 0.135 kPa/s, 0.159 kPa/s, 0.188 kPa/s and 0.196 kPa/s respectively, with respect to relative stress.
that when these mechanisms are activated, they dominate the sample bulk thus, PSC excitation is intense. Consequently, the electric charge starts increasing more intensely having a linear relationship with the continuously increasing strain. Thus, the theoretical prediction of Eq. (2) coming from the MCD model is experimentally verified.
The proportionality constant 0 has the value 0.158µC, which is characteristic for the material as will be obvious later. The linear relationship between electric charge and strain seems to be prevalent till the material approaches ad-equately the failure point. In this experiment the devia-tion from the linear law is observed when the applied stress reaches the value 46 MPa approximately. Having in mind that the sample failed at 47 MPa, this deviation from the linear law corresponds to a value of relative compressional stress (σˆNL)equal to 0.98 approximately. It is speculated
0 100 200 300
0.0030 0.0040 0.0050 0.0060 slope=0.150 µC
0 100 200 300
0.0030 0.0040 0.0050 0.0060 slope=0.165 µC
0 100 200 300
0.0030 0.0040 0.0050 0.0060 slope=0.158 µC
0 100 200 300
0.0030 0.0040 0.0050 0.0060 slope=0.159 µC
electric
charge
(pC)
electric
charge
(pC)
electric
charge
(pC)
electric
charge
(pC)
strain strain
strain strain
(a) (b)
(c) (d)
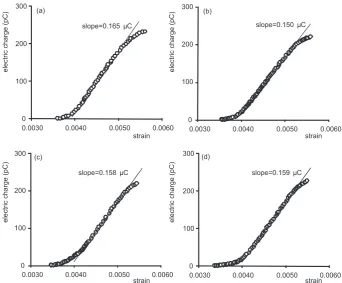
Fig. 5. Correlation of the electric charge Q(t) with the respective values of strainε(t )for the PSC recordings (a), (b), (c) and (d), depicted in Fig. 4.
Table 1. The experimental characteristics of the four representative samples and the experimental results for each sample.
sample PSC stress rate failure total electric charge 0(µC) σˆNL
code recording (kPa/s) (MPa) Qt (nC)
M01 Fig. 2 0.170 47.1 0.219 0.158 0.981
Curve a
M02 Fig. 4 0.135 50.3 0.233 0.165 0.964
Curve a
M03 Fig. 4 0.159 49.1 0.220 0.150 0.977
Curve b
M04 Fig. 4 0.188 52.9 0.219 0.158 0.988
Curve c
M05 Fig. 4 0.196 49.8 0.226 0.159 0.99
Curve d
2007a). All four PSC recordings seem to have a peak just before failure. Although each peak is different, the calcula-tions of the total released electric chargeQt (see Table 1), lead to the same value approximately. This fact verifies a previous theoretical and experimental notice (Triantis et al., 2007), that the total charge released during stress application up to fracture reaches almost the same values irrespectively of the stress rate.
Figure 5 shows the results of correlation of the electric charge Q(t ) with the corresponding values of strain ε(t ).
All four experiments confirm a linear law betweenQ(t )and
0.96 0.97 0.98 0.99 1.00
0.1 0.12 0.14 0.16 0.18 0.2 0.22
stress rate (MPa/s)
σNL
^
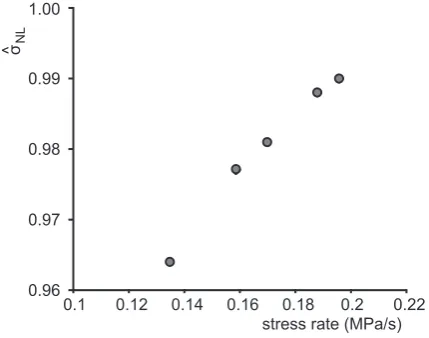
Fig. 6. The correlation between theσˆNLand the applied stress rate.
practically the sample shows meso-scopic fracture. As far as the scaling factor0 is concerned, values approximating 0.16µC were found, which are practically independent of the stress rate (see Table 1). Thus, the factor0can be con-sidered as a characteristic of the material.
The relative compressional stress (σˆNL), in which the
de-viations from the linear law take place, seems to be slightly differentiated (see Table 1). The experimental results indi-cate that when the rate of the applied uniaxial compressional stress increases, the deviation from the linear law takes place at greater values of relative stress (see Fig. 6). This correla-tion between theσˆNLand the stress rate must be related to the
fact that the lower the stress rate is, the longer the creep ef-fect holds and the consequent fracture plane formation lasts longer.
4 Concluding remarks
In this work a correlation is attempted between the electric signal emitted from marble samples during a stressing process (PSC technique) and the deformation of the samples. A linear relationship between the electric charge that is released during the described process and deformation begins to be observed when the applied stress exceeds the value of yield stress. This linear correlation remains till the sample approaches failure. The fact that in a series of experiments on the same material, with different stress rates, the scaling factor0is practically constant verifies the linear correlation between the Pressure Stimulated Current and the strain rate. The experimental verification of the above linear relationship seems to support the theoretical predictions of the moving charged dislocation (MCD) model that supports the existence of a proportionality between the electric current density and the strain rate providing a good interpretation of the underlying mechanisms of electric signal emission. Finally, a significant finding extracted
from this series of experiments is that when the material reaches failure a clear deviation from the linearity between the released charge and the strain is observed. Thus, such a non-linear behaviour can be used to predict the upcoming event of fracture.
Edited by: P. F. Biagi
Reviewed by: two anonymous referees
References
Anastasiadis, C., Triantis, D., Stavrakas, I., and Vallianatos, F.: Pressure stimulated currents (PSC) in marble samples after the application of various stress modes before fracture, Ann. Geo-phys., 47, 21–28, 2004,
http://www.ann-geophys.net/47/21/2004/.
Anastasiadis, C., Triantis, D., and Hogarth, C. A.: Comments on the phenomena underlying pressure stimulated currents (PSC) in dielectric rock materials, J. Mater. Sci., 42, 2538–2542, 2007a. Anastasiadis, C., Stavrakas, I., Triantis D., and Vallianatos F.:
Cor-relation of Pressure Stimulated Currents in rocks with the dam-age parameter, Ann. Geophys., 50, 1–6, 2007b,
http://www.ann-geophys.net/50/1/2007/.
Brady, B. T. and Rowell, G. A.: Laboratory investigation of the electrodynamics of rock fracture, Nature, 321, 448–492, 1986. Eccles, D., Sammonds, P. R., and Clint, O. C.: Laboratory studies of
electrical potential during rock failure, Int. J. Rock Mech. Min., 42, 933–949, 2005.
Enomoto, J. and Hashimoto, H.: Emission of charged particles from indentation fracture of rocks, Nature, 346, 641–643, 1990. Ishido, T. and Mizutani, H.: Experimental and theoretical basis of
electrokinetic phenomena in rock-water systems and its applica-tions to geophysics, J. Geophys. Res., 86, 1763–1775, 1981. Kleftakis, S., Agioutantis, Z., and Stiakakis, C.: Numerical
Simu-lation of the uniaxial compression test including the specimen-platen interaction, Computational methods for shell and spatial structures, IASS-IACM, 2000.
Kourkoulis, S. K., Exadaktylos, G. E., and Vardoulakis, I.: U-notched Dionysos-Pentelicon marble beams in three point bend-ing: The effect of nonlinearity, anisotropy and microstructure, Int. J. Fracture, 98, 369–392,1999.
Lavrov, A.: Fracture-induced Physical Phenomena and memory Ef-fects in Rocks: A Review, Strain, 41, 135–149, 2005.
Nitsan, U.: Electromagnetic emission accompanying fracture of quartz-hearing rocks, Geophys. Res. Lett., 4, 333–337, 1977. Ogawa, T., Oike, K., and Mirura, T.: Electromagnetic radiations
from rocks, J. Geophys. Res., 90, 6245–6249, 1985.
Slifkin, L.: Seismic electric signals from displacement of charged dislocations, Tectonophysics, 224, 149–152, 1993.
Stavrakas, I., Anastasiadis, C., Triantis, D., and Vallianatos, F.: Piezo stimulated currents in marble samples: precursory and concurrent-with-failure signals, Nat. Hazards Earth Syst. Sci., 3, 243–247, 2003,
http://www.nat-hazards-earth-syst-sci.net/3/243/2003/.
proper-ties, Nat. Hazards Earth Syst. Sci., 4, 563–567, 2004, http://www.nat-hazards-earth-syst-sci.net/4/563/2004/.
Triantis, D., Stavrakas, I., Anastasiadis, C., Kyriazopoulos, A., and Vallianatos, F.: An analysis of Pressure Stimulated Currents (PSC), in marble samples under mechanical stress, Phys. Chem. Earth, 31, 234–239, 2006.
Triantis, D., Anastasiadis, C., Vallianatos, F., Kyriazis, P., and Nover, G.: Electric signal emissions during repeated abrupt uniaxial compressional stress steps in amphibolite from KTB drilling, Nat. Hazards Earth Syst. Sci., 7, 149–154, 2007, http://www.nat-hazards-earth-syst-sci.net/7/149/2007/.
Turcotte, D. L. and Shcherbakov, R.: Can damage mechanics ex-plain temporal scaling laws, in: brittle fracture and seismicity?, Pure Appl. Phys., 163, 1031–1045, 2006.
Tzanis, A. and Vallianatos, F.: A physical model of electrical earthquake precursors due to crack propagation and the mo-tion of charged edge dislocamo-tions, in: Seismo Electromagnet-ics: Lithosphere-Atmosphere-Ionosphere Coupling, edited by: Hayakawa, M. and Molchanov, O. A., TERRAPUB, Tokyo, 117– 130, 2002.
Vallianatos, F. and Tzanis, A.: Electric current generation associ-ated with the deformation rate of a solid: Preseismic and coseis-mic signals, Phys. Chem. Earth, 23, 933–938, 1998.
Vallianatos, F., Triantis, D., Tzanis, A., Anastasiadis, C., and Stavrakas, I.: Electric Earthquake Precursors: From Laboratory Results to Field Observations, Phys. Chem. Earth, 29, 339–351, 2004.
Vallianatos, F. and Triantis, D.: Scaling in Pressure Stimulated Cur-rents related with rock fracture, Physica A: Statistical Mechanics and its Applications, 387(19–20), 4940–4946, 2008.
Varotsos, P. and Alexopoulos, K.: Thermodynamics of point defects and their relation with bulk properties, North-Holland, Amster-dam, 403–406, 1986.