592 | P a g e
REDUCED REDUNDANT DATA IN THE WIRELESS
SENSOR NETWORK USING PARTICLE SWARM
OPTIMIZATION
Amit Kumar Mishra
1, Dr. Dhanpratap Singh
2, Ms. Kirti Jain
1
Research Scholar, I.T, Banasthali Vidyapeeth, Tonk, Rajasthan, (India)
2,3
Associate Professor, I.T; L.N.C.T., Bhopal (India)
ABSTRACT
The energy constraints in the wireless sensor network are under too much consideration. Since WSN is based on
relay system and therefore each node is participates in complete communication process either a source,
forwarding nodes or as a receiver. This paper contributes a technique which reduced the data in the sensor
network by optimally selection of sensor nodes. The simulation is performed by taking different scenarios on the
Network Simulator. It is observed that it is better energy saving method as compared to LEACH and
LEACH-PSO.
Keywords: Wireless sensor Network (WSN), TDMA, SDMA
I. INTRODUCTION
A wireless sensor network consists of tiny nodes operated on low power battery. These nodes are having
following task to perform, such as sensing, network establishment and propagating the information. Sensing
activity performed through acquiring data from the environment such as humidity, temperature, pressure,
vibration, seismic events etc. After that it processed the data. Finally it transmits it to the sink node directly or
via some intermediate nodes. For the whole operation it requires power, due to the small structure of sensor
nodes, the energy is much precious thing in the sensor nodes. There is much concern over Battery utilization in
the sensor nodes having very little backup. So question is how we preserve the energy in sensor nodes?
Many researchers have been under gone from the past and some extremely use full technology come out.
Among these technologies we will discuss some important one. Power scavenging is one of the important
aspects of gaining energy from the environment rather than saving, but our motive is to save energy. Taking
sensor model shown in figure (1) where Data transmission through multi-hop [1] communication technique in
which consist of source field (sensing region having large number of sensor nodes), Sink (data terminating
node).
593 | P a g e
The whole system of wireless sensor network focuses on the two major areas for preserving energy which arenetworking sub system and sensing sub system. For the network sub system, nodes are engaged in management
of routes, links, sending and receiving of data. For the sensing subsystem nodes generally reduce the amount of
energy expansive samples.
This paper has primarily concern over energy conservation in network sub system although both systems are
jointly made effect in it. Since most energy is consumed by nodes components such as radio, converters,
equipments for filtering and further processing therefore power management is done by switching off some
nodes in case of ideal node.
II. SENSOR NODE ARCHITECTURE
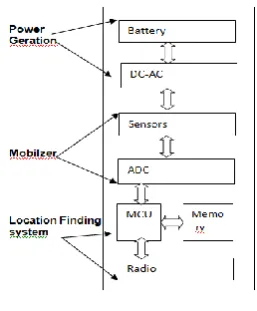
First of all we will understand the architecture of sensor nodes with diagram shown below in figure (2). As it is
very clear that the node consist of following three parts which are power generator having battery and AC-DC,
mobilize consist of sensors and ADC which is sensing sub system and third is location finding system which is
combination of two sub systems- processing sub system and communication sub system. These all sub systems
are responsible for energy consumption but communication sub system has significant role. If node has nothing
to send then communication system put it on the off mode. To achieve this, two important techniques are
explored such as Adaptive duty cycle and wake up on demand. We will further describe them in our literature.
Fig: 2 Architecture of wireless sensor node
Sensing sub system is also more or less responsible for energy consumption. This can be done by making them
application specific; this will reduce the energy consumption to a certain mark.
III. RELATED WORKS
Various protocols are developed for the conservation of energy in three different groups of techniques namely
duty cycling, Data driven approach and Mobile data collection. All these groups are further divided into many
sub groups explained with one of the research paper of each.
These protocols are based on redundancy of nodes in the field area therefore it is very important to concentrate
over deployment of nodes. Many researches have been taken place in this area and issues have come out such as
self organization of nodes, communication among nodes, localization, formation of clusters, random versus
structured topology etc. According to the topological control, nodes dynamically take decision based on
application requirements while minimizing the number of active nodes. There are various ideas through which
594 | P a g e
deactivated, based on the location of nodes and connectivity driven protocols suggest the quality of connectionand involvement of nodes.
Location Driven category of protocols generally belongs to the identification of position of sensor nodes in field
area and normally maps the planning over these deployed nodes so that only those nodes are participated in
communication which obeys some criteria and Geography Adaptive Fidelity GAF [2]. The sensing field is
divided in to virtual grids and the nodes are distributed in these grids are capable to communicate equivalently.
Only one node is active at a time therefore remaining nodes have to coordinate themselves whether to sleep or
remain active.
The nodes start with the discovery phase and reached to active state. They rebroadcast the discover messages
again and again unless its coordinator is not received. After getting message, nodes reached to the sleep mode.
Nodes in the sleeping mode wakeup after some time and again start sending discovery messages as shown in
figure (3). Here Td and Ta are time duration for discovery and active phase of nodes respectively.
Fig: 3 Transition diagram of GAF states
In the GAF protocol, the rank based election algorithm is run which help to find out the leader among the nodes
present in the grid to perform the task of communication. With the GAF any routing protocol is used and
performance is improved in the proportion of redundancy of nodes. This election algorithm repeats itself after
fixed duration. The leader is chosen based on some criteria such as residual energy of the nodes. GAF keep the
fidelity of network rehabilitees constant while adapting node behavior and extend network lifetime. GAF uses
location information to associate with virtual grid where all the nodes are equivalent to forward the packets and
the nodes present in the same grid coordinate and decide that who will sleep and for how long time the load will
balance in the network. In the figure (4) we have shown that the size of virtual grid. Even if the location of the
sensor nodes is available, it is not clear that we can select equivalent nodes for communication. If there is more
than one node for showing equivalency than only one of them is communicated and rest of them go to sleep. To
solve the problem of getting equivalent nodes virtual grids are assumed and the size of virtual grid is square of
distance r calculated as shown below:
or
Where R is range of sensor node and r is side of virtual grid.
595 | P a g e
GAF is affected by correlated error because it cares only for the node position. So it requires to robust against it.GAF should also robust against the inaccurate position information of nodes. There is one major setback of
GAF against uncorrelated error.
According to Geography Informed random forwarding technique GeRaF [3], featured around geographical
location of the nodes involved and random selection of the relaying node via contention among receivers. Each
node which participates in communication has to send packet in the active state. These packets contain its
location and receiver location. Node which is neighbor of a particular node can relay the packet if they are
selected for sending data. For the selection of relaying node, priority is given to that node which is close to the
destination. A distributed randomization is used to make further division of the area near to the destination and
provide prioritization among them so that we can reduce the number of sleeping nodes simultaneously. Since the
GeRaF is based on the information of position therefore relaying nodes selection is done before transmission.
The location algorithm has certain limitations which are overcome by next category called connectivity driven.
This category deals with clustered based energy conservation algorithm. The limitation of location based
algorithm is that, they require some fundamental techniques such as GPS to locate the node but it does not work
in the bad weather, indoors and shaded places. GAF runs on the conservative connectivity connection without
knowing the strength of radio signals. Because of this conservative approach more number of nodes need to stay
awake and therefore more energy is required so our aim of conserving energy is not reached satisfactorily.
So here this Cluster based energy conservation schemes like SPAN [4] and S-MAC [5], directly measure the
network connectivity and take decision dynamically for reduction of redundant connection.
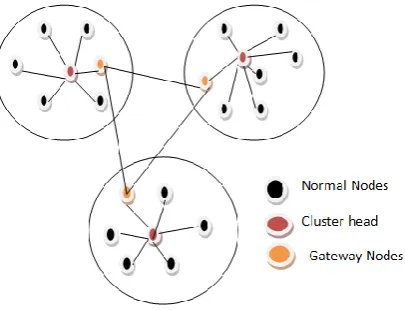
Fig: 5 General View of Cluster formation
In the figure (5) we have shown the formation of clusters. It is necessary to identify the nodes for the cluster.
This is done by keeping only those nodes which are at-most 2 hopes away mutually. Cluster head and gateway
nodes are elected using certain criteria such as longest life time. The criterion used for the selection of gateway
node is that the greater number of cluster heads should be close to the node. With control of duty cycle of cluster
nodes, the algorithm is used to observe dynamically the nodes energy level and decide which will be the next
cluster head. While cluster head is working, rest of the nodes are in sleep mode and save energy. After Ts
duration the wake up and algorithm for election reruns. The Ts is basically estimated as the life time of nodes.
According to SPAN eligibility rule to become coordinator node, two nodes should not reach each other either
directly or via one or more coordinator. For keeping number of redundant nodes minimum, all the nodes delay
596 | P a g e
depends on two factors one is remaining energy of the node and other is number of nodes that it can connect.Hello message is used for the announcement of coordinator when the nodes observe that weather there is already
any coordinator present or they may become a coordinator. If there is no single node as coordinator then all the
nodes which are contented for coordinator are delayed by random amount of time that is
Where = number of neighbors for node I,
= amount of energy at node,
= Maximum available energy available at the same node,
= number of additional pairs of nodes among these neighbors that would connect if they were to become a
coordinator,
T= round trip delay for small packet over wireless link and
R= Random value from (0 1]
Coordinator may withdraw itself after declare as tentative node for withdrawal and stay for a time which is
calculated as.
Where Wt is maximum value of time in which coordinator gives chance to its neighbors to become coordinator.
Coordinator election process consist of advertisement of Hello messages and further theses messages contain
information such as coordinator, tentative coordinator, neighbor nodes etc. and for the reeducation of protocol
overhead, piggybacking on Hello message is used. In the protocol SPAN, there is void near the destination in
absence of coordinator nodes and packets have no routes to destination and they are accustomed to drop.
III. MAC PROTOCOLS WITH LOW DUTY CYCLE
Hybrid MAC Protocol
This is also a category of the MAC protocols, in the paper [13] intelligent hybrid MAC (IHMAC) by
Mohammad Arifuzzaman, Mitsuji Matsumoto, Takuro Sato perform well in high traffic load with improved
channel utilization without compromising energy efficiency; it combines features of CSMA, broadcast
scheduling and link scheduling. It uses broadcast scheduling and link scheduling dynamically according to
traffic conditions. IHMAC protocol classifies the packet according to requirements delay and they are queued
with priority specified by application layer. Sync packets are used for synchronizing schedule among the nodes
which are neighbor to it in the same virtual cluster. The concept of synchronization schedule which is similar to
SMAC but difference is in the use of virtual clustering in which all the nodes follows the same schedule
therefore all the nodes in the network are not required to have same schedule.
Slot frame as shown in figure (6)is assigned by keeping priority to the node which has critical data and if there
is no such type of node than this opportunity goes to the owner of slot. Owner is decided by clock arithmetic. In
case of multiple values through the calculation there is competition among different owners for medium access.
Here another type of slot known as rendezvous is used by node to send messages to their neighbors. This slot is
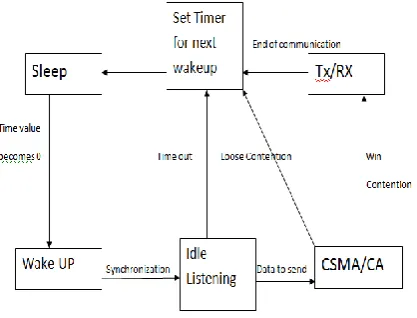
calculated on the basis of system requirements such as network delay, load etc. The state diagram IHMAC is
597 | P a g e
and listen the channel. If node has data to send than it goes to CSMA/CA state and compete for channel access.If it loses the contention then it goes to sleep state after setting the time for the next wakeup period.
Fig 6: Random slot frame for IHMAC protocol
Parallel communication is also used within two hope network since collision occurs at receiver end. It helps the
sender to send data to both the nodes which are in transmission and not in transmission range. It also sends data
to those which are not coming into the range of other sender transmission. For the parallel transmission IHMAC
uses the NAV concept of
Fig 7: State diagram of IHMAC protocol
IEEE 802.11, which block the sender for time period mentioned in NAV(network allocation vector), but in this
protocol blocking is only done after looking for the possibility of parallel communication. For the data queued
in the buffer, node convert some of its owned slot in to rendezvous slots and informed the neighbors about
number of slots used. It also specifies the communicating nodes identity so that all the nodes should keep their
radio in sleep mode.
IHMAC also save the power of nodes by adjusting the transmission power dynamically using following
calculation:
Where = the power which is adjusted using power received
Pr = power received from receiver at the transmitter side
= Maximum power for transmission = minimum signal strength necessary for the proper
communication
C = constant.
For the Data transmission three different priorities are followed which are critical data, owner and non owner
data in decreasing order. Three types of power are used for sending packets such as SYNC, RTS, CTS, DATA
and ACK in following manner
1. ETX (Max)is the maximum energy used to send RTS packet at transmitting end and CTS at receiving end in
598 | P a g e
2. ETX (Calc) is the calculated energy for sending SYNC, Data packets at transmitting end and ACK packets atreceiving end in link and broadcast scheduling mode both.
3. ERX is the receiving energy used when CTS, ACK are received in broadcast scheduling, ACK in link
scheduling mode at transmitting end and SYNC, RTS and DATA packets at receiving end in link and
broadcast scheduling mode both .
As compared to SMAC, IHMAC is use energy more efficiently. When comparing to other protocols such as
TMAC, QMAC the IHMAC overshadow all of them in heavy traffic condition but in light traffic condition
IHMAC performance is degraded and it becomes same as above three protocols.
IV. PROPOSED METHOD
Optimization can be applied for any problem related to maximization or minimization of the objective function.
There are many optimization methods explained in the chapter Modern Optimization Technique, example
Simulated Annealing Algorithm, Tabu Search Algorithm, Genetic algorithm, Particle Swarm Optimization and
Minimum norm theorem. Among these techniques PSO [6] is chosen for this work. PSO is bio-inspired
algorithm based on movement pattern and behavior of bird folk. This method avoid converges quickly to
generate result and stick to the local minima.
The algorithm is shown below:
1.All nodes broad cast their location, residual energy and queue length information to the base station.
2.Base station decides the cluster head using parameters declared and simulated annealing optimization method
as in LEACH [7].
3.Cluster head now responsible for TDMA[9] scheduling which is performed by PSO.
4.Selected nodes are scheduled to transmit data to the cluster head and rest of the time they remain in sleep
mode.
5.Cluster head fuse the data and forwarded to the base station.
6.Non selected nodes also remain in the sleep mode.
7.This process is continues until next cluster head is not selected for the cluster.
V. RESULT ANALYSIS
Simulation is performed by varying the number of nodes to observe the effect of traffic in the network. The
table 1 show contains the simulation environment and configuration parameters.
Table 1: Simulation Environment
Simulation Scenario Simulation 1
Simulation area(m2) 100
Transmission Range(m) 100
Initial nodes Energy (J) 2
Number of nodes 10,20,30,40,50
It is observed that proposed method enhance the lifetime of the WSN effectively when life of the network is
measured with half of the sensor nodes remain alive. The following observation are noticed and explained in
figures (8-12). Three groups of weights are associated with parameters and rigorous simulations are performed
599 | P a g e
Figure 8: Nodes Alive during Simulation
According to the results shown in the figure (8), Nodes are varying by keeping initial energy of node 2 joules
and simulation field area of 100 m2. It is observed that the LEACH-C protocol first node died at simulated time
240 second, in LEACH-PSO it is at 1300 simulated seconds. On comparing LEACH-C and LEACH-PSO an
average 81% of lifetime of network with respect to LEACH-PSO is less in LEACH-C. This is because
optimization method reduces the redundant data in the network by applying the active
Figure 9: Energy Consumption by varying number of Nodes (Joules)
600 | P a g e
nodes selection procedure. PSO method delays the first node dying event by giving chance uniformly to everypotential node for data transmission. After the death of first node, both the protocols show unstable region of the
graph where all nodes are dying one by one. Even in unstable region PSO keeps nodes alive for longer duration
which is approved with slacked slop of the graph. Increasing number of nodes in the network will increase the
lifetime of the network is shown in the Figure (9). The performance of LEACH-C protocol increases with the
increasing number of nodes in the network because many candidates node are available for optimization method
which selects cluster head. LEACH-PSO protocols show performance improvement with the increasing number
of nodes and therefore increasing the number of potential source nodes. PSO optimizes the source nodes for data
transmission which has many candidate nodes in the network.
According to graph shown in the Figure (10), total energy consumption by nodes is measured when 50% nodes
were alive. In LEACH-C energy consumption is lower than LEACH-PSO because 50% nodes are alive for
longer duration in LEACH-PSO than LEACH-C. During simulation, the contribution of consumed energy from
each node is greater in LEACH-PSO than LEACH-C protocol because LEACH-PSO properly distributes the
load among the sensor nodes without sacrificing any of the nodes too early. Proposed Algorithm properly
utilizes nodes for data transmission task by selection process based on weighted sum of the parameters and PSO.
It is observed from the graph in Figure (11) that increasing number of nodes in the network will increase the
total data in the network during complete lifetime. About an average 74% data is reduced in LEACH-PSO with
respect to LEACH-C by varying the number of nodes. Comparing with the LEACH-C, data traffic increases
sluggishly in LEACH-PSO with the increasing nodes because optimization method reduces the number of active
nodes in the network and hence reduces the redundant data in the network.
VI. CONCLUSION
The performance of the researched work is evaluated using three measures namely total data transmitted by the
nodes, total energy consumption by the nodes and lifetime of the network. The measurement is applied for the
three scenarios such as variable density i.e. number of nodes, variable initial energy of the nodes and variable
simulation field area. Increasing number of nodes will increase the data traffic in the network which increases
overall energy consumption of the network shown in the results. Increase in initial energy of the nodes will
increase the life of the network as lifetime is directly proportional to the residual energy of the nodes while
601 | P a g e
larger will be the required power for data transmission. Rate of energy consumption is high during long distancecommunication therefore nodes die quickly which results into shorter life of the sensor network.
REFERENCE
[1] I.F. Akyildiz, W. Su, Y. Sankarasubramaniam, E. Cayirci, Wireless sensor networks: a survey, Computer
Networks 38 (4) (2002).
[2] Y. Xu, J. Heidemann, D. Estrin, Geography-informed energy conservation for ad hoc, in: Proc. ACM
MobiCom, 2001, Rome, 2001, pp. 70–84.Wei Ye, John Heidemann, and Deborah Estrin. An
energy-efficient mac protocol for wireless sensor networks. In Proceedings of the IEEE Infocom, pages 1567–
1576, New York, NY, June 2002. IEEE.
[3] M. Zorzi, R.R. Rao, Geographic random forwarding (GeRaF) for ad-hoc and sensor networks: multi-hop
performance, IEEE Transactions Mobile Computing 2 (4) (2003) 337 IEEE Jornals.
[4] BENJIE CHEN, KYLE JAMIESON, HARI BALAKRISHNAN and ROBERT MORRIS “Span: An
Energy-Efficient Coordination Algorithm for Topology Maintenance in Ad Hoc Wireless Networks”
Wireless Networks Journals Vol:8 Issu:5, 481–494, 2002 Kluwer Academic Publishers. Manufactured in
the Nether-lands.
[5] W. Ye. J. Heidemann, and D. Estrin, “Medium access control with coordinated adaptive sleeping for
wireless sensor networks,” in Proc. IEEE/ACM Trans. Networks., vol. 12, no. 3, pp. 493–506, Jun. 2004
IEEE Journals.
[6] Energy-aware clustering for wireless sensor networks using particle swarm optimization. N. Latiff, C.
Tsimenidis, and B. Sharif. s.l. : IEEE, 2007. IEEE 18th International Symposium on Personal, Indoor and
Mobile Radio Communications (PIMR C’07). pp. 1–5.
[7] An Application-Specific Protocol Architecture for Wireless Microsensor Networks. Wendi B.
Heinzelman, Anantha P. Chandrakasan, and Hari Balakrishnan. 2002, 660 IEEE TRANSACTIONS ON
WIRELESS COMMUNICATIONS, pp. 660-670.
[8] CCA-Embedded TDMA enabling acyclic traffic in industrial wireless sensor networks. D. Yang, M.
Gidlund, W. Shen, Y. Xu, T. Zhang. 2012, Ad hoc networks.
[9] Mohammad Arifuzzaman, Mitsuji Matsumoto, Takuro Sato” An Intelligent Hybrid MAC with
Traffic-Differentiation-Based QoS for Wireless Sensor Networks” IEEE SENSORS JOURNAL, VOL. 13, NO.