R E S E A R C H
Open Access
The nuclear network: multiplex network
analysis for interconnected systems
Bethany L. Goldblum
1*, Andrew W. Reddie
2, Thomas C. Hickey
1, James E. Bevins
1,3,
Sarah Laderman
1, Nathaniel Mahowald
1, Austin P. Wright
1, Elie Katzenson
1and Yara Mubarak
1*Correspondence: [email protected]
1Department of Nuclear
Engineering, University of California, Berkeley, 2150 Shattuck Ave, Suite 230, 94704 Berkeley, CA, USA Full list of author information is available at the end of the article
Abstract
States facing the decision to develop a nuclear weapons program do so within a broader context of their relationships with other countries. How these diplomatic, economic, and strategic relationships impact proliferation decisions, however, remains under-specified. Adding to the existing empirical literature that attempts to model state proliferation decisions, this article introduces the first quantitative heterogeneous network analysis of how networks of conflict, alliances, trade, and nuclear cooperation interact to spur or deter nuclear proliferation. Using a multiplex network model, we conceptualize states as nodes linked by different modes of interaction represented on individual network layers. Node strength is used to quantify factors correlated with nuclear proliferation and these are combined in a weighted sum across layers to provide a metric characterizing the proliferation behavior of the state. This multiplex network modeling approach provides a means for identifying states with the highest relative likelihood of proliferation—based only on their relationships to other states. This work demonstrates that latent conflict and nuclear cooperation are positively correlated with proliferation, while an increased trade dependence suggests a
decreased proliferation likelihood. A case study on Iran’s controversial nuclear program and past nuclear activity is also provided. These findings have clear, policy-relevant conclusions related to alliance posture, sanctions policy, and nuclear assistance.
Keywords: Network science, Multiplex modeling, Nuclear proliferation
Introduction
The puzzle of nuclear proliferation—why states decide to acquire nuclear weapons—has long been a central question for scholars of international security and has contributed to both theoretical and empirical studies with a view towards designing policies to pre-vent the spread of nuclear weapons (Singh and Way2004; Kaplow and Gartzke2016). Much has been made of the appropriateness of the U.S. withdrawal from the Joint Com-prehensive Plan of Action (JCPOA) and its potential consequences for Iran’s decision to pursue nuclear weapons (Sherman2018). But what of the broader forces that drive a state’s decision to pursue nuclear weapons in the first place? Although much has been learned using observational data, regression-based modeling, and comparative case stud-ies, questions remain concerning the relevant variables that influence a state’s decision to proliferate (Singh and Way2004; Kaplow and Gartzke2016; Fuhrmann2009b; Fuhrmann and Sechser 2014a; Jo and Gartzke2007; Montgomery and Sagan 2009). Contributing to this literature, this work demonstrates the first use of multiplex network analysis to
examine the relative likelihood of states to acquire nuclear weapons based on external factors.
Network science is a broad area of study that has been applied to a wide range of sub-jects ranging from the spreading of disease to social networks (Valente2010; Scott2017). Political scientists have previously used network characteristics including centrality, den-sity, transitivity, and interdependence, among others, to study conflict, cooperation, influence, and other types of interstate interactions (Maoz et al.2007; Borgatti et al.2009; Hafner-Burton et al.2009; Maoz2009; 2010; Lazer2011; Ward et al.2011; Maoz2012a; 2012b). These monoplex network approaches represent a powerful tool for investigating global systems, but are limited insofar as different types of interactions are considered in isolation (Jackson and Nei2015). As a response to this shortcoming, multiplex networks have emerged in the past decade as a framework allowing for the simultaneous view of a complicated web of different types of interactions (Kivelä et al.2014; Boccaletti et al.
2014; Chapela et al.2015; Newman2003; Pillai and Karabatis2016). By analyzing distinct
relationships in concert rather than individually, multiplex network models provide addi-tional insight into the structure and dynamics of real world interconnected global systems. The approach used in this work models individual network layers with time-series data separately, according to their own specific dynamics, and then combines them to gain a holistic view of how different types of international ties work together to either motivate or deter a state’s potential nuclear weapons program.
Using open-source data, we develop a multiplex network model in which sovereign states (nodes) are connected through four relationships (edges or links) theorized to be correlates of nuclear proliferation: conflict, alliances, nuclear cooperation agreements (NCAs), and trade. While these correlates are by no means an exhaustive set, they pro-vide a basis for a proof-of-concept demonstration of the application of multiplex network analysis to understanding nuclear proliferation. The network model is both multilayer— meaning that multiple networks exist within the model—and multiplex—meaning that each layer of the network is comprised of the same nodes. Node strength metrics produced using this framework quantitatively capture the degree of influence of each rela-tionship variable on an annualized basis and are evaluated using correlation analysis to give a multidimensional perspective on the relative causes of nuclear proliferation.1
The determinants of nuclear proliferation
and the international transfer of nuclear technology and knowledge (Sagan 1997; Jo and Gartzke2007; Fuhrmann2009b; Fuhrmann and Kreps2010; Haggard and Noland
2010; Miller2014; Fuhrmann and Sechser2014b; Solingen1994; Potter2010; Singh and
Way2004). This paper focuses on a subset of external determinants of nuclear
prolif-eration: conflict, alliances, NCAs, and trade. While other important external correlates of proliferation behavior exist (e.g., membership in international institutions, negative security assurances), this proof-of-concept demonstration is limited to those variables commonly highlighted in the nuclear proliferation literature with robust, open-source data categorizing and quantifying the nature of these interstate relationships.
The first correlate of proliferation included in this demonstration is interstate conflict— a measure used to represent the external security concerns of states. Studies from Jo and Gartzke, Fuhrmann, and Kreps and Fuhrmann detail the statistical significance of conflict in contributing to a state’s decision to proliferate (Jo and Gartzke2007; Fuhrmann2009b; Fuhrmann and Kreps2010). Theories that privilege external security concerns posit that states involved in a conflict or facing an existential threat are more likely to proliferate with the goal of achieving their own security (Singer et al.1972). With nuclear capabilities, states might also theoretically increase their bargaining power in high-intensity conflict scenarios (Fuhrmann2009a; Gartzke and Jo2009).
The second correlate examined is alliance relationships, or agreements between two or more states to cooperate on a given set of objectives. Alliances have been hypothesized to increase the security of member states and thus dull state motivations to bolster their security via nuclear weapons (Singh and Way2004). Betts and Thayer offer examples of a “security guarantee” from a nuclear power that effectively substitutes for nuclear weapons (Betts1993; Thayer1995).
Third, the model includes a variable that accounts for nuclear assistance via NCAs— formal agreements in which one state supplies the other with nuclear technologies, materials, expertise, knowledge, or some combination thereof. In prior studies, the receipt of NCAs by a state has been correlated with an increase in proliferation likelihood, as the acquisition of nuclear assistance lowers technical barriers to nuclear weapons produc-tion (Kroenig2009; Fuhrmann 2009a; Maoz2009; Braun and Chyba2004). Brown and Kaplow, Fuhrmann, and Kroenig conclude that nuclear and technical assistance agree-ments increase the likelihood of nuclear proliferation via information sharing and by increasing the latent capability of recipient states (Brown and Kaplow2014; Fuhrmann
2009a; Kroenig 2009). Our model offers a useful test of whether this finding remains
robust.
Finally, we include a trade dependence variable. Trade relationships have been hypoth-esized to influence the proliferation calculus of states, providing leverage for one state to dissuade another from proliferating given the opportunity cost of doing so (Solingen1994; Gleditsch2002). In this work, the chosen metric of trade istrade dependence—the degree to which one state is dependent upon another in its balance of trade (Maoz2010). Solin-gen’s work concerning regional proliferation in East Asia, for example, argues that states pursuing economic liberalization and increased trade ties in a regional context do not pursue nuclear weapons—in spite of constant external security threats (Solingen1994).
Constructing individual layers of the multiplex network
In this section, we detail the operationalization of open-source data to construct weighted monoplex network layers and, in turn, a multiplex network. Unitary states are modeled as nodes with consensus data from established databases used to quantify edges in the form of edge weights.2These are assigned in proportion to the intensity of the connec-tions in the different network layers (Pastor-Satorras and Vespignani2004). That is, the connections between the nodes (edges) have a value associated with them (weight) based on the “strength” of the dyadic relationship between nodes within that layer. For example, edge weights are higher between the United States and North Korea during the thrust of the Korean War, but these weights decrease in value at times where there are less overt actions and threats between the two states. The links are also directed, in that the value associated with the relationship from one node to another is not necessarily the same in the opposite direction. For example, the United States may make an explicit threat to Russia, but the Russian Federation remain silent. In the directed network, this would rep-resent an increased edge weight from the United States to Russia while the edge weight from Russia to the United States would be lower in value.
Each of the four layers in the multiplex network corresponds to a variable theorized to affect nuclear proliferation—conflict, alliances, NCAs, and trade. The edges are built upon historical data from the period 1951–1990.
Conflict variable
The conflict variable engages with existing work that finds that the presence of disputes increases the likelihood of proliferation. To operationalize this, we use the Dyadic Milita-rized Interstate Dispute (MID) database that builds upon the Correlates of War (COW) MID dataset to construct the conflict variable (Ghosn et al.2004). Specifically, we use the variables,HiactAandHiactB, denoting the highest action taken by the respective sides in any given dispute. The variable reflects a low ranking of conflict if states are solely the recipient of conflict action and do not respond (coded as 1). The ranking increases as states threaten (2), display (3), or use force (4). The highest ranking represents a declaration of war (5).
Edges in the monolayer conflict network indicate the presence of a conflict between two states,iandj, and are used to quantify a conflict metric for each dyad:
Cij=Iij. (1)
The measure of conflict,Cij, is equal to the directed conflict intensity,Iij, as defined by the MID Database, whereiis the recipient of conflict action (Jones et al.1996). For example, for two statesiandj, wherejhas issued a display of force toiandidoes not respond,Cij = 3 andCji = 1. As a real-world example, in 1961, the United States is coded as having used force against North Vietnam, but North Vietnam is coded as only displaying its force against the United States. In this case,CNV,US= 4 andCUS,NV = 3. As this work focuses on interactions between states rather than the properties of individual states, factors such as the relative military strength are not included when assessing the conflict metric.
Alliances
from Moaz’s Relative Commitment variable constructed from the Leeds’ Alliance and Treaty Obligation Project dataset (Leeds et al.2002; Maoz2009). The variable is coded into five categories: consultation (1), nonaggression (2), neutrality (3), offense (4), and defense pacts (5).
It is possible for states to share multiple concurrent alliance commitments between them. To account for simultaneous alliances between two states, an alliance commitment variable is used to represent directed edge weights in the alliance layer of the network. As alliances are dyadic, the alliance commitment,Bij, of stateifromjis the sum of the strength of the alliance commitments issued byjtoi:
Bij=
aij. (2)
Using the ranking of alliance strength, for example, for two statesiandj, wherejhas issued a defense commitment toiand a consultation pact is shared, the alliance commit-ment score isBij= 1+5= 6. Conversely, asihas no defense commitment toj,Bji =1. This example is meant only to be illustrative and in the overwhelming majority of cases, alliance commitments are mutual with symmetrical edge weights. For example, in 1971, China and North Korea maintained a mutual defense pact coded as 5, in addition to a mutual non-aggression pact coded as 2, resulting in symmetric directed links with an alliance commitment score (i.e., edge weight) of 7.
Nuclear cooperation agreements
As noted above, NCAs are formal agreements between states to cooperate on one or more matters of nuclear technologies, safety, materials, and knowledge. To address NCAs, the model uses Fuhrmann’s Nuclear Cooperation Agreement Dataset and, specifically, thencatype variable adapted from Keeley’s compilation of NCAs (Fuhrmann2012;
Kee-ley 2009). Fuhrmann’s seven measure scale accounts for nuclear safety, cooperation in
research and training, the transfer of nuclear materials, development towards a research program, development towards a nuclear electricity program, an agreement with no restrictions, and a military assistance agreement. We use this variable to construct a 3-measure ordinal scale of NCAs based on the relevance of the type of nuclear assistance to a nuclear weapons capability from those exclusively concerned with safety-related agreements (1), non-safety-related agreements (2), and finally to agreements dealing with sensitive nuclear assistance (3).3
Safety-related agreements cover only authorized cooperation in the realm of nuclear safety. Non-safety-related NCAs are more significant from the standpoint of enabling the technologies, facilities, materials, and expertise necessary for the development of a nuclear weapons program. These activities cover cooperation in research and devel-opment, training, transfer of nuclear-related materials (e.g., uranium, heavy water, or plutonium), development of a nuclear research program (including export of a research reactor), and development of a nuclear program for electricity production. The final cod-ing considers sensitive nuclear assistance (e.g., enrichment, reprocesscod-ing, etc.) indepen-dent of other non-safety-related NCAs due to the increased proliferation risk associated with these technologies (Fuhrmann2009a; Kroenig2009).
consistency across cases. Further, as additional NCAs may be signed between states over time, the value of each additional NCA is added to the states’ previous NCA metric to account for the accumulation of nuclear materials, expertise, and latent technological capabilities. This coding scheme provides a measure of the amount of nuclear cooperation that occurs between states over time and reflects the accrual of weapons-related infor-mation and technology. The NCA value,nij, is quantified based on the nature of nuclear assistance stateireceives from statej.
As with alliances, states can have multiple NCAs with the same partner. The accumu-lated nuclear cooperation,Nij, that stateireceives from statejis calculated as the sum of each individual NCA coding,nij:
Nij=
nij. (3)
For two statesi andj, wherei has been the recipient of two non-safety-related NCAs from j, but ihas never supplied an NCA to j, Nij = 2 +2 = 4 while Nji = 0. For example, France supplied a safety-related agreement (coded as 1) and a non-safety-related agreement (coded as 2) to the United States in 1958, yielding an accumulated nuclear cooperation value of 3. In addition, a previous safety-related agreement and a non-safety-related agreement by France to the United States was supplied in 1956. As past NCAs are treated as persistent in the model, the directed edge weight in the NCA monolayer for France to the United States was valued atNij=3+3=6 in 1958.
Trade dependence
Trade is included in the model to test its effect on proliferation likelihood, where an edge in the trade monolayer network represents an international exchange of goods and services. While there are many ways to calculate trade dependence and considerable lit-erature in disagreement over the most appropriate method (Gleditsch2002; Mansfield et
al.2002; Gartzke2007), the model uses the Russett and Oneal formulation as it reflects
the economic integration of states into the global economy by measuring the proportion of their economies devoted to bilateral trade (Oneal and Russet1997; Oneal and Russett
1999; Russett and Oneal1999).
Trade dependence,Dij, measures the total trade between two states as a fraction of each state’s gross domestic product (GDP). For two states,iandj, the trade dependence,Dij, of stateionjequals its exports toj,Exij, plus its imports fromj,Imji, divided by its GDP:
Dij=
Exij+Imji GDPi
. (4)
Trade dependence is asymmetric as it is shaped by the relative strength of the state’s econ-omy and the degree of dependence on a particular partner. For example, in 1990, the United States’ trade dependence upon China was 0.003 while the Chinese trade depen-dence on the United States was 0.12, indicating that China’s GDP was more dependent on trade with the United States than U.S. GDP was dependent on trade with China.
Multiplex network analysis
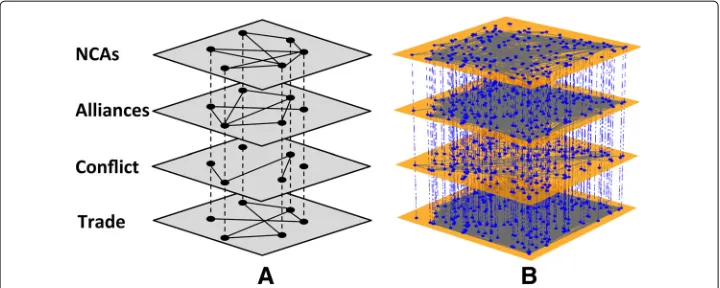
Fig. 1An illustrative multiplex network of proliferation-relevant determinants, with layers from top to bottom showing the NCAs, alliances, conflict, and trade relationships between nodes. Panelashows a schematic network representation, where the nodes represent states. These nodes participate in all network layers, but the relationships between nodes (edges) are unique in each layer based on the relevant interstate relations. Panelbshows the full network representation of the model for the year 1980, built using open-source data
we provide a framework for quantifying global dynamics in such an interconnected sys-tem. First, we determine monolayer metrics for each of the variables on a country-year basis. These monolayer metrics allow for the comparison of the relative importance of each variable in explaining proliferation. We then quantify a state’s annualized pro-liferation metric based on the four variables outlined above using a weighted sum of normalized monolayer metrics, where the weights are determined via a historical analysis of the relative importance of the various proliferation determinants. This process yields the annualized proliferation metric,Ri(t), for each node in the multiplex network.4 As the temporal evolution of the multiplex network is treated as a series of annual snapshots, the merger or disintegration of states (e.g., the reunification of East and West Germany in 1990, in the case of the former) results in a change in the number of nodes as a function of year.
While methods for dealing with correlated data in multiplex networks exist (Nicosia and Latora 2015), this work treats network layers as independent as an initial explo-ration of the applicability of network science in this space. Given potential correlations between the variables, future studies of nuclear weapons proliferation should go beyond the basic combinatorics used in this proof-of-concept to look closely at the interdepen-dent effects of political, security, and economic networks within which decisions about nuclear weapons are made (Morone et al.2015).
Within network: monolayer metrics
The first step in the multiplex network analysis is to construct node-based metrics for each layer. To construct the monolayer metric, letLdenote the set of layers in the mul-tiplex network (i.e.,L= {conflicts, alliances, NCAs, trade}). For a given layer,x ∈ L, the contribution to the proliferation metric per year,R(i|x)(t), is defined by the node strength (Opsahl et al.2010). That is,
R(i|x)(t)= n
j=1
wherejis an index of node edges,nis the degree of theith node in yeart, andfij is the edge weight between theith andjth nodes in yeart. The node degree is defined as the number of connections a node has to other nodes in the monolayer network. The edge weights are given byCij,Bij,Nij, andDijfor the conflict, alliance, NCA, and trade layers, respectively. These monolayer metrics are then combined across networks to attain the desired proliferation metric described in the next section.
Across networks: proliferation metrics
The next step in the analysis is to combine each of the monolayer metrics into a prolifer-ation metric,Ri(t), across all layers in the model. To determineRi(t)for theith node, the monolayer metrics defined in Eq.5are normalized and combined using a weighted sum:
Ri(t)=
x∈L
wx(t−1)Rˆi|x(t) (6)
wherewx(t−1)is a weighting factor representing the influence of thexth layer on the proliferation metric determined in yeart−1 andRˆi|x(t)is the normalized contribution to the proliferation metric of nodeiarising from thexth layer in yeart. The monolayer network metrics are normalized on a year-by-year basis using min-max scaling, which provides a linear transformation of the entire range of values for each variable to the range from−1 to 1. This ensures an equal relative contribution from each monolayer. That is, although the variable scaling differs within each monolayer network, normalization ensures that the relative importance of the determinant associated with each monolayer is appropriately quantified by the weighting factors and not influenced by the magnitude of the individual variables. We assess the weighting factors using historical proliferation data from the previous(t−1)year. This is done to reflect imperfect knowledge of global nuclear proliferation activity in the year that the assessment of the proliferation metric is performed, where it is assumed that the relative importance of different types of relation-ships to a state’s proliferation calculus in the current year is similar to that of the previous year.
Weighting factors are determined on a year-by-year basis as the correlation between theRˆi|x(t)values in a given layer and the Singh and Way proliferation metric,p, obtained using a linear scale derived from known historical cases of nuclear weapons inactivity (p= 0), exploration(p= 1), pursuit(p= 2), and acquisition(p= 3)(Singh and Way 2004). The Singh and Way metric is used as it offers greater granularity than alternative measures of nuclear proliferation-relevant activity and has been applied extensively in research and analysis related to nuclear proliferation.5The weighting factor,wx, is quan-tified using the Pearson correlation coefficient between the proliferation metric and the monolayer network metrics (Pearson1931; 1929; Edgell and Noon1984).
More formally, letkbe the number of nodes in the network (kvaries from 77 in 1952 to 161 in 1990 due to data availability and the geopolitical events that alter state sovereignty or territorial integrity). Then,wx, is calculated on a year-by-year basis using the variances and covariances of the Singh and Way proliferation metric,p, and the monolayer metric Ri|x:
wx=
k
(i=1)(pi− ¯p)(Ri|x− ¯Rx)
k
(i=1)(pi− ¯p)2(ki=1)(Ri|x− ¯Rx)2
wherepiis the Singh and Way proliferation metric of theith node in a given year,p¯is the mean of the Singh and Way proliferation metrics for all nodes in a given year,Ri|x is the monolayer metric of theith node in a given year, andR¯x is the mean of the monolayer metrics for all nodes in thexth layer in a given year.
Correlations in complex networks
Figure2provides the results of the correlation analysis between monolayer metrics and the proliferation metric provided by Singh and Way. Layers with a positive coefficient are correlated with an increase in the likelihood of nuclear proliferation while the layers with a negative coefficient are correlated with a reduced likelihood of nuclear proliferation.
As shown in Fig. 2, the incidence of conflict is positively correlated with state proliferation-relevant behavior. This finding provides further evidence that security con-cerns drive proliferation behavior—underlining findings in the existing proliferation literature detailing the statistical significance of conflict in contributing to a state’s nuclear proliferation (Fuhrmann2009b; Jo and Gartzke2007; Fuhrmann and Kreps2010).
Second, nuclear cooperation agreements generally have the strongest correlation with proliferation-relevant activity. This result mirrors Fuhrmann’s argument concerning the unintended consequences of nuclear cooperation agreements (Fuhrmann2009a). It is also a particularly relevant finding given the responsibility of nuclear states to facilitate the “fullest possible exchange of equipment, materials and scientific and technological infor-mation” related to peaceful uses of nuclear technology in Article IV of the Treaty on the Non-Proliferation of Nuclear Weapons.
Contrary to existing scholarship that theorizes that alliances decrease the likeli-hood of proliferation, our analysis suggests that the correlation between alliances and proliferation-relevant activity is marginally positive and over time moves towards zero. This finding raises questions for policy-makers concerning the utility of negative secu-rity assurances, nuclear umbrellas, and extended deterrence strategies for arresting state
proliferation. The salience of alliances also appears to consistently decrease as a function of time. Indeed, the movement toward zero suggests that alliances do not influence the spread of nuclear weapons positively or negatively. Given existing scholarship that the-orizes the moderating effects of alliances on proliferation, this finding suggests further study is necessary to understand the specific conditions under which alliances influence proliferation. Understanding these conditions is particularly important for U.S. policy-makers given the importance assigned to its extended deterrence commitments in Europe and Asia, designed to both deter regional powers and avoid proliferation in Japan, South Korea, and Germany, among others.
The correlation values for trade dependence are marginally negative. This finding underlines previous work that outlines the power of a highly interconnected global econ-omy to dissuade states from engaging in taboo behaviors that may result in isolation and economic sanctions. This finding may also reflect the hypothesized opportunity costs of proliferation-relevant behavior, in which states forego nuclear proliferation to obtain the benefits of integration into the global economy. For policy-makers, a negative correla-tion between proliferacorrela-tion and trade dependence is of interest given the costs of isolating potential proliferators and the creation of a variety of sanctions regimes targeting states believed to be surreptitiously pursuing a nuclear weapons program. Indeed, this suggests that sanctions may have the unintended consequence of making proliferation more likely by decreasing the dependence of the target state upon outside trade that might otherwise mitigate its proliferation risk.
Furthermore, the correlation between proliferation and alliances, trade, and NCAs tends to vary smoothly with time, consistent with the assumption of gradual change in the temporal profile of the importance of the various relationships to a state’s prolifera-tion calculus. With that said, the correlaprolifera-tion between conflict and nuclear proliferaprolifera-tion exhibits fluctuations throughout the nuclear age. This fluctuation may be explained in three ways. First, it may suggest a more dynamic conflict environment from year to year. Second, conflict may have a latent effect upon a state’s decision to pursue its nuclear pro-gram that country-year data do not capture. Third, nuclear weapons propro-grams may have an inertia that make them difficult to arrest once they begin. In the following section, we use various methods to test the model performance against observational data.
Model performance
model input due to both lack of knowledge (e.g., an undocumented NCA) and inherent variability (e.g., ordinal coding of the threat of force in conflict intensity using qualita-tive and subjecqualita-tive metrics) results in uncertainty in the assessment of the proliferation metric. In lieu of a probabilistic uncertainty quantification, we perform a statistical anal-ysis that compares the results from the model against the empirical record to assess the internal validity of the model.
Rank analysis
In this test, we examine the performance of the multiplex network analysis with the goal of quantifying the success of the model in differentiating states with and with-out proliferation activity. To this end, we investigate the magnitude of the proliferation metric on a state-by-state basis in relation to the empirical record. This rank analysis further compares states that have exercised the exploration, pursuit, or acquisition of nuclear weapons versus clearly non-nuclear states, and demonstrates that the model can be used to distinguish between proliferators and non-proliferators with strong statistical significance.
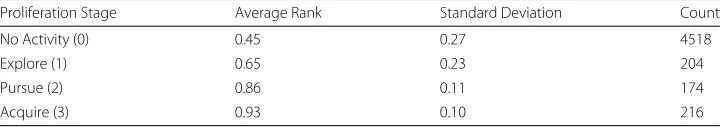
To compare the output of our model against the historical record, states are first ranked based on their proliferation metric in a given year from highest to lowest. The rank analysis converts the ordinal rank of a state in the proliferation metric distribution to a percentile rank, where the highest proliferation metric in a given year corresponds to 100% (rank 1) and the lowest corresponds to 0% (rank 0). This approach accounts for the changing number of nodes in the network as a function of year. For all years represented in the model, we determine the percentile rank for the four categories of state defined by the Singh and Way proliferation metric of 0 (no activity), 1 (explore), 2 (pursue), and 3 (acquire). We then average the percentile ranks for all of the states in each category over the year range of 1951-1990, as shown in Table1.
The average percentile rank increases as the proliferation stage progresses towards nuclear weapons acquisition. This suggests that the model yields, on average, higher pro-liferation metric values for states with a more advanced propro-liferation status and broadly reflects the empirical record. Indeed, the model allows for differentiation between states with nuclear weapons programs and those with no nuclear weapons related activity within one standard deviation. The large standard deviations prevent the individualized differentiation of states exploring, pursuing, and acquiring nuclear weapons using the proliferation metric defined in this work. However, inclusion of additional external prolif-eration determinants (e.g., economic sanctions, participation in nonprolifprolif-eration treaties or regimes, etc.), internal proliferation determinants (e.g., regime type, leadership psy-chology, indigenous technological proficiency, etc.), and correlation across layers that
Table 1Average percentile rank of each state’s proliferation metric grouped by proliferation stage
Proliferation Stage Average Rank Standard Deviation Count
No Activity (0) 0.45 0.27 4518
Explore (1) 0.65 0.23 204
Pursue (2) 0.86 0.11 174
Acquire (3) 0.93 0.10 216
captures the interplay between motivation and technical capability may serve to improve model resolution.
Statistical analysis
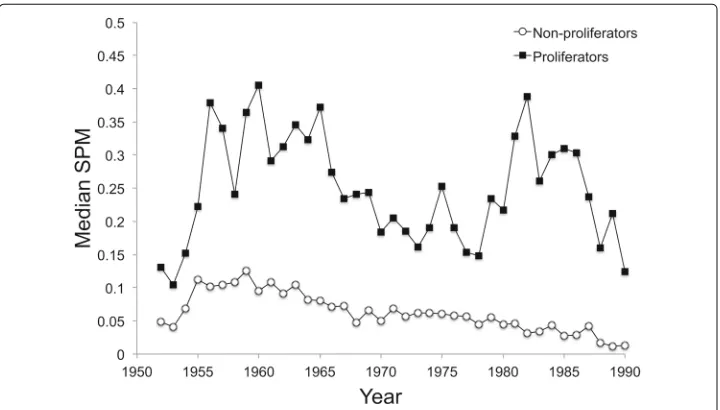
Next, we determine the median proliferation metric for states grouped into two sample sets: those without and those with proliferation activity (the latter includes the subgroups of explore, pursue, and acquire), as illustrated in Fig.3.
We then performed a Mann WhitneyU test to quantify the statistical significance of the difference between the median proliferation metric values for the two sample sets (Mann and Whitney1947). This, in combination with the percentile rank analysis, pro-vides a quantitative assessment of whether states with proliferation activity were valued at higher proliferation metric values using the network model. The use of two groups refo-cuses the performance assessment on illuminating proliferators within the total sample population.
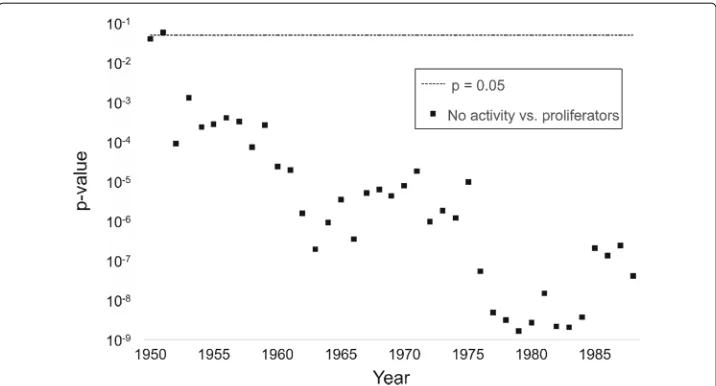
The results from the Mann-WhitneyUtest were used to generate a p-value as a func-tion of year, shown in Fig.4, reflective of the probability that the median proliferation metric values for states with and without proliferation activity are equal. Thep-values for the year range of 1951–1990 varied from 10−9to 0.06. With the exception of 1953, all p-values lie below a statistical significance threshold of 0.05. The relatively higher p-values in the early 1950s may be due in part the relative youth of nuclear weapons, where proliferation behavior is more strongly driven by technical capability rather than geopolitical concerns. Thep-value tends to decrease as a function of time indicating an increased robustness of the multiplex network model to differentiate proliferators in later years.
Taken together, the performance evaluations suggest that the differences between pro-liferators and non-propro-liferators are well-established by the proliferation metric and that the network analysis has external validity when compared against the empirical record.
Fig. 4Thep-value characterizing the median proliferation metrics for proliferators versus non-proliferators as a function of year
The Iran case
In this section, we examine the case of Iran across the time period included in the model. Iran offers a useful case given the variation in its level of proliferation—as indicated in several studies (Singh and Way2004; Kroenig2009)—and its continued policy relevance amid disagreement among policy-makers about the appropriate policies to encourage nonproliferation (Reardon2012; Waltz2012).
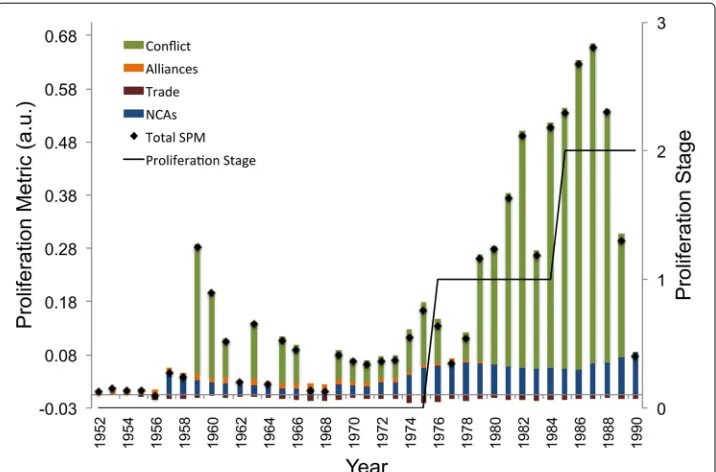
Iran’s nuclear ambitions in the five decades covered by our model can usefully be split into two phases: the first, in the 1960s and 1970s prior to the Islamic Revolution and the second, in the 1980s during its conflict with Iraq. These phases, appropriately, reflect the rise in the proliferation metric from the multiplex model, as shown in Fig.5.
Fig. 5The proliferation metric for Iran as a function of year. The monolayer contributions to the proliferation metric are shown in the stacked bar, and the filled diamonds give the total proliferation metric. Iran’s proliferation stage is plotted on the secondary ordinate axis
By the mid-1980s—and during a period of intense conflict with neighboring Iraq—these convictions changed with the Iranian regime calling for its nuclear scientists abroad to return to Iran as, “deterring Iraq became the principal rationale for the current regime’s revival of the country’s nuclear weapons program” (Bowen and Kidd2004). Once again, the model trends well with Iran’s proliferation trajectory, as shown by the increasing proliferation metric—primarily driven by an increase in the conflict environment— immediately prior to the decision to explore (Stage=1) then pursue (Stage=2) a nuclear program in 1984. Indeed, Iran’s nuclear program reached its highest proliferation stage during the period under review in 1988 with the separation of plutonium from irradi-ated uranium at the Tehran Research Reactor (Bowen and Kidd2004). By the early 1990s, Iran was once again seeking foreign assistance—this time from Moscow and Beijing— to complete the nuclear reactors that were moth-balled following the 1979 Revolution even as the threat from neighboring Iraq decreased following the cessation of hostilities and the outbreak of the First Gulf War. Once again, Iran’s proliferation timeline (i.e., the proliferation stage metric in Fig.5) closely mirrors the increase in the conflict metric.
Conclusions, implications, and future work
In this demonstration of the application of multiplex modeling in the nuclear domain, we quantify each state’s relative proliferation motivation as a node-based metric of its rela-tions with other states, explore the variables that correlate with proliferation decisions, and test this metric against the empirical record to demonstrate the utility of multiplex network modeling.
model provides a framework for policymakers to consider the effects of interstate inter-actions on proliferation decision-making utilizing real-time, observable data on political and economic relations. Beyond the four determinants considered in this work, the model can be refined in resolution (e.g., to include data on regional rivalry, strategic trade, non-proliferation treaties, nuclear weapon free zones, nuclear umbrella coverage, etc.) with different intra- and inter-layer network dynamics. Future work, for example, might also consider node attributes for each state to model the internal determinants of prolifera-tion (such as regime type) in addiprolifera-tion to the external factors discussed herein. One might also consider indirect ties or “friend-of-friend” relations, which have been shown to affect the security-seeking behavior of states (Singh and Way2004; Lupu and Traag2013).Aside from state-level proliferation, future work may also explore the use of graph metrics such as transitivity or degree of multiplexity to characterize global proliferation-relevant phenomena. Similarly, network neighborhood analysis may be used to explore subgraph features reflective of military alliance blocs, such as NATO or (historically) the Warsaw Pact, or multilateral agreements such as the Treaty on the Nonproliferation of Nuclear Weapons. Taken together, the potential contribution of the multiplex modeling approach to exploring appropriate nonproliferation policy solutions is considerable.
Multiplex network analysis may also be usefully applied to entirely different social science questions. For example, this method might be used to examine state motiva-tions for joining international organizamotiva-tions. Alternatively, future research might consider conflict as a dependent variable to examine the network-related determinants of war such as neighborhood dynamics, relative wealth, regime type, and international orga-nization membership. The multiplex network methodology exemplified in this paper extends traditional network approaches to consider real-world, multi-relational complex-ity and offers a new paradigm within which to explore the structure and dynamics of interconnected global systems.
Endnotes
1The model does not yield a measure of absolute proliferation likelihood, as there are a
variety of both domestic and inter-state proliferation determinants that are not included in this demonstration.
2Future work might consider both non-state actors and military alliance blocs such as
NATO or (historically) the Warsaw Pact as nodes in a network.
3Safety agreements are drawn from a score of 1 on Fuhrmann’s scale, non-safety
agreements account for score 2-5, and sensitive agreements are drawn from scores 6 and 7.
4For any two statesiandj, a large value ofR
irelative toRjindicates that stateiis more motivated by the examined variables to proliferate than statej.
5Other metrics considered by the research team include the NPROGRAM and
NWEAPON variables included in Jo and Gartzke (2007) and a series of dichotomous measures.
Acknowledgements
Funding
This work was supported by the Department of Energy National Nuclear Security Administration Office of Defense Nuclear Nonproliferation Research & Development and the Nuclear Science and Security Consortium under Award Numbers DE-NA-0000979 and DE-NA-0003180.
Availability of data and materials
The datasets used and/or analysed during the current study are available from the corresponding author on reasonable request. These datasets were derived, in part, from the following public domain resources:
The Alliance Treaty Obligations and Provisions (ATOP) project:http://www.atopdata.org/
The Correlates of War Project’s Militarized Interstate Disputes (MIDs) Dataset:http://cow.dss.ucdavis.edu/data-sets/MIDs Nuclear Cooperation Agreement (NCA) Dataset:http://www.matthewfuhrmann.com/datasets.html
The Correlates of Nuclear Proliferation: Supplement:https://doi.org/10.1177/0022002704269655 Nuclear Proliferation Dates, 1945–2009https://doi.org/10.1111/ajps.12080
Authors’ contributions
BG, TH, and NM conceived the multiplex model. AR drafted the manuscript and evaluated the Iran case study. TH compiled the datasets used in this study. BG, NM, JB, SL, and EK performed data analysis and interpretation. AW conceived and performed the model performance evaluation tests. BG, EK, and YM performed data visualization. All the authors read and approved the final manuscript.
Competing interests
The authors declare that they have no competing interests.
Publisher’s Note
Springer Nature remains neutral with regard to jurisdictional claims in published maps and institutional affiliations.
Author details
1Department of Nuclear Engineering, University of California, Berkeley, 2150 Shattuck Ave, Suite 230, 94704 Berkeley, CA,
USA.2Department of Political Science, University of California, Berkeley, 210 Barrows Hall, 94720 Berkeley, CA, USA.3Air Force Institute of Technology, Wright Patterson Air Force Base, Ohio 45433 USA.
Received: 24 January 2019 Accepted: 7 May 2019
References
Albright D (2005) Iran’s Nuclear Program: Status, Risks, and Prospects. McNair Papers 69:53–70 Bahgat G (2006) Nuclear Proliferation: The Islamic Republic of Iran. Iran Stud 39(3):307–327 Betts RK (1993) Paranoids, pygmies, pariahs and nonproliferation revisited. Secur Stud 2(3-4):100–124
Boccaletti S, Bianconi G, Criado R, del Genio CI, Gómez-Gardeñes J, Romance M, Sendiña-Nadal I, Wang Z, Zanin M (2014) The structure and dynamics of multilayer networks. Phys Rep 544(1):1–122.https://doi.org/10.1016/j.physrep.2014.07. 001
Borgatti SP, Mehra A, Brass DJ, Labianca G (2009) Network analysis in the social sciences. Science 323(5916):892–895 Bowen WQ, Kidd J (2004) The Iranian nuclear challenge. Int Aff 80(2):257–276
Braun C, Chyba CF (2004) Proliferation rings: New challenges to the nuclear nonproliferation regime. Int Secur 29(2):5–49 Brown RL, Kaplow JM (2014) Talking peace, making weapons: IAEA technical cooperation and nuclear proliferation. J
Confl Resolut 58(3):402–428
Burr W (2009) A brief history of US-Iranian nuclear negotiations. Bull At Sci 65(1):21–34
Chapela V, Criado R, Moral S, Romance M (2015) Mathematical Foundations: Complex Networks and Graphs (A Review). Springer, Cham
Edgell SE, Noon SM (1984) Effect of violation of normality on the t test of the correlation coefficient. Psychol Bull 95(3):576 Fuhrmann M (2009) Spreading Temptation: Proliferation and peaceful nuclear cooperation agreements. Int Secur
34(1):7–41
Fuhrmann M (2009) Taking a walk on the supply side: The determinants of civilian nuclear cooperation. J Confl Resolut 53(2):181–208
Fuhrmann M (2012) Atomic Assistance: How “Atoms for Peace” Programs Cause Nuclear Insecurity. Cornell University Press, Ithaca, United States
Fuhrmann M, Kreps SE (2010) Targeting Nuclear Programs in War and Peace: A Quantitative Empirical Analysis, 1941-2000. J Confl Resolut 54(6):831–859
Fuhrmann M, Sechser TS (2014) Nuclear strategy, nonproliferation, and the causes of foreign nuclear deployments. J Confl Resolut 58(3):455–480
Fuhrmann M, Sechser TS (2014) Signaling Alliance Commitments: Hand-Tying and Sunk Costs in Extended Nuclear Deterrence. Am J Polit Sci 58(4):919–935
Gartzke E (2007) The capitalist peace. Am J Polit Sci 51(1):166–191
Gartzke E, Jo D-J (2009) Bargaining, nuclear proliferation, and interstate disputes. J Confl Resolut 53(2):209–233 Gartzke E, Kroenig M (2009) A strategic approach to nuclear proliferation. J Confl Resolut 53(2):151–160
Ghosn F, Palmer G, Bremer SA (2004) The MID3 data set, 1993–2001: Procedures, coding rules, and description. Confl Manag Peace Sci 21(2):133–154
Gleditsch KS (2002) Expanded Trade and GDP Data. J Confl Resolut 46(5):712–724
Hafner-Burton EM, Kahler M, Montgomery AH (2009) Network analysis for international relations. Int Organ 63(3):559–592 Haggard S, Noland M (2010) Witness to Transformation: Refugee Insights Into North Korea. Peterson Institute for
Hymans JE (2010) When does a state become a “nuclear weapon state”? The Nonproliferation Rev 17(1):161–180 Jackson MO, Nei S (2015) Networks of military alliances, wars, and international trade. Proc Natl Acad Sci
112(50):15277–15284
Jo D-J, Gartzke E (2007) Determinants of nuclear weapons proliferation. J Confl Resolut 51(1):167–194
Jones DM, Bremer SA, Singer JD (1996) Militarized interstate disputes, 1816–1992: Rationale, coding rules, and empirical patterns. Confl Manag Peace Sci 15(2):163–213
Kaplow JM, Gartzke E (2016) Predicting Proliferation: High Reliability Forecasting Models of Nuclear Proliferation as a Policy and Analytical Aid. Calhoun: Institutional Archive of the Naval Postgraduate School, Monterey
Keeley JF (2009) A List of Bilateral Civilian Nuclear Co-operation Agreements. University of Calgary, Calgary Kivelä M, Arenas A, Barthelemy M, Gleeson JP, Moreno Y, Porter MA (2014) Multilayer networks. J Compl Netw
2(3):203–271.https://doi.org/10.1093/comnet/cnu016
Kroenig M (2009) Importing the bomb: Sensitive nuclear assistance and nuclear proliferation. J Confl Resolut 53(2):161–180
Lazer D (2011) Networks in political science: Back to the future. PS: Polit Sci & Polit 44(1):61–68
Leeds B, Ritter J, Mitchell S, Long A (2002) Alliance treaty obligations and provisions, 1815-1944. Int Interact 28(3):237–260 Lupu Y, Traag VA (2013) Trading communities, the networked structure of international relations, and the Kantian peace.
J Confl Resolut 57(6):1011–1042
Mann HB, Whitney DR (1947) On a test of whether one of two random variables is stochastically larger than the other. Ann Math Stat 18:50–60
Mansfield ED, Milner HV, Rosendorff BP (2002) Why democracies cooperate more: Electoral control and international trade agreements. Int Organ 56(3):477–513
Maoz Z (2009) The effects of strategic and economic interdependence on international conflict across levels of analysis. Am J Polit Sci 53(1):223–240
Maoz Z (2010) Networks of Nations: The Evolution, Structure, and Impact of International Networks, 1816–2001, Vol. 32. Cambridge University Press, Cambridge
Maoz Z (2012) How network analysis can inform the study of international relations. Confl Manag Peace Sci 29(3):247–256 Maoz Z (2012) Preferential attachment, homopohily, and the structure of international networks. Confl Manag Peace Sci
29(3):341–369
Maoz Z, Terris LG, Kuperman RD, Talmud I (2007) What is the enemy of my enemy? J Polit 69(1):100–115 Miller NL (2014) The secret success of nonproliferation sanctions. Intl Organ 68(4):913–944
Montgomery AH, Sagan SD (2009) The perils of predicting proliferation. J Confl Resolut 53(2):302–328
Morone F, Makse HA, et al (2015) Influence maximization in complex networks through optimal percolation. Nature 524(7563):65–68
Newman M (2003) The structure and function of complex networks. SIAM Rev 45(2):167–256.https://doi.org/10.1137/ S003614450342480
Nicosia V, Latora V (2015) Measuring and modeling correlations in multiplex networks. Phys Rev E 92(3):032805 Oneal JR, Russet BM (1997) The classical liberals were right: Democracy, interdependence, and conflict, 1950–1985. Int
Stud Q 41(2):267–294
Oneal JR, Russett B (1999) Assessing the liberal peace with alternative specifications: Trade still reduces conflict. J Peace Res 36(4):423–442
Opsahl T, Agneessens F, Skvoretz J (2010) Node centrality in weighted networks: Generalizing degree and shortest paths. Soc Netw 32(3):245–251
Pastor-Satorras R, Vespignani A (2004) The architecture of complex weighted network. Proc Natl Acad Sci 101:3747–3752 Pearson ES (1929) Some notes on sampling tests with two variables. Biometrika 21(1):337–360
Pearson ES (1931) The test of significance for the correlation coefficient. J Am Stat Assoc 26(174):128–134
Pillai M, Karabatis G (2016) Using multiplex networks to model cybersecurity attack profiles. In: In: Debruyne C, Panetto H, Meersman R, Dillon T, Kühn E, O’Sullivan D, Ardagna CA (eds). On the Move to Meaningful Internet Systems: OTM 2016 Conferences. Springer, Cham. pp 918–933
Potter WC (2010) The NPT & the sources of nuclear restraint. Daedalus 139(1):68–81
Reardon RJ (2012) Containing Iran: Strategies for Addressing the Iranian Nuclear Challenge. Rand Corporation, Santa Monica
Rublee MR (2009) Nonproliferation Norms: Why States Choose Nuclear Restraint. University of Georgia Press, Athens Russett BM, Oneal JR (1999) The Kantian peace: The pacific benefits of democracy, interdependence, and international
organizations, 1885-1992. World Polit 52(1):1–37
Sagan SD (1997) Why do states build nuclear weapons? three models in search of a bomb. Intl Secur 21(3):54–86 Scott J (2017) Social Network Analysis. Sage Publications Ltd, Los Angeles
Sherman WR (2018) How We Got the Iran Deal: And Why We’ll Miss It. Foreign Aff 97:186
Singer JD, Bremer S, Stuckey J (1972) Capability distribution, uncertainty, and major power war, 1820-1965. In: In: Russett BM (ed). Peace, War, and Numbers. Sage Publications, Beverly Hills. pp 19–48
Singh S, Way CR (2004) The correlates of nuclear proliferation: A quantitative test. J Confl Resolut 48(6):859–885 Solingen E (1994) The political economy of nuclear restraint. Intl Secur 19(2):126–169
Thayer BA (1995) The causes of nuclear proliferation and the utility of the nuclear non-proliferation regime. Secur Stud 4(3):463–519
Valente TW (2010) Social Networks and Health: Models, Methods, and Applications. Oxford University Press, New York Waltz KN (2012) Why Iran should get the bomb: Nuclear balancing would mean stability. Foreign Aff 91(4):2–5. JSTOR,
www.jstor.org/stable/23218033